 🏢 Co-op
144-55 Melbourne Ave Unit 2E · New York, NY
Flood risk 1/10 · Minimal
- FEMA flood zone
- X (unshaded)
- Chance of flooding over 30 yrs
- 0.0%
- Est. flood insurance / yr
- $507 – $1,088
Fire risk 1/10 · Minimal
- Est. fire insurance / yr
- $691 – $1,283
Heat risk 6/10 · Moderate
- Hot days now (above 99°F)
- 7 days/yr
- Hot days in 30 yrs
- 15 days/yr
Wind risk 6/10 · Moderate
- Chance of severe wind over 30 yrs
- 27.0%
Air-quality risk 4/10 · Minor
- Unhealthy air days now
- 6 days/yr
- Unhealthy air days in 30 yrs
- 6 days/yr
Risk factors via First Street. Map © Google.
Why this score? — see what drove the F grade
The composite is a weighted blend of 9 inputs, each scored 0–100. Each bar is that input's sub-score; the figure is the points it added to the 100-point composite (weight × sub-score).
- 1% rule +8.9/10.0
- ARV discount +7.5/15.0
- Schools +5.0/10.0
- Cash flow +4.7/30.0
- Livability +3.8/5.0
- Rent growth +2.5/5.0
- Condition / age +2.2/5.0
- DSCR +0.0/10.0
- Appreciation +0.0/10.0
$215,000
🖨 Deal sheet 📄 Offer letter ✓ Due diligence
Listing remarks
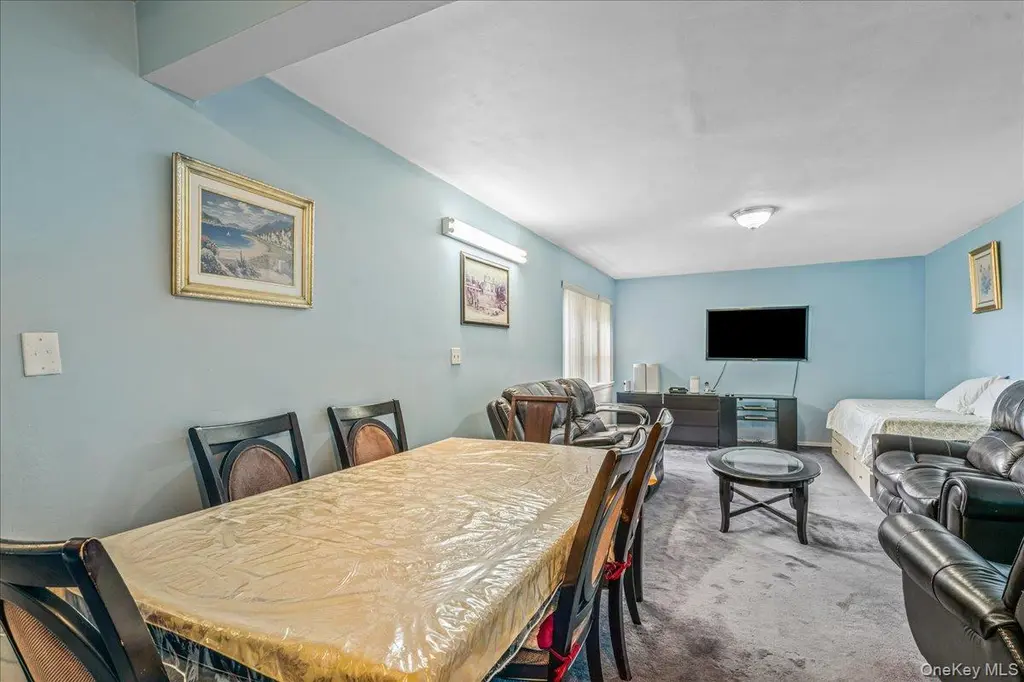
Owner Occupied (No Sublets) This is the largest 2BR/1BA Coop Unit In The Building, Well Maintained, and has a Lot of Closets, and an Eat-in kitchen DR/LR, and All utilities are included. Eat in Kitchen, Dishwasher. Laundry, Outdoor / Indoor Parking, Bike-room, Storage Room, Outdoor Sitting Area. Close To Transportation, City-Bus, Easy Access To major highways, Close To Shopping Center, Queens Library, Post Office, Schools, Supermarket, Etc. All Information Deemed Accurate However Should Be Independently Verified
Key facts
- Indoor parking
- Bike-room
- Eat in kitchen
Tags
Property features AI
Finance
- Other: Living area reported from other source
- HOA & community: Monthly association fee; Association fee covers utilities, electricity, gas, heat, hot water, water, sewer, trash, common area maintenance, exterior maintenance, grounds care, snow removal and trash
Exterior
- Parking: Underground parking lot; 1 garage space; Parking fee applicable ($50)
- Utilities: Public sewer; Association-provided utilities and services (see HOA section for details)
- Home design: Stock cooperative; 6 total stories
- Construction: Brick construction
- Exterior features: Brick construction; Not waterfront
Interior
- Kitchen: Dishwasher; Gas oven; Gas range; Oven; Range; Refrigerator
- Bedrooms: 4 rooms total (includes bedrooms and other living spaces); Entry level: 2
- Flooring: Carpet
- Bathrooms: 1 full bathroom
- Heating & cooling: Forced air heating; Wall/window air conditioning units
- Interior features: Eat-in kitchen; Elevator
- Laundry & utility: Dedicated laundry room
Neighborhood map
What this means for you Summary
Snapshot
- This is a 2-bed/1.0-bath condo listed at $215k. Condition is rated fair.
Deal economics
- At list price, monthly cash flow is $-536 ($-6k/yr) — negative.
- The deal already cash-flows at list — no discount required.
- Meets the 1% rule at list price ($3k rent vs $215k).
- Recommended offer: $209k (3.0% below list) — sets the bar for market timing.
- Cap rate 3.3% vs local median 2.6% in New York — meaningfully above typical; check what's discounted (condition, days-on-market, listing class) to confirm the premium yield is real.
Location & tenants
- Location reads 75/100 on livability (#268 in NY, #4,188 nationally) — a middle-class / working-renter tenant base. Strengths: amenities A+, commute A+, health & safety A; Watch: crime F, cost of living F.
- Market conditions: 259 active listings in the ZIP; 40 comparable units currently listed for rent nearby; rentals at typical pace (median 19d on market — plan ~3-4 weeks tenant-placement turnaround); solid renter incomes; 5,302 units permitted in Queens County in 2024 (4,918 in 5+ unit buildings).
- At $2,990/mo this rent would consume 48% of the median local household income ($75k/yr) (locally 2010% of renters already pay >50% of income on rent) — very limited rent-growth headroom before tenants either downsize or default.
Forward outlook
- Local home prices are declining (-3.0%/yr); year-one equity from $1k of loan paydown is wiped out by about $6k of value loss. Plan a longer hold.
- Queens County population projected at +16% by 2050 — long-run rental-demand tailwind backs the buy-and-hold thesis.
Negotiation context
- It's been on market 45 days — a 3% lower offer ($209k) is reasonable based on typical stale-listing flexibility.
- 4 sale attempts since 2y ago with the ask held roughly flat each time — persistent listings suggest the price (not the market) is what's stuck; bring a comps-based counter.
Risks & watch-outs
- Watch-outs: HOA is 47% of rent; built in 1954 — expect roof / HVAC / electrical / plumbing capex.
- Climate carrying-cost: major wind risk, 27% chance of damaging wind over 30y; extreme-heat days projected 7→15/yr by 2055 (HVAC capex compounding) — expect insurance premiums to compound above CPI over the hold.
Questions for the listing agent
- What do current leases actually rent for vs. the listed asking? Can we see a recent rent roll and the last 12 months of T-12 income?
- It's been on market 45 days. Have you received any prior offers? Is the seller open to a 3% concession, seller financing, or rate buy-down credit?
- Have any recent inspections been done? Can we get a copy of the seller's disclosures and any deferred-maintenance estimates?
- Built in 1954 — when were the roof, HVAC, electrical panel, plumbing, and water heater last replaced?
- What does the HOA fee cover, when was the last increase, and are there any pending special assessments or reserve-fund shortfalls?
- Any open or pending special assessments — roof, HVAC, plumbing, elevator, façade? What's the per-unit balance and payoff schedule, and is the seller paying it off at close or rolling it to the buyer?
- Is there a deadline driving the sale (1031 exchange, divorce, estate, relocation)? That informs how much negotiation room exists.
- Schools are B-rated — typically a magnet for longer-tenancy family renters. What's the average tenant stay here, and is there a school-zone premium baked into asking?
- Crime grade is F in this area — have there been break-ins, vandalism, or insurance claims at this property in the last 3 years? What carrier currently insures it and at what premium?
- The area grade is low — what's the realistic commute time and amenity access for the typical tenant pool here? Any planned neighborhood developments (good or bad) we should know about?
- What's the average days-on-market for RENTAL listings here right now (not sales)? A rising rental-DOM trend means longer vacancies and softer asking-rent achievability than the comps imply.
- What's the recent tenant-quality profile in this submarket — average credit score on applications, eviction rate, late-payment / NSF rate, and stable-employment percentage? A property-management company in the area should have these aggregated.
- How much new apartment / multifamily construction is in the pipeline within 1–3 miles? Heavy new supply (>2% of stock underway) typically softens rents 12–24 months out; light construction supports rent growth.
Investment metrics
- 1% rule
- 1.39% ✓
- Cap rate
- 3.30%
- Cash-on-cash
- -10.68%
- DSCR
- 0.52
- GRM
- 6.0
CMA / ARV
No comps found within radius.
Projected returns pro-forma
-3.0% appreciation · 3.0% rent growth · sell at horizon
- IRR
- -34.9%
- Equity multiple
- -0.13×
- Total profit
- $-68,046
- Equity at exit
- $32,057
- IRR
- -41.3%
- Equity multiple
- -0.65×
- Total profit
- $-99,479
- Equity at exit
- $18,589
Cash invested: $60,200 (down + closing). Projections, not guarantees.
Landlord ↔ Tenant lean methodology
- Overall (CITY)
- 0 Strongly Tenant-Friendly
- State New York
- 15 Strongly Tenant-Friendly · D+10
- County
- — inherits STATE
- City New York
- 0 Strongly Tenant-Friendly · D+34
ZIP-level market 11367
- Active inventory
- 259
- Price-to-rent
- 6.0×
Monthly cashflow live
- Estimated rent
- $2,990 high interval (Pro) →
- Mortgage (P&I)
- −$1,127
- Tax est. 1.5%
- −$269 /mo · $3,225/yr
- Insurance
- −$90
- HOA est. from 1 same-building comp
- −$1,412
- Vacancy / Maint / Mgmt
- −$628
- Net cashflow
- $-536
Break-even live
UW: 25.0% down · 7.5% · 30yr · 1.5% tax · 5.0% vac · 8.0% maint · 8.0% mgmt
Financing live
Cash to close
- Down payment
- $53,750
- Closing costs
- $6,450
- Reserves months
- —
- Total cash needed
- —
Loan-product check · same deal, 3 products live
Conventional
25% down · 7.5% · 30yr
- Down + closing
- —
- Monthly P&I
- —
- Monthly cashflow
- —
- DSCR
- —
- Eligible?
- —
Personal DTI + credit; lowest rate.
DSCR
20% down · 8.5% · 30yr
- Down + closing
- —
- Monthly P&I
- —
- Monthly cashflow
- —
- DSCR
- —
- Eligible?
- —
No personal income docs; deal must DSCR.
Hard money
10% down · 12.0% · 12mo
- Down + closing
- —
- Monthly P&I
- —
- Monthly cashflow
- —
- DSCR
- —
- Eligible?
- —
Short-term bridge; refi at stabilization.
Rent comps 40 comps
| Address | Beds | Baths | Sqft | Rent | $/sqft | DOM | Units | Dist |
|---|---|---|---|---|---|---|---|---|
| 63-39 136th St Unit 2 Flushing, NY | 3.0 | 2.0 | 800 | $3,200 | $4.00 | 24d | 1 | 0.47mi |
| 150-25 72nd Rd Flushing, NY | 1.0 | 1.0 | 700 | $2,300 | $3.29 | 24d | 1 | 0.59mi |
| 15022 58th Ave Flushing, NY | 3.0 | 1.5 | 1224 | $3,300 | $2.70 | 15d | 1 | 0.61mi |
| 150-32 Booth Memorial Ave Unit 1st FL Flushing, NY | 3.0 | 2.0 | 1080 | $3,350 | $3.10 | 17d | 1 | 0.67mi |
| 142-23 Booth Memorial Ave Unit 1 Flushing, NY | 3.0 | 1.0 | 1064 | $3,200 | $3.01 | 5d | 1 | 0.75mi |
| 71-82 Parsons Blvd Unit 516 Kew Gardens Hills, NY | 2.0 | 1.5 | 900 | $3,500 | $3.89 | 3d | 1 | 0.78mi |
| 71-82 Parsons Blvd Unit 303 Kew Gardens Hills, NY | 2.0 | 1.5 | 900 | $4,000 | $4.44 | 14d | 1 | 0.78mi |
| 71-82 Parsons Blvd Unit 702 Kew Gardens Hills, NY | 1.0 | 1.0 | 1000 | $2,900 | $2.90 | 20d | 1 | 0.78mi |
| 71-82 Parsons Blvd Unit 503 Kew Gardens Hills, NY | 2.0 | 1.5 | 900 | $4,000 | $4.44 | 24d | 1 | 0.78mi |
| 7157 161 St Apt 5B Flushing, NY | 2.0 | 2.0 | 1100 | $2,600 | $2.36 | 24d | 1 | 0.90mi |
| 13225 58th Ave Flushing, NY | 3.0 | 3.0 | 1300 | $3,500 | $2.69 | 4d | 1 | 0.91mi |
| 7133 162nd St Unit 3F Fresh Meadows, NY | 2.0 | 2.0 | 850 | $2,700 | $3.18 | 24d | 1 | 0.93mi |
| 163-07 72nd Ave Unit 3G Flushing, NY | 2.0 | 2.0 | 716 | $2,900 | $4.05 | 24d | 1 | 1.00mi |
| 15325 77th Rd Flushing, NY | 3.0 | 1.0 | 1224 | $3,200 | $2.61 | 24d | 1 | 1.02mi |
| 144-41 78th Ave Unit 3 Flushing, NY | 3.0 | 2.0 | 750 | $3,300 | $4.40 | 4d | 1 | 1.04mi |
| 144-41 78th Ave Unit 3 Flushing, NY | 3.0 | 2.0 | 750 | $3,500 | $4.67 | 24d | 1 | 1.04mi |
| 165-23 65th Ave Unit 2 Flushing, NY | 3.0 | 1.5 | 1200 | $3,000 | $2.50 | 22d | 1 | 1.06mi |
| 135-26 78th Ave Unit 2FL Flushing, NY | 2.0 | 1.0 | 900 | $2,800 | $3.11 | 2d | 1 | 1.07mi |
| 7835 147th St Unit 2E Flushing, NY | 1.0 | 1.0 | 700 | $2,200 | $3.14 | 6d | 1 | 1.12mi |
| 7837 Main St Unit 2G Queens, NY | 1.0 | 1.0 | 700 | $2,300 | $3.29 | 24d | 1 | 1.13mi |
| 14112 78th Rd Unit 1G Flushing, NY | 1.0 | 1.0 | 700 | $2,200 | $3.14 | 24d | 1 | 1.14mi |
| 110-55 64th Rd Unit 25 Forest Hills, NY | 2.0 | 2.0 | 1300 | $3,400 | $2.62 | 7d | 1 | 1.20mi |
| 11105 66th Ave Unit 2B Forest Hills, NY | 1.0 | 1.0 | 850 | $2,600 | $3.06 | 15d | 1 | 1.21mi |
| 61-20 Grand Central Pkwy Unit A 106 Forest Hills, NY | 2.0 | 2.0 | 1300 | $3,100 | $2.38 | 19d | 1 | 1.23mi |
| 79-29 153rd St Unit 1st Floor Flushing, NY | 3.0 | 1.0 | 1200 | $3,000 | $2.50 | 24d | 1 | 1.23mi |
| 4255 Colden St Unit 16P Flushing, NY | 2.0 | 1.5 | 1150 | $3,500 | $3.04 | 3d | 1 | 1.28mi |
| 13226 Avery Ave Unit 8A Flushing, NY | 2.0 | 2.0 | 725 | $2,800 | $3.86 | 3d | 1 | 1.28mi |
| 133-38 Avery Ave Unit 3F-B Flushing, NY | 2.0 | 2.0 | 884 | $2,600 | $2.94 | 24d | 1 | 1.29mi |
| 61-20 Grand Central Pkwy Unit Bb706 Forest Hills, NY | 2.0 | 1.0 | 970 | $2,850 | $2.94 | 19d | 1 | 1.30mi |
| 13119 Fowler Ave Unit 7C Flushing, NY | 2.0 | 2.0 | 810 | $3,300 | $4.07 | 19d | 1 | 1.30mi |
| 8023 159th St Jamaica, NY | 3.0 | 1.5 | 1392 | $3,000 | $2.16 | 5d | 1 | 1.34mi |
| 11019 72nd Rd Unit 1B Forest Hills, NY | 1.0 | 1.0 | 750 | $3,200 | $4.27 | 14d | 1 | 1.34mi |
| 7731 166th St Fresh Meadows, NY | 3.0 | 1.0 | 1000 | $2,700 | $2.70 | 7d | 1 | 1.35mi |
| 13239 Pople Ave Unit 6D Flushing, NY | 1.0 | 1.0 | 750 | $2,500 | $3.33 | 4d | 1 | 1.36mi |
| 136-19 Franklin Ave Unit 4A Flushing, NY | 3.0 | 2.0 | 1300 | $4,300 | $3.31 | 19d | 1 | 1.37mi |
| 6945 108th St Unit 3F Forest Hills, NY | 2.0 | 1.0 | 900 | $3,600 | $4.00 | 6d | 1 | 1.37mi |
| 16525 Union Tpke Fresh Meadows, NY | 2.0 | 1.0 | 1000 | $2,900 | $2.90 | 24d | 1 | 1.38mi |
| 81-18 138th St Unit 3 Jamaica, NY | 3.0 | 2.0 | 1000 | $3,900 | $3.90 | 24d | 1 | 1.39mi |
| 10530 66th Ave Unit 3F Forest Hills, NY | 1.0 | 1.0 | 800 | $2,200 | $2.75 | 24d | 1 | 1.40mi |
| 80-12 165th St Unit 3 Jamaica, NY | 2.0 | 1.5 | 960 | $2,800 | $2.92 | 24d | 1 | 1.41mi |
HOA detail condo
- Monthly dues
- $0 · $0/yr
- Assessments
- None detected in remarks — confirm with the listing agent.
Listing history 25 events
-
2026-06-18days on market $215,000 Active 45 DOM
-
2026-06-17days on market $215,000 Active 44 DOM
-
2026-06-16days on market $215,000 Active 43 DOM
-
2026-06-15days on market $215,000 Active 42 DOM
-
2026-06-13days on market $215,000 Active 40 DOM
-
2026-06-10days on market $215,000 Active 36 DOM
-
2026-06-08days on market $215,000 Active 35 DOM
-
2026-06-08days on market $215,000 Active 34 DOM
-
2026-06-04days on market $215,000 Active 31 DOM
-
2026-06-03days on market $215,000 Active 30 DOM
-
2026-06-01days on market $215,000 Active 28 DOM
-
2026-05-31days on market $215,000 Active 27 DOM
-
2026-05-04$215,000 Active
-
2026-01-26historical
-
2025-11-17price $210,000
-
2025-07-30$220,000 Active
-
2025-07-25historical
-
2025-05-15historical
-
2025-04-04price $215,000
-
2025-02-04price $224,000
-
2024-11-14$245,000 Active
-
2024-10-31historical
-
2024-09-17price $259,000
-
2024-08-13price $279,000
-
2024-07-09$310,000 Active
ⓘ Source: listings_history table (triggers on properties + properties_extension) + one-shot
backfill from property_details.listing_events for pre-trigger history.
Climate risk First Street
- Flood 1/10 Low FEMA zone X (unshaded) · 0% chance over 30 yrs
- Wildfire 1/10 Low
- Heat 6/10 Major 7 d/yr ≥99°F today · 15 d/yr by 30 yrs out
- Wind 6/10 Major 27% chance of damaging wind over 30 yrs
- Air quality 4/10 Moderate 6 unhealthy d/yr today · 6 by 30 yrs out
Nearby sold comps map
Loading sold comps map…
Walkable amenities ~0.75 mi
Loading nearby amenities…
Taxation est. · year 1
- Rental income
- $35,880
- − Mortgage interest
- −$12,043
- − Property taxes
- −$3,225
- − Insurance
- −$1,075
- − Repairs & maintenance
- −$2,870
- − Management
- −$2,870
- − HOA
- −$16,944
- − Depreciation
- −$6,255
- Taxable loss
- −$9,403
- Est. tax savings @ 24.0%
- +$2,257
- After-tax cash flow
- $-4,172/yr
For passive investors: Depreciation is non-cash, so a rental often shows a tax loss while cash-flowing — sheltering income. Rental losses are passive: they offset passive income freely, and up to $25,000/yr can offset ordinary (W-2) income if you actively participate and your MAGI is under $100k (phasing out to $0 by $150k); unused losses carry forward. On sale, claimed depreciation is recaptured at up to 25%, and gains may owe capital-gains tax (a 1031 exchange can defer both). Figures are a year-1 estimate at your 24.0% rate — not tax advice; consult a CPA.
Condition & rehab AI · 12 photos
The home requires moderate renovations to update the kitchen and bathroom, which would significantly increase its resale value.
Repairs flagged
- Moderate kitchen cabinets — dated and in need of replacement
- Moderate kitchen countertops — dated and in need of replacement
- Moderate kitchen appliances — dated and in need of replacement
- Moderate bathroom fixtures — dated and in need of replacement
- Moderate bathroom tile — dated and in need of replacement
Value-add opportunities
- Resale paint interior walls — fresh paint can make a significant difference in the home's appearance
- Resale replace carpeted floors — new flooring can improve the home's overall appearance and value
- Resale replace kitchen cabinets, countertops, and appliances — new kitchen can significantly increase the home's value
- Resale replace bathroom fixtures and tile — new bathroom can significantly increase the home's value
Renovation cost estimate screening
| Repair item | Severity | Est. cost |
|---|---|---|
| kitchen cabinets · dated and in need of replacement | Moderate | $3,000–15,000 |
| kitchen countertops · dated and in need of replacement | Moderate | $3,000–15,000 |
| kitchen appliances · dated and in need of replacement | Moderate | $3,000–15,000 |
| bathroom fixtures · dated and in need of replacement | Moderate | $3,000–15,000 |
| bathroom tile · dated and in need of replacement | Moderate | $3,000–15,000 |
| Total estimated repair cost · 5 items | $15,000–75,000 |
Value-add ROI direction
- Resale paint interior walls — fresh paint can make a significant difference in the home's appearance ↑
- Resale replace carpeted floors — new flooring can improve the home's overall appearance and value ↑
- Resale replace kitchen cabinets, countertops, and appliances — new kitchen can significantly increase the home's value ↑
- Resale replace bathroom fixtures and tile — new bathroom can significantly increase the home's value ↑
ⓘ Cost ranges are severity-bucket heuristics (US national rule-of-thumb). Get contractor quotes + a written scope before underwriting a rehab budget.
Schools (NCES district)
No district data.
Livability — New York
- Score
- 75/100
- State rank
- #268
- US rank
- #4188
Category grades
Schools grade is shown separately in the Schools card above.
Census & demographics
- Census place
- New York, NY
- County
- Queens County · 1,914,869 people
- City population
- 7,731,280
- Metro
- New York-Newark-Jersey City, NY-NJ-PA
- Population (ZIP)
- 40,923
- Household income
- $75,061
- Rent vs Own
- Severe rent burden
- 2010.0
Population outlook (Queens County) Hauer SSP2
- Today (2025)
- 2,546,320 people
- By 2030
- 2,643,059 · +3.8%
- By 2040
- 2,815,563 · +10.6%
- By 2050
- 2,944,423 · +15.6%
- By 2075
- 3,123,338 · +22.7%
- By 2100
- 3,098,688 · +21.7%
Race, ethnicity, and origin ACS 2023
- Neighborhood character
- Highly diverse neighborhood (Simpson 0.72)
- Race & ethnicity
- White 42% Asian 25% Hispanic / Latino 19% Black 7% Two or more races 7%
- Hispanic origin (detail)
- Puerto Rican 3% Dominican 6%
- Common ancestry
- Scotch-Irish 5% Romanian 3% Hispanic 1%
- Foreign-born
- 41% · China, Canada, Jamaica
- Languages at home
- 41% English-only · Chinese 16% Spanish 15% Russian/Polish/Slavic 9%
Political lean MEDSL · Queens
- 2024 margin
- Strong D (+24.6) · D 62.3% · R 37.7%
- 2008→2024 swing
- -26.2pp toward R · 2008: 50.8pp · 2024: 24.6pp
- All cycles
- 2024: D+24.6 2020: D+45.2 2016: D+53.4 2012: D+58.5 2008: D+50.8
Not yet ingested
- Civics
- —
Market trends
- HPI YoY
- ▼ -211.36%
- Current HPI
- 220.6177
- Rent YoY
- —
- Metro
- New York-Newark-Jersey City, NY-NJ-PA
- State GDP YoY
- ▲ 2.60%
- F500 in state
- 92
Industry mix (Fortune 500 HQ in NY)
| Industry | F500 HQs | Revenue |
|---|---|---|
| Financial Services | 10 | $950B |
|
||
| Consumer Goods | 9 | $162B |
|
||
| Insurance | 4 | $225B |
|
||
| Telecommunications | 2 | $144B |
|
||
| Pharmaceuticals | 2 | $112B |
|
||
| Media / Entertainment | 2 | $69B |
|
||
Price history
-30.6% since first listed13 events — show timeline
- 2026-05-04 Listed $215,000 OneKey® MLS as Distributed by MLS Grid
- 2026-01-26 Listing Removed — OneKey® MLS as Distributed by MLS Grid
- 2025-11-17 Price Changed $210,000 OneKey® MLS as Distributed by MLS Grid
- 2025-07-30 Listed $220,000 OneKey® MLS as Distributed by MLS Grid
- 2025-07-25 Coming Soon — OneKey® MLS as Distributed by MLS Grid
- 2025-05-15 Listing Removed — OneKey® MLS as Distributed by MLS Grid
- 2025-04-04 Price Changed $215,000 OneKey® MLS as Distributed by MLS Grid
- 2025-02-04 Price Changed $224,000 OneKey® MLS as Distributed by MLS Grid
- 2024-11-14 Listed $245,000 OneKey® MLS as Distributed by MLS Grid
- 2024-10-31 Listing Removed — OneKey® MLS as Distributed by MLS Grid
- 2024-09-17 Price Changed $259,000 OneKey® MLS as Distributed by MLS Grid
- 2024-08-13 Price Changed $279,000 OneKey® MLS as Distributed by MLS Grid
- 2024-07-09 Listed $310,000 OneKey® MLS as Distributed by MLS Grid
Cash-flow waterfall
monthlySold comps — $/sqft
last 12 mo · ≤1 miLoading sold comps…