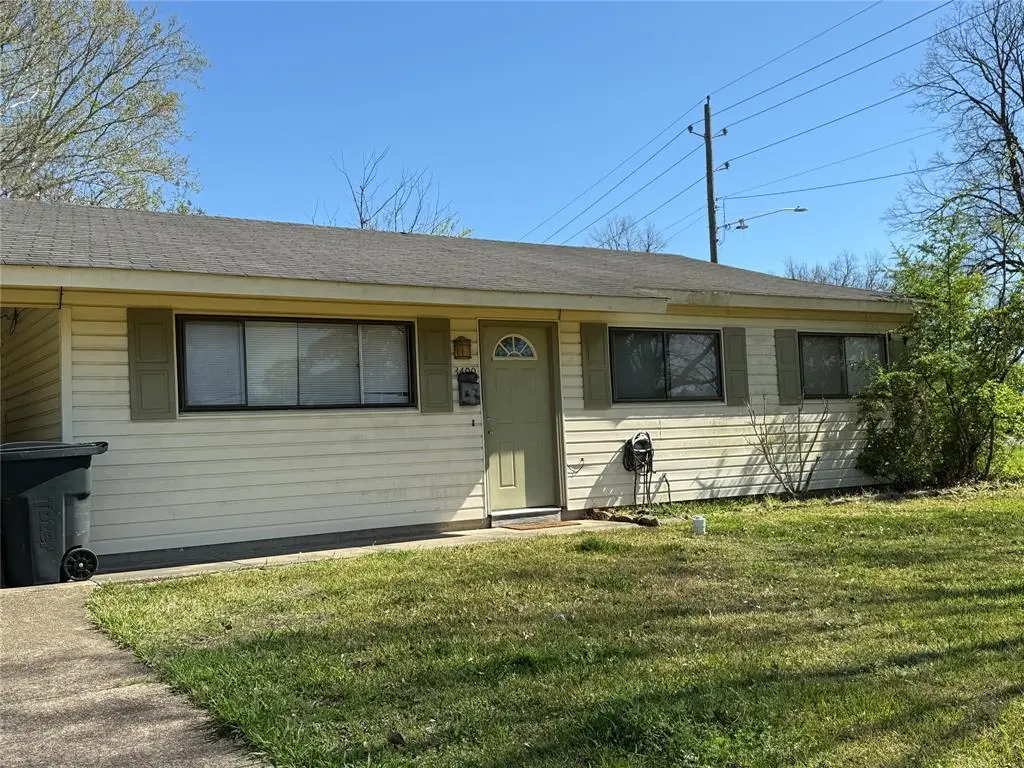
3400 Black Lake Cir · Bossier City, LA
Flood risk 2/10 · Minimal
- FEMA flood zone
- X (unshaded)
- Chance of flooding over 30 yrs
- 0.09%
- Est. flood insurance / yr
- $507 – $1,088
Fire risk 1/10 · Minimal
- Est. fire insurance / yr
- $1,269 – $2,357
Heat risk 7/10 · Major
- Hot days now (above 111°F)
- 7 days/yr
- Hot days in 30 yrs
- 22 days/yr
Wind risk 6/10 · Moderate
- Chance of severe wind over 30 yrs
- 72.0%
Air-quality risk 2/10 · Minimal
- Unhealthy air days now
- 1 days/yr
- Unhealthy air days in 30 yrs
- 2 days/yr
Risk factors via First Street. Map © Google.
Why this score? — see what drove the C- grade
The composite is a weighted blend of 9 inputs, each scored 0–100. Each bar is that input's sub-score; the figure is the points it added to the 100-point composite (weight × sub-score).
- Cash flow +20.1/30.0
- ARV discount +7.3/15.0
- DSCR +6.4/10.0
- 1% rule +5.3/10.0
- Schools +3.8/10.0
- Livability +3.6/5.0
- Rent growth +3.4/5.0
- Condition / age +2.5/5.0
- Appreciation +0.0/10.0
$134,900
🖨 Deal sheet (PDF) 📄 Offer letter ✓ Due diligence
Listing remarks MLS
Check out this 3-bedroom 1-bath home on a corner lot! Located near Barksdale Air Force Base. Conveniently located to I-20 and I-49 and everything Shreveport-Bossier has to offer. Large backyard with dog run. Fence needs repair. Roof less than 10 years old. Exterior AC unit replaced 2014 with accommodating upgraded elect box. Gas stove and oven. Luxury Vinyl Plank flooring less than a year old. Must see to appreciate. 2 hour notice required.
Key facts
- Ac updated
- Large backyard
- Dog run
Tags
Neighborhood map
What this means for you Summary
Snapshot
- This is a 3-bed/1.0-bath single-family listed at $135k.
Deal economics
- At list price, monthly cash flow is $168 ($2k/yr) — positive.
- The deal already cash-flows at list — no discount required.
- Meets the 1% rule at list price ($1k rent vs $135k).
- Recommended offer: $127k (6.0% below list) — sets the bar for market timing.
- Cap rate 7.8% vs local median 4.7% in Bossier City — top-decile yield for the area; either an underpriced asset or a hidden risk that comps aren't pricing in. Stress-test before assuming the spread holds.
Location & tenants
- Location reads 71/100 on livability (#47 in LA) — a middle-class / working-renter tenant base. Strengths: commute A+, cost of living A+, housing A+; Watch: employment D+, crime F, amenities F.
- Bossier Parish (urban): math 40% / reading 47% proficiency, ranked #17 of 98 in LA (top 17%) — families likely to look elsewhere, expect single-tenant / working-renter base with shorter leases.
- Market conditions: Rents rising (+3.6%/yr); 148 active listings in the ZIP; 19 comparable units currently listed for rent nearby; rentals at typical pace (median 22d on market — plan ~3-4 weeks tenant-placement turnaround); 716 units permitted in Bossier Parish in 2024 (0 in 5+ unit buildings).
Forward outlook
- Local home prices are declining (-3.0%/yr); year-one equity from $933 of loan paydown is wiped out by about $4k of value loss. Plan a longer hold.
- Bossier County population projected at +28% by 2050 — long-run rental-demand tailwind backs the buy-and-hold thesis.
Negotiation context
- It's been on market 84 days — a 6% lower offer ($127k) is reasonable based on typical stale-listing flexibility.
- 2 sale attempts with the ask held roughly flat each time — persistent listings suggest the price (not the market) is what's stuck; bring a comps-based counter.
- Current owner paid $100k; 35% above their basis — modest negotiation headroom, anchor on the comps not their cost.
Risks & watch-outs
- Climate carrying-cost: major wind risk, 72% chance of damaging wind over 30y; extreme-heat days projected 7→22/yr by 2055 (HVAC capex compounding) — expect insurance premiums to compound above CPI over the hold.
Questions for the listing agent
- It's been on market 84 days. Have you received any prior offers? Is the seller open to a 6% concession, seller financing, or rate buy-down credit?
- Built in 1967 — when were the roof, HVAC, electrical panel, plumbing, and water heater last replaced?
- Why hasn't it sold? Are there any deal-killer items the seller is aware of (foundation, flood, title, zoning, code violations)?
- Is there a deadline driving the sale (1031 exchange, divorce, estate, relocation)? That informs how much negotiation room exists.
- Schools are B-rated — typically a magnet for longer-tenancy family renters. What's the average tenant stay here, and is there a school-zone premium baked into asking?
- Crime grade is F in this area — have there been break-ins, vandalism, or insurance claims at this property in the last 3 years? What carrier currently insures it and at what premium?
- What's the average days-on-market for RENTAL listings here right now (not sales)? A rising rental-DOM trend means longer vacancies and softer asking-rent achievability than the comps imply.
- What's the recent tenant-quality profile in this submarket — average credit score on applications, eviction rate, late-payment / NSF rate, and stable-employment percentage? A property-management company in the area should have these aggregated.
- How much new for-sale + rental construction is in the pipeline within 1–3 miles? Heavy new supply typically softens prices + rents 12–24 months out; constrained supply supports both.
Investment metrics
- 1% rule
- 1.03% ✓
- Cap rate
- 7.79%
- Cash-on-cash
- 5.34%
- DSCR
- 1.24
- GRM
- 8.1
CMA / ARV
- ARV (median comp)
- $134,363
- List price
- $134,900
- Delta
- 0.40%
- Verdict
- FAIR
- Comps
- 20 within 1.0 mi
Show comp detail 12 sales within ~0.75 mi
| Address | Dist | Beds/Ba | Sqft | Sold | Price | $/sf | Match |
|---|---|---|---|---|---|---|---|
| 3422 Horseshoe Trl | 0.26mi | 3/1.0 | 1,008 (0%) | 15mo | $144,900 | $144 | 76 |
| 1702 Northgate Rd | 0.11mi | 2/1.0 (-1) | 984 (-2%) | 18mo | $81,268 | $83 | 70 |
| 1333 Michael St | 0.52mi | 3/1.0 | 1,010 (+0%) | 6mo | $115,000 | $114 | 70 |
| 3424 Horseshoe Trl | 0.26mi | 3/1.0 | 1,008 (0%) | 22mo | $129,900 | $129 | 70 |
| 3110 June Ln | 0.20mi | 3/1.0 | 1,074 (+6%) | 19mo | $139,500 | $130 | 64 |
| 3001 Oliver St | 0.32mi | 3/1.0 | 1,094 (+8%) | 10mo | $125,000 | $114 | 63 |
| 3314 Raleigh Pl | 0.45mi | 2/2.0 (-1) | 960 (-5%) | 2mo | $140,000 | $146 | 60 |
| 3204 Jana Pl | 0.54mi | 3/1.0 | 1,028 (+2%) | 19mo | $84,900 | $83 | 56 |
| 300 Waller Ave | 0.70mi | 3/1.0 | 1,000 (-1%) | 14mo | $126,900 | $127 | 54 |
| 1245 Dudley Ln | 0.69mi | 3/1.0 | 1,096 (+9%) | 8mo | $89,900 | $82 | 46 |
| 3259 Sarah St | 0.56mi | 3/1.5 | 1,130 (+12%) | 11mo | $154,500 | $137 | 43 |
| 3306 Raleigh Pl | 0.43mi | 3/2.0 | 1,159 (+15%) | 13mo | $167,000 | $144 | 40 |
Match score weights: distance 35% · size 25% · config 20% · recency 20%. Top-matched comps best support the ARV.
Projected returns pro-forma
-3.0% appreciation · 3.6% rent growth · sell at horizon
- IRR
- -7.3%
- Equity multiple
- 0.73×
- Total profit
- $-10,283
- Equity at exit
- $20,114
- IRR
- 3.0%
- Equity multiple
- 1.22×
- Total profit
- $8,436
- Equity at exit
- $11,664
Cash invested: $37,772 (down + closing). Projections, not guarantees.
Landlord ↔ Tenant lean methodology
- Overall (STATE)
- 90 Strongly Landlord-Friendly
- State Louisiana
- 90 Strongly Landlord-Friendly · R+12
- County
- — inherits STATE
- City
- — inherits STATE
ZIP-level market 71112
- Rents YoY
- 3.6%
- Active inventory
- 148
- Price-to-rent
- 8.1×
Monthly cashflow live
- Estimated rent
- $1,393 high interval (Pro) →
- Mortgage (P&I)
- −$707
- Tax est. 1.5%
- −$169 /mo · $2,024/yr
- Insurance
- −$56
- HOA
- −$0
- Vacancy / Maint / Mgmt
- −$293
- Net cashflow
- $168
Break-even live
Sensitivity live
| Price | -10% $261 | -5% $215 | +0% $168 | +5% $122 | +10% $75 |
|---|---|---|---|---|---|
| Rent | -10% $58 | -5% $113 | +0% $168 | +5% $223 | +10% $278 |
| Rate | -1.0pp $236 | -0.5pp $202 | base $168 | +0.5pp $133 | +1.0pp $98 |
UW: 25.0% down · 7.5% · 30yr · 1.5% tax · 5.0% vac · 8.0% maint · 8.0% mgmt
Financing live
Cash to close
- Down payment
- $33,725
- Closing costs
- $4,047
- Reserves months
- —
- Total cash needed
- —
Loan-product check · same deal, 3 products live
Conventional
25% down · 7.5% · 30yr
- Down + closing
- —
- Monthly P&I
- —
- Monthly cashflow
- —
- DSCR
- —
- Eligible?
- —
Personal DTI + credit; lowest rate.
DSCR
20% down · 8.5% · 30yr
- Down + closing
- —
- Monthly P&I
- —
- Monthly cashflow
- —
- DSCR
- —
- Eligible?
- —
No personal income docs; deal must DSCR.
Hard money
10% down · 12.0% · 12mo
- Down + closing
- —
- Monthly P&I
- —
- Monthly cashflow
- —
- DSCR
- —
- Eligible?
- —
Short-term bridge; refi at stabilization.
Rent comps 19 comps
| Address | Beds | Baths | Sqft | Rent | $/sqft | DOM | Units | Dist |
|---|---|---|---|---|---|---|---|---|
| 3406 Black Lake Cir Bossier City, LA | 3.0 | 1.0 | 1400 | $1,200 | $0.86 | 22d | 1 | 0.06mi |
| 3115 Oliver St Bossier City, LA | 3.0 | 1.5 | 1067 | $1,400 | $1.31 | 14d | 1 | 0.19mi |
| 1301 Williamsburg Dr Bossier City, LA | 1.0–3.0 | 1.0–2.0 | 1025 | $1,655 | $1.61 | 14d | 28 | 0.36mi |
| 1302 Williamsburg Dr Bossier City, LA | 1.0–3.0 | 1.0–2.0 | 1050 | $1,720 | $1.64 | 22d | 14 | 0.40mi |
| 1416 Williamsburg Dr Bossier City, LA | 2.0 | 2.0 | 960 | $1,200 | $1.25 | 14d | 1 | 0.41mi |
| 3202 Jana Pl Bossier City, LA | 3.0 | 1.0 | 1258 | $1,250 | $0.99 | 45d | 1 | 0.52mi |
| 4056 Beech St Bossier City, LA | 4.0 | 1.0 | 1391 | $1,400 | $1.01 | 22d | 1 | 0.55mi |
| 3204 McGregor St Bossier City, LA | 3.0 | 1.0 | 1093 | $1,350 | $1.24 | 45d | 1 | 0.65mi |
| 1231 Waller Ave Bossier City, LA | 3.0 | 1.0 | 1500 | $1,100 | $0.73 | 45d | 1 | 0.79mi |
| 1140 Schex Dr Bossier City, LA | 3.0 | 1.0 | 1346 | $1,500 | $1.11 | 22d | 1 | 0.83mi |
| 1148 Dudley Ln Bossier City, LA | 3.0 | 1.0 | 1013 | $925 | $0.91 | 14d | 1 | 0.87mi |
| 1120 Margaret St Bossier City, LA | 2.0 | 1.0 | 950 | $1,200 | $1.26 | 22d | 1 | 0.97mi |
| 400 John Wesley Blvd Bossier City, LA | 2.0 | 1.5 | 935 | $842 | $0.90 | 14d | 2 | 0.97mi |
| 3325 E Texas St Bossier City, LA | 1.0–2.0 | 1.0–2.0 | 810 | $950 | $1.17 | 22d | 1 | 1.01mi |
| 2248 Loreco St Bossier City, LA | 3.0 | 2.0 | 1073 | $1,400 | $1.30 | 45d | 1 | 1.06mi |
| 205 Royal St Bossier City, LA | 2.0 | 1.5 | 1100 | $1,100 | $1.00 | 45d | 1 | 1.13mi |
| 305 Orleans St Bossier City, LA | 2.0 | 1.5 | 1021 | $1,000 | $0.98 | 22d | 1 | 1.16mi |
| 3200 Cottonwood St Bossier City, LA | 4.0 | 2.0 | 1116 | $1,075 | $0.96 | 22d | 1 | 1.44mi |
| 2201 Naples St Bossier City, LA | 2.0 | 1.0 | 759 | $775 | $1.02 | 45d | 1 | 1.45mi |
Listing history 23 events
-
2026-06-21days on market $134,900 Active 84 DOM
-
2026-06-18days on market $134,900 Active 81 DOM
-
2026-06-17days on market $134,900 Active 80 DOM
-
2026-06-16days on market $134,900 Active 79 DOM
-
2026-06-15days on market $134,900 Active 78 DOM
-
2026-06-14days on market $134,900 Active 76 DOM
-
2026-06-13days on market $134,900 Active 75 DOM
-
2026-06-10days on market $134,900 Active 73 DOM
-
2026-06-09days on market $134,900 Active 72 DOM
-
2026-06-08days on market $134,900 Active 71 DOM
-
2026-06-07days on market $134,900 Active 70 DOM
-
2026-06-02days on market $134,900 Active 65 DOM
-
2026-06-01days on market $134,900 Active 64 DOM
-
2026-05-31days on market $134,900 Active 63 DOM
-
2026-05-30days on market $134,900 Active 62 DOM
-
2026-04-27price $134,900 447-char remark
Show marketing remark (447 chars)
Check out this 3-bedroom 1-bath home on a corner lot! Located near Barksdale Air Force Base. Conveniently located to I-20 and I-49 and everything Shreveport-Bossier has to offer. Large backyard with dog run. Fence needs repair. Roof less than 10 years old. Exterior AC unit replaced 2014 with accommodating upgraded elect box. Gas stove and oven. Luxury Vinyl Plank flooring less than a year old. Must see to appreciate. 2 hour notice required.
-
2026-04-10status Active 447-char remark
Show marketing remark (447 chars)
Check out this 3-bedroom 1-bath home on a corner lot! Located near Barksdale Air Force Base. Conveniently located to I-20 and I-49 and everything Shreveport-Bossier has to offer. Large backyard with dog run. Fence needs repair. Roof less than 10 years old. Exterior AC unit replaced 2014 with accommodating upgraded elect box. Gas stove and oven. Luxury Vinyl Plank flooring less than a year old. Must see to appreciate. 2 hour notice required.
-
2026-03-18price $139,900 447-char remark
Show marketing remark (447 chars)
Check out this 3-bedroom 1-bath home on a corner lot! Located near Barksdale Air Force Base. Conveniently located to I-20 and I-49 and everything Shreveport-Bossier has to offer. Large backyard with dog run. Fence needs repair. Roof less than 10 years old. Exterior AC unit replaced 2014 with accommodating upgraded elect box. Gas stove and oven. Luxury Vinyl Plank flooring less than a year old. Must see to appreciate. 2 hour notice required.
-
2026-03-10$134,900 Active 447-char remark
Show marketing remark (447 chars)
Check out this 3-bedroom 1-bath home on a corner lot! Located near Barksdale Air Force Base. Conveniently located to I-20 and I-49 and everything Shreveport-Bossier has to offer. Large backyard with dog run. Fence needs repair. Roof less than 10 years old. Exterior AC unit replaced 2014 with accommodating upgraded elect box. Gas stove and oven. Luxury Vinyl Plank flooring less than a year old. Must see to appreciate. 2 hour notice required.
-
2013-09-04soldstatus $100,000
-
2011-12-08soldstatus
-
2002-08-13soldstatus $59,900
-
1995-05-16soldstatus $38,000
ⓘ Source: listings_history table (triggers on properties + properties_extension) + one-shot
backfill from property_details.listing_events for pre-trigger history.
Climate risk First Street
- Flood 2/10 Low FEMA zone X (unshaded) · 9% chance over 30 yrs
- Wildfire 1/10 Low
- Heat 7/10 Severe 7 d/yr ≥111°F today · 22 d/yr by 30 yrs out
- Wind 6/10 Major 72% chance of damaging wind over 30 yrs
- Air quality 2/10 Low 1 unhealthy d/yr today · 2 by 30 yrs out
Nearby sold comps map
Loading sold comps map…
Walkable amenities ~0.75 mi
Loading nearby amenities…
Taxation est. · year 1
- Rental income
- $16,715
- − Mortgage interest
- −$7,556
- − Property taxes
- −$2,024
- − Insurance
- −$674
- − Repairs & maintenance
- −$1,337
- − Management
- −$1,337
- − Depreciation
- −$3,924
- Taxable loss
- −$138
- Est. tax savings @ 24.0%
- +$33
- After-tax cash flow
- $2,051/yr
For passive investors: Depreciation is non-cash, so a rental often shows a tax loss while cash-flowing — sheltering income. Rental losses are passive: they offset passive income freely, and up to $25,000/yr can offset ordinary (W-2) income if you actively participate and your MAGI is under $100k (phasing out to $0 by $150k); unused losses carry forward. On sale, claimed depreciation is recaptured at up to 25%, and gains may owe capital-gains tax (a 1031 exchange can defer both). Figures are a year-1 estimate at your 24.0% rate — not tax advice; consult a CPA.
Schools (NCES district)
- District
- Bossier Parish
- NCES district ID
- 2200270
- Math proficiency
- 40% ▼ -32.00%
- Reading proficiency
- 47% ▼ -28.00%
- Median HH income
- $51,326
- Composite
- 37.5/100
- National rank
- #4402
- State rank
- #17 of 98 in LA
Livability — Bossier City
- Score
- 71/100
- State rank
- #47
- US rank
- #7044
Category grades
Schools grade is shown separately in the Schools card above.
Census & demographics
- Census place
- Bossier City, LA
- County
- Bossier Parish · 98,704 people
- City population
- 91,925
- Metro
- Shreveport-Bossier City, LA
- Population (ZIP)
- 33,587
- Household income
- $61,760
- Rent vs Own
- Severe rent burden
- 1391.0
Population outlook (Bossier County) Hauer SSP2
- Today (2025)
- 143,247 people
- By 2030
- 151,802 · +6.0%
- By 2040
- 168,194 · +17.4%
- By 2050
- 183,533 · +28.1%
- By 2075
- 217,009 · +51.5%
- By 2100
- 230,091 · +60.6%
Race, ethnicity, and origin ACS 2023
- Neighborhood character
- Diverse neighborhood (Simpson 0.57)
- Race & ethnicity
- White 59% Black 24% Hispanic / Latino 12% Two or more races 8% Asian 2%
- Hispanic origin (detail)
- Mexican 9%
- Common ancestry
- Lithuanian 2% Slovak 1% Scottish 1%
- Foreign-born
- 5% · Canada, Vietnam
- Languages at home
- 89% English-only · Spanish 7% Other Indo-European 1% Tagalog/Filipino 1%
Political lean MEDSL · Bossier
- 2024 margin
- Solid R (+43.3) · D 27.7% · R 71.0% · Other 1.3%
- 2008→2024 swing
- +0.3pp no change · 2008: -43.7pp · 2024: -43.3pp
- All cycles
- 2024: R+43.3 2020: R+41.0 2016: R+45.8 2012: R+45.4 2008: R+43.7
Not yet ingested
- Civics
- —
Market trends
- HPI YoY
- ▼ -77.48%
- Current HPI
- 127.9821
- Rent YoY
- ▲ 3.60%
- Metro
- Shreveport-Bossier City, LA
- State GDP YoY
- ▲ 3.29%
- F500 in state
- 10
Industry mix (Fortune 500 HQ in LA)
| Industry | F500 HQs | Revenue |
|---|---|---|
| Telecommunications | 2 | $23B |
|
||
| Utilities | 1 | $12B |
|
||
| Wholesale / Distribution | 1 | $5B |
|
||
| Advertising | 1 | $2B |
|
||
Price history
+255.0% since first listed8 events — show timeline
- 2026-04-27 Price Changed $134,900 NTREIS
- 2026-04-10 Relisted — NTREIS
- 2026-03-18 Price Changed $139,900 NTREIS
- 2026-03-10 Listed $134,900 NTREIS
- 2013-09-04 Sold (Public Records) $100,000 Public Records
- 2011-12-08 Sold (Public Records) — Public Records
- 2002-08-13 Sold (Public Records) $59,900 Public Records
- 1995-05-16 Sold (Public Records) $38,000 Public Records
Property tax history
-16.4%/yrLatest (2025): $153 · -1.3% YoY. Source: county tax records.
Cash-flow waterfall
monthlySold comps — $/sqft
last 12 mo · ≤1 miLoading sold comps…