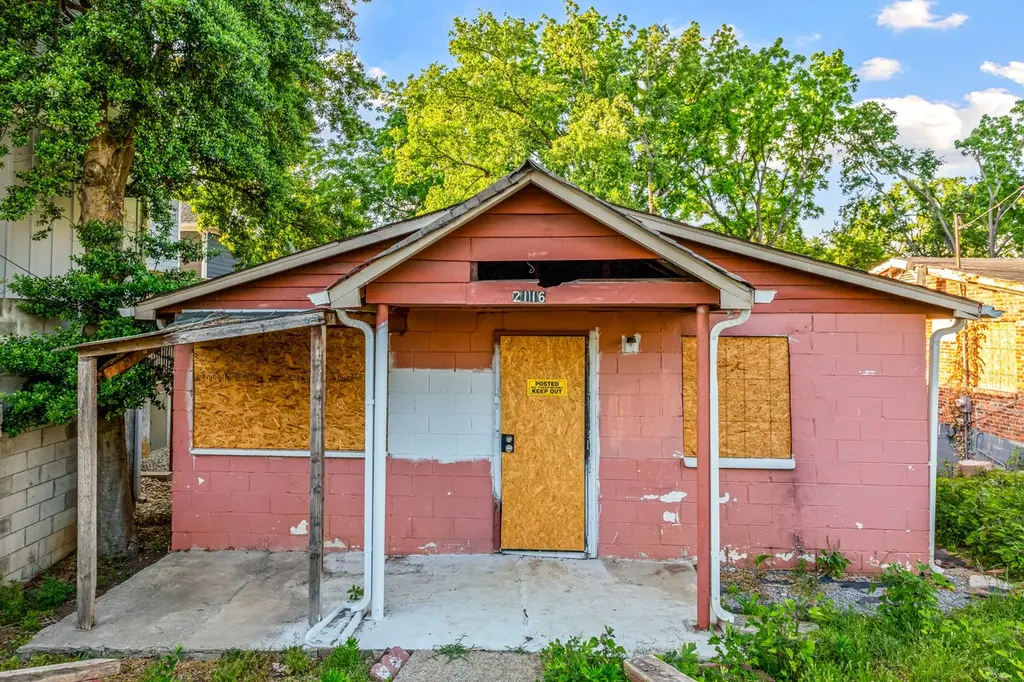
2116 Herman St · Nashville-Davidson metropolitan government (balance), TN
Flood risk 1/10 · Minimal
- FEMA flood zone
- X (unshaded)
- Chance of flooding over 30 yrs
- 0.0%
- Est. flood insurance / yr
- $473 – $860
Fire risk 1/10 · Minimal
- Est. fire insurance / yr
- $949 – $1,763
Heat risk 6/10 · Moderate
- Hot days now (above 106°F)
- 7 days/yr
- Hot days in 30 yrs
- 20 days/yr
Wind risk 4/10 · Minor
- Chance of severe wind over 30 yrs
- 10.0%
Air-quality risk 2/10 · Minimal
- Unhealthy air days now
- 1 days/yr
- Unhealthy air days in 30 yrs
- 2 days/yr
Risk factors via First Street. Map © Google.
Why this score? — see what drove the C grade
The composite is a weighted blend of 9 inputs, each scored 0–100. Each bar is that input's sub-score; the figure is the points it added to the 100-point composite (weight × sub-score).
- Cash flow +21.7/30.0
- ARV discount +15.0/15.0
- DSCR +6.9/10.0
- 1% rule +5.3/10.0
- Rent growth +3.0/5.0
- Livability +2.5/5.0
- Condition / age +2.5/5.0
- Schools +1.4/10.0
- Appreciation +0.0/10.0
$189,900
🖨 Deal sheet (PDF) 📄 Offer letter ✓ Due diligence
Listing remarks MLS
Excellent Rehab Opportunity . Awesome view of downtown Nashville from the front porch! This cinder block structure has renovation potential! Walk-Out Basement. House is surrounded by new high-end luxury homes and condos. Walk or cycle to downtown. WeGo Public Transit passes in front of the house, 2 min drive ti I-40, I-440, I-65 & Briley Pkwy, 2 min walk to Nashville General Hospital/Meharry Medical College, 7 minute drive to Vanderbilt campus. SOLD AS IS. Please confirm square feet for yourself.
Key facts
- Cinder block home
- Walk-out basement
- Walkable access
Tags
Property features AI
Finance
- Other: Lot roughly 0.14 acres (approx. 41 x 157); Living area about 1,064 square feet; Year listed as existing; one level
Exterior
- Parking: No covered spaces reported; No total parking spaces reported
- Utilities: Public water; Public sewer; Water available
- Home design: Single-family residence; One story
- Construction: Frame construction; Other construction material
- Exterior features: Covered patio
Interior
- Kitchen: Kitchen approximately 12 x 8
- Bedrooms: 2 bedrooms (both on main level); Bedroom sizes approximately 15 x 10 and 12 x 9
- Flooring: Concrete flooring; Vinyl flooring
- Bathrooms: 2 full bathrooms
- Heating & cooling: Heating present (type: Other); Cooling present (type: Other)
- Interior features: Partial basement; No built-in appliances listed
Neighborhood map
What this means for you Summary
Snapshot
- This is a 2-bed/2.0-bath single-family listed at $190k.
Deal economics
- At list price, monthly cash flow is $290 ($3k/yr) — positive.
- The deal already cash-flows at list — no discount required.
- Meets the 1% rule at list price ($2k rent vs $190k).
- Recommended offer: $184k (3.0% below list) — sets the bar for market timing.
- Cap rate 8.1% vs local median 2.9% in Nashville-Davidson metropolitan government (balance) — top-decile yield for the area; either an underpriced asset or a hidden risk that comps aren't pricing in. Stress-test before assuming the spread holds.
Location & tenants
- Location reads: area grade C — affects rentability + tenant quality, not the cash-flow math above.
- Davidson County (urban): math 12% / reading 19% proficiency, ranked #126 of 139 in TN (top 91%) — low school quality limits family demand, transient renter base, plan for 1-2y turnover; 66% free/reduced lunch — lower-income household profile, screen leases tightly.
- Zoned schools: Park Avenue Elementary (math 2% / reading 12%, grade F, #863 of 952 statewide, top 92%, 349 students, 0% FRL); Haynes Middle (math 0% / reading 3%, grade F, #332 of 333 statewide, top 100%, 291 students, 0% FRL); Pearl-Cohn High (math 2% / reading 12%, grade F, #294 of 332 statewide, top 91%, 604 students, 0% FRL) — zoned schools average 0% FRL vs 66% district-wide (66 pts lower); this property's tenant base skews higher-income than the district average.
- Market conditions: Rents rising (+2.1%/yr); 351 active listings in the ZIP; 40 comparable units currently listed for rent nearby; rentals at typical pace (median 19d on market — plan ~3-4 weeks tenant-placement turnaround); 6,873 units permitted in Davidson County in 2024 (4,138 in 5+ unit buildings).
- This rent runs 36% of the median local income ($66k/yr) — at the standard rent-burdened threshold; future hikes will face affordability resistance.
Forward outlook
- Local home prices are declining (-3.0%/yr); year-one equity from $1k of loan paydown is wiped out by about $6k of value loss. Plan a longer hold.
- Davidson County population projected at +42% by 2050 — long-run rental-demand tailwind backs the buy-and-hold thesis.
Negotiation context
- It's been on market 45 days — a 3% lower offer ($184k) is reasonable based on typical stale-listing flexibility.
- 7 sale attempts since 5y ago with the ask held roughly flat each time — persistent listings suggest the price (not the market) is what's stuck; bring a comps-based counter.
Risks & watch-outs
- Watch-outs: built in 1950 — expect roof / HVAC / electrical / plumbing capex.
- Climate carrying-cost: extreme-heat days projected 7→20/yr by 2055 (HVAC capex compounding) — expect insurance premiums to compound above CPI over the hold.
Questions for the listing agent
- It's been on market 45 days. Have you received any prior offers? Is the seller open to a 3% concession, seller financing, or rate buy-down credit?
- Built in 1950 — when were the roof, HVAC, electrical panel, plumbing, and water heater last replaced?
- Is there a deadline driving the sale (1031 exchange, divorce, estate, relocation)? That informs how much negotiation room exists.
- What's the average days-on-market for RENTAL listings here right now (not sales)? A rising rental-DOM trend means longer vacancies and softer asking-rent achievability than the comps imply.
- What's the recent tenant-quality profile in this submarket — average credit score on applications, eviction rate, late-payment / NSF rate, and stable-employment percentage? A property-management company in the area should have these aggregated.
- How much new for-sale + rental construction is in the pipeline within 1–3 miles? Heavy new supply typically softens prices + rents 12–24 months out; constrained supply supports both.
Investment metrics
- 1% rule
- 1.03% ✓
- Cap rate
- 8.13%
- Cash-on-cash
- 6.55%
- DSCR
- 1.29
- GRM
- 8.1
CMA / ARV
- ARV (on-the-fly)
- $364,952
- Comps found
- 12
Show comp detail 12 sales within ~0.75 mi
| Address | Dist | Beds/Ba | Sqft | Sold | Price | $/sf | Match |
|---|---|---|---|---|---|---|---|
| 905 21st Ave N | 0.04mi | 3/2.0 (+1) | 1,152 (+8%) | 6mo | $340,000 | $295 | 75 |
| 2120 Herman St #2 | 0.01mi | 3/2.5 (+1) | 1,200 (+13%) | 9mo | $472,000 | $393 | 63 |
| 2120 Herman St #1 | 0.01mi | 3/2.5 (+1) | 1,200 (+13%) | 9mo | $472,000 | $393 | 63 |
| 2120 Herman St #7 | 0.01mi | 3/2.5 (+1) | 1,200 (+13%) | 9mo | $472,000 | $393 | 63 |
| 2120 Herman St #8 | 0.01mi | 3/2.5 (+1) | 1,200 (+13%) | 9mo | $472,000 | $393 | 63 |
| 2120 Herman St #9 | 0.01mi | 3/2.5 (+1) | 1,200 (+13%) | 9mo | $472,000 | $393 | 63 |
| 717 Lena St | 0.54mi | 3/2.0 (+1) | 1,153 (+8%) | 2mo | $330,000 | $286 | 54 |
| 419 Fisk St | 0.57mi | 2/1.5 | 960 (-10%) | 2mo | $204,500 | $213 | 54 |
| 720 Lena St | 0.51mi | 3/2.0 (+1) | 1,152 (+8%) | 6mo | $395,000 | $343 | 52 |
| 910 29th Ave N | 0.64mi | 3/2.0 (+1) | 1,012 (-5%) | 8mo | $299,000 | $295 | 50 |
| 2607 Alameda St | 0.49mi | 3/1.0 (+1) | 1,147 (+8%) | 8mo | $179,900 | $157 | 48 |
| 2617 Herman St | 0.47mi | 3/2.0 (+1) | 1,168 (+10%) | 13mo | $350,100 | $300 | 46 |
Match score weights: distance 35% · size 25% · config 20% · recency 20%. Top-matched comps best support the ARV.
Projected returns pro-forma
-3.0% appreciation · 2.15% rent growth · sell at horizon
- IRR
- -7.2%
- Equity multiple
- 0.74×
- Total profit
- $-13,947
- Equity at exit
- $28,315
- IRR
- 1.4%
- Equity multiple
- 1.09×
- Total profit
- $4,944
- Equity at exit
- $16,419
Cash invested: $53,172 (down + closing). Projections, not guarantees.
Landlord ↔ Tenant lean methodology
- Overall (STATE)
- 87 Strongly Landlord-Friendly
- State Tennessee
- 87 Strongly Landlord-Friendly · R+13
- County
- — inherits STATE
- City
- — inherits STATE
ZIP-level market 37208
- Home prices YoY
- -12.6%
- Rents YoY
- 2.1%
- Active inventory
- 351
- Price-to-rent
- 8.1×
Monthly cashflow live
- Estimated rent
- $1,960 high interval (Pro) →
- Mortgage (P&I)
- −$996
- Tax from tax record
- −$183 /mo · $2,201/yr
- Insurance
- −$79
- HOA
- −$0
- Vacancy / Maint / Mgmt
- −$412
- Net cashflow
- $290
Break-even live
Sensitivity live
| Price | -10% $398 | -5% $344 | +0% $290 | +5% $237 | +10% $183 |
|---|---|---|---|---|---|
| Rent | -10% $135 | -5% $213 | +0% $290 | +5% $368 | +10% $445 |
| Rate | -1.0pp $386 | -0.5pp $339 | base $290 | +0.5pp $241 | +1.0pp $191 |
UW: 25.0% down · 7.5% · 30yr · 1.5% tax · 5.0% vac · 8.0% maint · 8.0% mgmt
Financing live
Cash to close
- Down payment
- $47,475
- Closing costs
- $5,697
- Reserves months
- —
- Total cash needed
- —
Loan-product check · same deal, 3 products live
Conventional
25% down · 7.5% · 30yr
- Down + closing
- —
- Monthly P&I
- —
- Monthly cashflow
- —
- DSCR
- —
- Eligible?
- —
Personal DTI + credit; lowest rate.
DSCR
20% down · 8.5% · 30yr
- Down + closing
- —
- Monthly P&I
- —
- Monthly cashflow
- —
- DSCR
- —
- Eligible?
- —
No personal income docs; deal must DSCR.
Hard money
10% down · 12.0% · 12mo
- Down + closing
- —
- Monthly P&I
- —
- Monthly cashflow
- —
- DSCR
- —
- Eligible?
- —
Short-term bridge; refi at stabilization.
Rent comps 40 comps
| Address | Beds | Baths | Sqft | Rent | $/sqft | DOM | Units | Dist |
|---|---|---|---|---|---|---|---|---|
| 1911 Morena St Nashville, TN | 2.0 | 2.0 | 928 | $1,595 | $1.72 | 25d | 1 | 0.14mi |
| 1825 Hermosa St Nashville, TN | 3.0 | 2.0 | 1288 | $2,280 | $1.77 | 15d | 1 | 0.14mi |
| 2222 Morena St Unit B Nashville, TN | 2.0 | 1.0 | 700 | $1,350 | $1.93 | 17d | 1 | 0.16mi |
| 2222 Morena St Unit A Nashville, TN | 2.0 | 2.0 | 750 | $1,450 | $1.93 | 17d | 1 | 0.16mi |
| 908 25th Ave N Nashville, TN | 2.0 | 1.0 | 750 | $1,500 | $2.00 | 25d | 1 | 0.29mi |
| 2314 Alameda St Nashville, TN | 3.0 | 2.0 | 1180 | $1,850 | $1.57 | 25d | 1 | 0.30mi |
| 2314 Alameda St Nashville, TN | 3.0 | 2.0 | 1180 | $1,850 | $1.57 | 12d | 1 | 0.30mi |
| 640 21st Ave N Nashville, TN | 1.0–2.0 | 1.0–2.0 | 852 | $3,410 | $4.00 | 22d | 10 | 0.30mi |
| 2100 Clifton Ave Nashville, TN | 2.0 | 1.0 | 750 | $1,875 | $2.50 | 9d | 6 | 0.37mi |
| 2406 Meharry Blvd Unit B Nashville, TN | 2.0 | 1.0 | 750 | $1,095 | $1.46 | 25d | 1 | 0.39mi |
| 1903 Jefferson St Unit 304 Nashville, TN | 2.0 | 2.0 | 903 | $1,525 | $1.69 | 25d | 1 | 0.42mi |
| 2416 Meharry Blvd Unit 2 Nashville, TN | 2.0 | 1.0 | 800 | $1,500 | $1.88 | 22d | 1 | 0.42mi |
| 2416 Meharry Blvd Apt 3 Nashville, TN | 2.0 | 1.0 | 800 | $1,450 | $1.81 | 21d | 1 | 0.42mi |
| 2018 Jefferson St Unit D Nashville, TN | 2.0 | 1.0 | 880 | $1,650 | $1.88 | 25d | 1 | 0.44mi |
| 1723 Jo Johnston Ave Nashville, TN | 2.0 | 2.5 | 1419 | $2,199 | $1.55 | 12d | 1 | 0.45mi |
| 2400 Charlotte Ave Nashville, TN | 1.0–2.0 | 1.0–2.0 | 950 | $2,333 | $2.46 | 3d | 27 | 0.45mi |
| 710 27th Ave N Nashville, TN | 3.0 | 2.0 | 1200 | $2,950 | $2.46 | 15d | 1 | 0.48mi |
| 1813 Pearl St Nashville, TN | 3.0 | 2.0 | 1260 | $2,750 | $2.18 | 25d | 1 | 0.51mi |
| 1727 Pearl St Unit 426-E Nashville, TN | 1.0 | 1.0 | 738 | $1,500 | $2.03 | 25d | 1 | 0.55mi |
| 1037 16th Ave N Unit B Nashville, TN | 3.0 | 2.0 | 1450 | $1,875 | $1.29 | 25d | 1 | 0.56mi |
| 1501 Herman St Nashville, TN | 2.0 | 1.0–2.0 | 922 | $2,769 | $3.00 | 3d | 32 | 0.58mi |
| 800 16th Ave N Nashville, TN | 2.0 | 1.0–2.0 | 798 | $2,557 | $3.20 | 4d | 24 | 0.60mi |
| 2808 Batavia St Nashville, TN | 3.0 | 2.0 | 1130 | $2,000 | $1.77 | 5d | 1 | 0.62mi |
| 1720 Knowles St Unit B Nashville, TN | 2.0 | 1.0 | 870 | $1,299 | $1.49 | 25d | 1 | 0.69mi |
| 2717 Delaware Ave Nashville, TN | 2.0 | 1.0 | 804 | $1,700 | $2.11 | 5d | 1 | 0.70mi |
| 1801 Patterson St Unit 734 Nashville, TN | 2.0 | 2.0 | 1076 | $3,385 | $3.15 | 21d | 1 | 0.70mi |
| 1801 Patterson St Apt 717 Nashville, TN | 2.0 | 2.0 | 1076 | $3,385 | $3.15 | 18d | 1 | 0.71mi |
| 1801 Patterson St Nashville, TN | 1.0–2.0 | 1.0–2.0 | 865 | $3,650 | $4.22 | 22d | 27 | 0.71mi |
| 2714 Jefferson St Unit 202 Nashville, TN | 2.0 | 1.0 | 1050 | $1,349 | $1.28 | 9d | 1 | 0.71mi |
| 1808 State St Nashville, TN | 2.0 | 2.0 | 800 | $1,700 | $2.12 | 25d | 1 | 0.73mi |
| 801 12th Ave N Nashville, TN | 2.0 | 1.0–2.5 | 1024 | $3,570 | $3.49 | 4d | 186 | 0.73mi |
| 1519B 21st Ave N Nashville, TN | 2.0 | 1.5 | 960 | $1,498 | $1.56 | 15d | 1 | 0.75mi |
| 2306 Hammond Dr Nashville, TN | 3.0 | 1.0 | 912 | $1,595 | $1.75 | 25d | 1 | 0.76mi |
| 1708 Underwood St Nashville, TN | 3.0 | 2.0 | 1044 | $1,500 | $1.44 | 5d | 1 | 0.76mi |
| 1700 State St Nashville, TN | 1.0 | 1.0 | 676 | $1,649 | $2.44 | 4d | 13 | 0.78mi |
| 1522 22nd Ave N Nashville, TN | 3.0 | 2.0 | 1350 | $2,600 | $1.93 | 25d | 1 | 0.78mi |
| 1522 22nd Ave N Nashville, TN | 3.0 | 2.0 | 1350 | $2,500 | $1.85 | 5d | 1 | 0.78mi |
| 2830 Georgia Ave Nashville, TN | 3.0 | 2.0 | 704 | $849 | $1.21 | 22d | 1 | 0.79mi |
| 1818 Church St Nashville, TN | 1.0 | 1.0–1.5 | 602 | $1,635 | $2.72 | 3d | 7 | 0.81mi |
| 1600 State St Nashville, TN | 2.0 | 1.0–2.0 | 878 | $3,253 | $3.71 | 3d | 38 | 0.81mi |
Listing history 35 events
-
2026-06-21days on market $189,900 Active 45 DOM
-
2026-06-18days on market $189,900 Active 42 DOM
-
2026-06-17days on market $189,900 Active 41 DOM
-
2026-06-16days on market $189,900 Active 40 DOM
-
2026-06-15days on market $189,900 Active 39 DOM
-
2026-06-13days on market $189,900 Active 37 DOM
-
2026-06-13statusdays on market $189,900 Active 36 DOM
-
2026-06-09days on market $189,900 Active Under Contract 33 DOM
-
2026-06-08days on market $189,900 Active Under Contract 32 DOM
-
2026-06-07days on market $189,900 Active Under Contract 31 DOM
-
2026-06-05days on market $189,900 Active Under Contract 28 DOM
-
2026-06-03days on market $189,900 Active Under Contract 27 DOM
-
2026-06-02days on market $189,900 Active Under Contract 26 DOM
-
2026-06-02status $189,900 Active Under Contract 25 DOM
-
2026-06-01days on market $189,900 Active 25 DOM
-
2026-05-31days on market $189,900 Active 24 DOM
-
2026-05-07$189,900 Active
-
2023-06-08historical
-
2023-06-08status Active
-
2023-04-14status Active
-
2023-04-14price $247,400
-
2023-03-24status Pending
-
2023-03-20$249,900 Active
-
2022-01-31soldstatus $255,900
-
2022-01-19soldstatus $255,900 Closed 506-char remark
Show marketing remark (506 chars)
Excellent Rehab Opportunity . Awesome view of downtown Nashville from the front porch! This cinder block structure has renovation potential! Walk-Out Basement. House is surrounded by new high-end luxury homes and condos. Walk or cycle to downtown. WeGo Public Transit passes in front of the house, 2 min drive ti I-40, I-440, I-65 & Briley Pkwy, 2 min walk to Nashville General Hospital/Meharry Medical College, 7 minute drive to Vanderbilt campus. SOLD AS IS. Please confirm square feet for yourself.
-
2021-12-23historical Active Under Contract 506-char remark
Show marketing remark (506 chars)
Excellent Rehab Opportunity . Awesome view of downtown Nashville from the front porch! This cinder block structure has renovation potential! Walk-Out Basement. House is surrounded by new high-end luxury homes and condos. Walk or cycle to downtown. WeGo Public Transit passes in front of the house, 2 min drive ti I-40, I-440, I-65 & Briley Pkwy, 2 min walk to Nashville General Hospital/Meharry Medical College, 7 minute drive to Vanderbilt campus. SOLD AS IS. Please confirm square feet for yourself.
-
2021-12-19$255,900 Active 506-char remark
Show marketing remark (506 chars)
Excellent Rehab Opportunity . Awesome view of downtown Nashville from the front porch! This cinder block structure has renovation potential! Walk-Out Basement. House is surrounded by new high-end luxury homes and condos. Walk or cycle to downtown. WeGo Public Transit passes in front of the house, 2 min drive ti I-40, I-440, I-65 & Briley Pkwy, 2 min walk to Nashville General Hospital/Meharry Medical College, 7 minute drive to Vanderbilt campus. SOLD AS IS. Please confirm square feet for yourself.
-
2021-09-23soldstatus $235,000
-
2021-09-21soldstatus $235,000 Closed
-
2021-09-09status Pending
-
2021-08-24price $250,000
-
2021-08-02price $280,000
-
2021-08-02status Active
-
2021-07-26status Pending
-
2021-06-29$350,000 Active
ⓘ Source: listings_history table (triggers on properties + properties_extension) + one-shot
backfill from property_details.listing_events for pre-trigger history.
Tax reassessment forecast TN · Resets to sale price
- Current annual tax
- $2,201 · $183/mo
- Projected year-2 tax
- $2,201 · $183/mo
- Expected delta
- $0/yr ($0/mo · 0.0%)
ⓘ Screening estimate from a state-policy table — verify with the county assessor before closing.
Climate risk First Street
- Flood 1/10 Low FEMA zone X (unshaded) · 0% chance over 30 yrs
- Wildfire 1/10 Low
- Heat 6/10 Major 7 d/yr ≥106°F today · 20 d/yr by 30 yrs out
- Wind 4/10 Moderate 10% chance of damaging wind over 30 yrs
- Air quality 2/10 Low 1 unhealthy d/yr today · 2 by 30 yrs out
Nearby sold comps map
Loading sold comps map…
Walkable amenities ~0.75 mi
Loading nearby amenities…
Taxation est. · year 1
- Rental income
- $23,525
- − Mortgage interest
- −$10,637
- − Property taxes
- −$2,201
- − Insurance
- −$950
- − Repairs & maintenance
- −$1,882
- − Management
- −$1,882
- − Depreciation
- −$5,524
- Taxable income
- $449
- Est. tax owed @ 24.0%
- −$108
- After-tax cash flow
- $3,376/yr
For passive investors: Depreciation is non-cash, so a rental often shows a tax loss while cash-flowing — sheltering income. Rental losses are passive: they offset passive income freely, and up to $25,000/yr can offset ordinary (W-2) income if you actively participate and your MAGI is under $100k (phasing out to $0 by $150k); unused losses carry forward. On sale, claimed depreciation is recaptured at up to 25%, and gains may owe capital-gains tax (a 1031 exchange can defer both). Figures are a year-1 estimate at your 24.0% rate — not tax advice; consult a CPA.
Schools (NCES district)
- District
- Davidson County
- NCES district ID
- 4703180
- Math proficiency
- 12% ▼ -17.00%
- Reading proficiency
- 19% ▼ -7.00%
- Median HH income
- $48,667
- Composite
- 14.03/100
- National rank
- #9472
- State rank
- #126 of 139 in TN
Livability — Nashville-Davidson metropolitan government (balance)
No livability data for this city. (Only ~50 U.S. cities are tracked.)
Census & demographics
- Census place
- Nashville-Davidson metropolitan government (balance), TN
- County
- Davidson County · 680,067 people
- City population
- 677,595
- Metro
- Nashville-Davidson--Murfreesboro--Franklin, TN
- Population (ZIP)
- 20,889
- Household income
- $65,556
- Rent vs Own
- Severe rent burden
- 1432.0
Population outlook (Davidson County) Hauer SSP2
- Today (2025)
- 808,568 people
- By 2030
- 874,489 · +8.2%
- By 2040
- 1,009,046 · +24.8%
- By 2050
- 1,147,294 · +41.9%
- By 2075
- 1,475,439 · +82.5%
- By 2100
- 1,714,101 · +112.0%
Race, ethnicity, and origin ACS 2023
- Neighborhood character
- Diverse neighborhood (Simpson 0.56)
- Race & ethnicity
- Black 57% White 34% Two or more races 4% Hispanic / Latino 3% Asian 1%
- Common ancestry
- Romanian 2% Slovak 2% Hispanic 1%
- Foreign-born
- 3% · Canada
- Languages at home
- 95% English-only · Spanish 2% Other Indo-European 1%
Political lean MEDSL · Davidson
- 2024 margin
- Strong D (+27.4) · D 62.7% · R 35.3% · Other 2.0%
- 2008→2024 swing
- +6.5pp toward D · 2008: 21.0pp · 2024: 27.4pp
- All cycles
- 2024: D+27.4 2020: D+32.1 2016: D+26.0 2012: D+18.7 2008: D+21.0
Not yet ingested
- Civics
- —
Market trends
- HPI YoY
- ▼ -59.14%
- Current HPI
- 410.2214
- Rent YoY
- ▲ 2.15%
- Metro
- Nashville-Davidson--Murfreesboro--Franklin, TN
- State GDP YoY
- ▲ 2.78%
- F500 in state
- 22
Industry mix (Fortune 500 HQ in TN)
| Industry | F500 HQs | Revenue |
|---|---|---|
| Healthcare | 3 | $91B |
|
||
| Retail | 3 | $72B |
|
||
| Transportation / Logistics | 1 | $88B |
|
||
| Paper / Packaging | 1 | $19B |
|
||
| Insurance | 1 | $13B |
|
||
| Energy | 1 | $12B |
|
||
Price history
-45.7% since first listed19 events — show timeline
- 2026-05-07 Listed $189,900 REALTRACS as Distributed by MLS Grid
- 2023-06-08 Listing Removed — REALTRACS as Distributed by MLS Grid
- 2023-06-08 Relisted — REALTRACS as Distributed by MLS Grid
- 2023-04-14 Relisted — REALTRACS as Distributed by MLS Grid
- 2023-04-14 Price Changed $247,400 REALTRACS as Distributed by MLS Grid
- 2023-03-24 Pending — REALTRACS as Distributed by MLS Grid
- 2023-03-20 Listed $249,900 REALTRACS as Distributed by MLS Grid
- 2022-01-31 Sold (Public Records) $255,900 Public Records
- 2022-01-19 Sold (MLS) $255,900 REALTRACS as Distributed by MLS Grid
- 2021-12-23 Contingent — REALTRACS as Distributed by MLS Grid
- 2021-12-19 Listed $255,900 REALTRACS as Distributed by MLS Grid
- 2021-09-23 Sold (Public Records) $235,000 Public Records
- 2021-09-21 Sold (MLS) $235,000 REALTRACS as Distributed by MLS Grid
- 2021-09-09 Pending — REALTRACS as Distributed by MLS Grid
- 2021-08-24 Price Changed $250,000 REALTRACS as Distributed by MLS Grid
- 2021-08-02 Price Changed $280,000 REALTRACS as Distributed by MLS Grid
- 2021-08-02 Relisted — REALTRACS as Distributed by MLS Grid
- 2021-07-26 Pending — REALTRACS as Distributed by MLS Grid
- 2021-06-29 Listed $350,000 REALTRACS as Distributed by MLS Grid
Property tax history
+14.8%/yrLatest (2025): $2,201 · +59.3% YoY. Source: county tax records.
Cash-flow waterfall
monthlySold comps — $/sqft
last 12 mo · ≤1 miLoading sold comps…