 🏢 Co-op
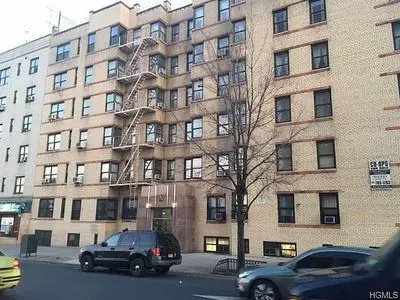
860 Grand Concourse · New York, NY
Flood risk 1/10 · Minimal
- FEMA flood zone
- X (unshaded)
- Chance of flooding over 30 yrs
- 0.0%
- Est. flood insurance / yr
- $507 – $1,088
Fire risk 1/10 · Minimal
- Est. fire insurance / yr
- $691 – $1,283
Heat risk 6/10 · Moderate
- Hot days now (above 99°F)
- 7 days/yr
- Hot days in 30 yrs
- 15 days/yr
Wind risk 6/10 · Moderate
- Chance of severe wind over 30 yrs
- 27.0%
Air-quality risk 4/10 · Minor
- Unhealthy air days now
- 5 days/yr
- Unhealthy air days in 30 yrs
- 6 days/yr
Risk factors via First Street. Map © Google.
Why this score? — see what drove the B+ grade
The composite is a weighted blend of 9 inputs, each scored 0–100. Each bar is that input's sub-score; the figure is the points it added to the 100-point composite (weight × sub-score).
- Cash flow +30.0/30.0
- DSCR +10.0/10.0
- 1% rule +9.8/10.0
- ARV discount +7.5/15.0
- Appreciation +5.3/10.0
- Schools +5.0/10.0
- Livability +3.8/5.0
- Rent growth +3.1/5.0
- Condition / age +2.5/5.0
$165,000
🖨 Deal sheet 📄 Offer letter ✓ Due diligence
Listing remarks
Excellent space for medical use or attorney office space. Prime location in the heart of Yankee stadium. Great space for any medical use. Can be used for attorney use as well. Great opportunity. Priced to sell. A true value. With some tlc this could be a great investment. Needs Board approval. Will not last. Agent Only Remarks
Key facts
- Prime location
- Investment
- Built 1941
Tags
Property features AI
Exterior
- Home design: Built in 1941
- Construction: Constructed in 1941
- Exterior features: Located in the Concourse Village subdivision
Neighborhood map
What this means for you Summary
Snapshot
- This is a ?-bed/1.0-bath condo listed at $165k.
Deal economics
- At list price, monthly cash flow is $783 ($9k/yr) — positive.
- The deal already cash-flows at list — no discount required.
- Meets the 1% rule at list price ($2k rent vs $165k).
- Recommended offer: $163k (1.5% below list) — sets the bar for market timing.
- Cap rate 12.0% vs local median 2.6% in New York — top-decile yield for the area; either an underpriced asset or a hidden risk that comps aren't pricing in. Stress-test before assuming the spread holds.
Location & tenants
- Location reads 75/100 on livability (#268 in NY, #4,188 nationally) — a middle-class / working-renter tenant base. Strengths: amenities A+, commute A+, health & safety A; Watch: crime F, cost of living F.
- Market conditions: Rents rising (+2.6%/yr); 69 active listings in the ZIP; 9 comparable units currently listed for rent nearby; rentals at typical pace (median 15d on market — plan ~3-4 weeks tenant-placement turnaround); lower-income renter base — watch delinquency; 6,929 units permitted in Bronx County in 2024 (6,829 in 5+ unit buildings).
- At $2,435/mo this rent would consume 75% of the median local household income ($39k/yr) (locally 6917% of renters already pay >50% of income on rent) — very limited rent-growth headroom before tenants either downsize or default.
Forward outlook
- In year one you build about $2k of equity ($1k loan paydown + $1k appreciation (0.7% local appreciation)).
- Bronx County population projected at +21% by 2050 — long-run rental-demand tailwind backs the buy-and-hold thesis.
- At projected returns (0.7% appreciation + 2.6% rent growth), your $46k cash investment doubles in ~4 years — after that, you're playing with house money.
Negotiation context
- It's been on market 23 days — a 2% lower offer ($163k) is reasonable based on typical stale-listing flexibility.
- 2 sale attempts since 2y ago with the ask held roughly flat each time — persistent listings suggest the price (not the market) is what's stuck; bring a comps-based counter.
Risks & watch-outs
- Watch-outs: built in 1941 — expect roof / HVAC / electrical / plumbing capex.
- Climate carrying-cost: major wind risk, 27% chance of damaging wind over 30y; extreme-heat days projected 7→15/yr by 2055 (HVAC capex compounding) — expect insurance premiums to compound above CPI over the hold.
Questions for the listing agent
- Built in 1941 — when were the roof, HVAC, electrical panel, plumbing, and water heater last replaced?
- Any open or pending special assessments — roof, HVAC, plumbing, elevator, façade? What's the per-unit balance and payoff schedule, and is the seller paying it off at close or rolling it to the buyer?
- Is there a deadline driving the sale (1031 exchange, divorce, estate, relocation)? That informs how much negotiation room exists.
- Schools are B-rated — typically a magnet for longer-tenancy family renters. What's the average tenant stay here, and is there a school-zone premium baked into asking?
- Crime grade is F in this area — have there been break-ins, vandalism, or insurance claims at this property in the last 3 years? What carrier currently insures it and at what premium?
- What's the average days-on-market for RENTAL listings here right now (not sales)? A rising rental-DOM trend means longer vacancies and softer asking-rent achievability than the comps imply.
- What's the recent tenant-quality profile in this submarket — average credit score on applications, eviction rate, late-payment / NSF rate, and stable-employment percentage? A property-management company in the area should have these aggregated.
- How much new apartment / multifamily construction is in the pipeline within 1–3 miles? Heavy new supply (>2% of stock underway) typically softens rents 12–24 months out; light construction supports rent growth.
Investment metrics
- 1% rule
- 1.48% ✓
- Cap rate
- 11.99%
- Cash-on-cash
- 20.34%
- DSCR
- 1.90
- GRM
- 5.6
CMA / ARV
No comps found within radius.
Projected returns pro-forma
0.67% appreciation · 2.57% rent growth · sell at horizon
- IRR
- 21.3%
- Equity multiple
- 2.07×
- Total profit
- $49,274
- Equity at exit
- $53,487
- IRR
- 24.4%
- Equity multiple
- 3.83×
- Total profit
- $130,748
- Equity at exit
- $68,931
Cash invested: $46,200 (down + closing). Projections, not guarantees.
Landlord ↔ Tenant lean methodology
- Overall (CITY)
- 0 Strongly Tenant-Friendly
- State New York
- 15 Strongly Tenant-Friendly · D+10
- County
- — inherits STATE
- City New York
- 0 Strongly Tenant-Friendly · D+34
ZIP-level market 10451
- Home prices YoY
- 0.7%
- Rents YoY
- 2.6%
- Active inventory
- 69
- Price-to-rent
- 5.6×
Monthly cashflow live
- Estimated rent
- $2,435 medium interval (Pro) →
- Mortgage (P&I)
- −$865
- Tax est. 1.5%
- −$206 /mo · $2,475/yr
- Insurance
- −$69
- HOA
- −$0
- Vacancy / Maint / Mgmt
- −$511
- Net cashflow
- $783
Break-even live
UW: 25.0% down · 7.5% · 30yr · 1.5% tax · 5.0% vac · 8.0% maint · 8.0% mgmt
Financing live
Cash to close
- Down payment
- $41,250
- Closing costs
- $4,950
- Reserves months
- —
- Total cash needed
- —
Loan-product check · same deal, 3 products live
Conventional
25% down · 7.5% · 30yr
- Down + closing
- —
- Monthly P&I
- —
- Monthly cashflow
- —
- DSCR
- —
- Eligible?
- —
Personal DTI + credit; lowest rate.
DSCR
20% down · 8.5% · 30yr
- Down + closing
- —
- Monthly P&I
- —
- Monthly cashflow
- —
- DSCR
- —
- Eligible?
- —
No personal income docs; deal must DSCR.
Hard money
10% down · 12.0% · 12mo
- Down + closing
- —
- Monthly P&I
- —
- Monthly cashflow
- —
- DSCR
- —
- Eligible?
- —
Short-term bridge; refi at stabilization.
Rent comps 9 comps
| Address | Beds | Baths | Sqft | Rent | $/sqft | DOM | Units | Dist |
|---|---|---|---|---|---|---|---|---|
| 206 W 138th St Unit 1032041P New York, NY | 2.0 | 1.0 | — | $6,396 | — | 7d | 1 | 1.26mi |
| 2413 3rd Ave Bronx, NY | 1.0–3.0 | 1.0–2.0 | 857 | $3,948 | $4.60 | 11d | 23 | 1.30mi |
| 123 W 135th St Unit 1424329P New York, NY | 2.0 | 2.0 | — | $6,433 | — | 20d | 1 | 1.30mi |
| 312 W 138th St Unit 2 New York, NY | 3.0 | 3.0 | — | $5,995 | — | 24d | 1 | 1.36mi |
| 5 Lincoln Ave Bronx, NY | 1.0–3.0 | 1.0–2.5 | 1011 | $5,134 | $5.08 | 1d | 183 | 1.36mi |
| 132 W 134th St New York, NY | 2.0 | 1.0 | 750 | $4,500 | $6.00 | 24d | 1 | 1.39mi |
| 224 W 135th St Unit 1032042P New York, NY | 2.0 | 1.0 | — | $7,123 | — | 15d | 1 | 1.40mi |
| 2360 Amsterdam Ave Unit 6A New York, NY | 3.0 | 2.0 | 1175 | $4,500 | $3.83 | 24d | 1 | 1.49mi |
| 300 W 135th St Unit 9G New York, NY | 3.0 | 2.0 | 1032 | $5,500 | $5.33 | 5d | 1 | 1.49mi |
HOA detail condo
- Monthly dues
- $0 · $0/yr
- Assessments
- None detected in remarks — confirm with the listing agent.
Listing history 10 events
-
2026-06-18days on market $165,000 Active 23 DOM
-
2026-06-17days on market $165,000 Active 22 DOM
-
2026-06-15days on market $165,000 Active 20 DOM
-
2026-06-13days on market $165,000 Active 18 DOM
-
2026-06-10days on market $165,000 Active 14 DOM
-
2026-06-08days on market $165,000 Active 13 DOM
-
2026-06-03days on market $165,000 Active 8 DOM
-
2026-06-01days on market $165,000 Active 6 DOM
-
2026-05-31remarks 328-char remark
-
2026-05-31$165,000 Active 5 DOM
ⓘ Source: listings_history table (triggers on properties + properties_extension) + one-shot
backfill from property_details.listing_events for pre-trigger history.
Climate risk First Street
- Flood 1/10 Low FEMA zone X (unshaded) · 0% chance over 30 yrs
- Wildfire 1/10 Low
- Heat 6/10 Major 7 d/yr ≥99°F today · 15 d/yr by 30 yrs out
- Wind 6/10 Major 27% chance of damaging wind over 30 yrs
- Air quality 4/10 Moderate 5 unhealthy d/yr today · 6 by 30 yrs out
Nearby sold comps map
Loading sold comps map…
Walkable amenities ~0.75 mi
Loading nearby amenities…
Taxation est. · year 1
- Rental income
- $29,215
- − Mortgage interest
- −$9,243
- − Property taxes
- −$2,475
- − Insurance
- −$825
- − Repairs & maintenance
- −$2,337
- − Management
- −$2,337
- − Depreciation
- −$4,800
- Taxable income
- $7,198
- Est. tax owed @ 24.0%
- −$1,727
- After-tax cash flow
- $7,669/yr
For passive investors: Depreciation is non-cash, so a rental often shows a tax loss while cash-flowing — sheltering income. Rental losses are passive: they offset passive income freely, and up to $25,000/yr can offset ordinary (W-2) income if you actively participate and your MAGI is under $100k (phasing out to $0 by $150k); unused losses carry forward. On sale, claimed depreciation is recaptured at up to 25%, and gains may owe capital-gains tax (a 1031 exchange can defer both). Figures are a year-1 estimate at your 24.0% rate — not tax advice; consult a CPA.
Schools (NCES district)
No district data.
Livability — New York
- Score
- 75/100
- State rank
- #268
- US rank
- #4188
Category grades
Schools grade is shown separately in the Schools card above.
Census & demographics
- Census place
- New York, NY
- County
- Bronx County · 1,197,324 people
- City population
- 7,731,280
- Metro
- New York-Newark-Jersey City, NY-NJ-PA
- Population (ZIP)
- 50,942
- Household income
- $38,770
- Rent vs Own
- Severe rent burden
- 6917.0
Population outlook (Bronx County) Hauer SSP2
- Today (2025)
- 1,607,353 people
- By 2030
- 1,681,852 · +4.6%
- By 2040
- 1,824,421 · +13.5%
- By 2050
- 1,945,470 · +21.0%
- By 2075
- 2,187,887 · +36.1%
- By 2100
- 2,244,136 · +39.6%
Race, ethnicity, and origin ACS 2023
- Neighborhood character
- Diverse neighborhood (Simpson 0.58)
- Race & ethnicity
- Hispanic / Latino 51% Black 40% Two or more races 12% White 6% Asian 1%
- Hispanic origin (detail)
- Mexican 3% Puerto Rican 14% Dominican 24%
- Common ancestry
- Scotch-Irish 1%
- Foreign-born
- 29% · Canada, United Kingdom, China
- Languages at home
- 46% English-only · Spanish 42% French/Haitian/Cajun 3% Arabic 1%
Political lean MEDSL · Bronx
- 2024 margin
- Solid D (+45.4) · D 72.7% · R 27.3%
- 2008→2024 swing
- -32.3pp toward R · 2008: 77.8pp · 2024: 45.4pp
- All cycles
- 2024: D+45.4 2020: D+67.6 2016: D+79.1 2012: D+82.9 2008: D+77.8
Not yet ingested
- Civics
- —
Market trends
- HPI YoY
- ▲ 0.67%
- Current HPI
- 102.1498
- Rent YoY
- ▲ 2.57%
- Metro
- New York-Newark-Jersey City, NY-NJ-PA
- State GDP YoY
- ▲ 2.60%
- F500 in state
- 92
Industry mix (Fortune 500 HQ in NY)
| Industry | F500 HQs | Revenue |
|---|---|---|
| Financial Services | 10 | $950B |
|
||
| Consumer Goods | 9 | $162B |
|
||
| Insurance | 4 | $225B |
|
||
| Telecommunications | 2 | $144B |
|
||
| Pharmaceuticals | 2 | $112B |
|
||
| Media / Entertainment | 2 | $69B |
|
||
Price history
+6775.0% since first listed3 events — show timeline
- 2026-05-26 Listed $165,000 FSBO.com
- 2025-01-16 Rental Removed $2,400 REBNY
- 2024-09-12 Listed for Rent $2,400 REBNY
Cash-flow waterfall
monthlySold comps — $/sqft
last 12 mo · ≤1 miLoading sold comps…