 Multi-family
4411 Greenholme Dr · Foothill Farms, CA
Flood risk 1/10 · Minimal
- FEMA flood zone
- X (unshaded)
- Chance of flooding over 30 yrs
- 0.0%
- Est. flood insurance / yr
- $507 – $1,088
Fire risk 1/10 · Minimal
- Est. fire insurance / yr
- $659 – $1,223
Heat risk 7/10 · Major
- Hot days now (above 102°F)
- 7 days/yr
- Hot days in 30 yrs
- 16 days/yr
Wind risk 1/10 · Minimal
- Chance of severe wind over 30 yrs
- —
Air-quality risk 10/10 · Severe
- Unhealthy air days now
- 34 days/yr
- Unhealthy air days in 30 yrs
- 38 days/yr
Risk factors via First Street. Map © Google.
Why this score? — see what drove the D grade
The composite is a weighted blend of 9 inputs, each scored 0–100. Each bar is that input's sub-score; the figure is the points it added to the 100-point composite (weight × sub-score).
- Cash flow +13.1/30.0
- ARV discount +7.5/15.0
- Rent growth +4.1/5.0
- DSCR +3.9/10.0
- 1% rule +3.7/10.0
- Livability +3.2/5.0
- Schools +3.1/10.0
- Condition / age +2.2/5.0
- Appreciation +0.0/10.0
$199,900
🖨 Deal sheet 📄 Offer letter ✓ Due diligence
Multi-family units
County records classify this as Multi-Family (5+ Unit). Listing-text estimate: 1 unit. estimate disagrees with records
5+ unit building — per-unit beds/baths from public records are typically unavailable; the breakdown below (if shown) is an estimate from the listing text.
Listing remarks
Welcome to this well-maintained condo located in the heart of Sacramento & acirc; & euro; & trade; s Foothill Farms neighborhood. Situated within a quiet, established community, this property offers a great opportunity for first-time buyers or investors seeking strong rental potential. This 2-bedroom, 1-bathroom unit features approximately 795 square feet of comfortable living space, with a functional layout that maximizes both flow and usability. The interior includes a cozy living area, dedicated dining space, and a practical kitchen equipped with essential appliances. Flooring consists of a mix of carpet and durable vinyl/linoleum, providing both comfort and easy maintenance.
Key facts
- Practical kitchen
- Functional layout
- Essential appliances
Tags
Neighborhood map
What this means for you Summary
Snapshot
- This is a 2-bed/1.0-bath multifamily listed at $200k. Condition is rated fair.
Deal economics
- At list price, monthly cash flow is $-8 ($-95/yr) — negative.
- To cash-flow at today's rent, offer at most $199k (0.6% below list).
- To meet the 1% rule (rent ≥ 1% of price), the offer needs to be $174k (13.0% below list).
- Recommended offer: $174k (13.0% below list) — sets the bar for 1% rule.
- Cap rate 6.2% vs local median 3.9% in Foothill Farms — top-decile yield for the area; either an underpriced asset or a hidden risk that comps aren't pricing in. Stress-test before assuming the spread holds.
Location & tenants
- Location reads 64/100 on livability (#433 in CA) — a middle-class / working-renter tenant base. Strengths: housing A+, schools A; Watch: employment D+, crime F, amenities F.
- Twin Rivers Unified (suburban): math 29% / reading 37% proficiency, ranked #970 of 1,400 in CA (top 69%) — families likely to look elsewhere, expect single-tenant / working-renter base with shorter leases; 76% free/reduced lunch — lower-income household profile, screen leases tightly.
- Market conditions: Rents rising fast (+6.5%/yr); 130 active listings in the ZIP; 40 comparable units currently listed for rent nearby; rentals leasing fast (median 2d on market — plan ~1-2 weeks tenant-placement turnaround); 6,825 units permitted in Sacramento County in 2024 (1,752 in 5+ unit buildings).
- This rent runs 31% of the median local income ($68k/yr) — at the standard rent-burdened threshold; future hikes will face affordability resistance.
Forward outlook
- Local home prices are declining (-3.0%/yr); year-one equity from $1k of loan paydown is wiped out by about $6k of value loss. Plan a longer hold.
- Sacramento County population projected at +17% by 2050 — long-run rental-demand tailwind backs the buy-and-hold thesis.
Negotiation context
- It's been on market 21 days — a 2% lower offer ($197k) is reasonable based on typical stale-listing flexibility.
Risks & watch-outs
- Climate carrying-cost: extreme-heat days projected 7→16/yr by 2055 (HVAC capex compounding) — expect insurance premiums to compound above CPI over the hold.
Questions for the listing agent
- What do current leases actually rent for vs. the listed asking? Can we see a recent rent roll and the last 12 months of T-12 income?
- Have any recent inspections been done? Can we get a copy of the seller's disclosures and any deferred-maintenance estimates?
- Built in 1970 — when were the roof, HVAC, electrical panel, plumbing, and water heater last replaced?
- Is there a deadline driving the sale (1031 exchange, divorce, estate, relocation)? That informs how much negotiation room exists.
- Schools are A-rated — typically a magnet for longer-tenancy family renters. What's the average tenant stay here, and is there a school-zone premium baked into asking?
- Crime grade is F in this area — have there been break-ins, vandalism, or insurance claims at this property in the last 3 years? What carrier currently insures it and at what premium?
- The area grade is low — what's the realistic commute time and amenity access for the typical tenant pool here? Any planned neighborhood developments (good or bad) we should know about?
- What's the average days-on-market for RENTAL listings here right now (not sales)? A rising rental-DOM trend means longer vacancies and softer asking-rent achievability than the comps imply.
- What's the recent tenant-quality profile in this submarket — average credit score on applications, eviction rate, late-payment / NSF rate, and stable-employment percentage? A property-management company in the area should have these aggregated.
- How much new apartment / multifamily construction is in the pipeline within 1–3 miles? Heavy new supply (>2% of stock underway) typically softens rents 12–24 months out; light construction supports rent growth.
Investment metrics
- 1% rule
- 0.87% ✗
- Cap rate
- 6.25%
- Cash-on-cash
- -0.17%
- DSCR
- 0.99
- GRM
- 9.6
CMA / ARV
No comps found within radius.
Projected returns pro-forma
-3.0% appreciation · 6.52% rent growth · sell at horizon
- IRR
- -12.7%
- Equity multiple
- 0.53×
- Total profit
- $-26,498
- Equity at exit
- $29,806
- IRR
- 1.0%
- Equity multiple
- 1.08×
- Total profit
- $4,507
- Equity at exit
- $17,284
Cash invested: $55,972 (down + closing). Projections, not guarantees.
Landlord ↔ Tenant lean methodology
- Overall (STATE)
- 18 Strongly Tenant-Friendly
- State California
- 18 Strongly Tenant-Friendly · D+13
- County
- — inherits STATE
- City
- — inherits STATE
ZIP-level market 95842
- Home prices YoY
- -30.3%
- Rents YoY
- 6.5%
- Active inventory
- 130
- Price-to-rent
- 9.6×
Monthly cashflow live
- Estimated rent
- $1,739 high interval (Pro) →
- Mortgage (P&I)
- −$1,048
- Tax est. 1.5%
- −$250 /mo · $2,998/yr
- Insurance
- −$83
- HOA
- −$0
- Vacancy / Maint / Mgmt
- −$365
- Net cashflow
- $-8
Break-even live
UW: 25.0% down · 7.5% · 30yr · 1.5% tax · 5.0% vac · 8.0% maint · 8.0% mgmt
Financing live
Cash to close
- Down payment
- $49,975
- Closing costs
- $5,997
- Reserves months
- —
- Total cash needed
- —
Loan-product check · same deal, 3 products live
Conventional
25% down · 7.5% · 30yr
- Down + closing
- —
- Monthly P&I
- —
- Monthly cashflow
- —
- DSCR
- —
- Eligible?
- —
Personal DTI + credit; lowest rate.
DSCR
20% down · 8.5% · 30yr
- Down + closing
- —
- Monthly P&I
- —
- Monthly cashflow
- —
- DSCR
- —
- Eligible?
- —
No personal income docs; deal must DSCR.
Hard money
10% down · 12.0% · 12mo
- Down + closing
- —
- Monthly P&I
- —
- Monthly cashflow
- —
- DSCR
- —
- Eligible?
- —
Short-term bridge; refi at stabilization.
Rent comps 40 comps
| Address | Beds | Baths | Sqft | Rent | $/sqft | DOM | Units | Dist |
|---|---|---|---|---|---|---|---|---|
| 5614 Hillsdale Blvd Unit A Sacramento, CA | 2.0 | 1.5 | 933 | $1,450 | $1.55 | 22d | 1 | 0.07mi |
| 4358 Greenholme Dr #9 Sacramento, CA | 1.0 | 1.0 | 844 | $1,695 | $2.01 | 3d | 1 | 0.12mi |
| 5674 Hillsdale Blvd Sacramento, CA | 2.0 | 1.5 | 933 | $1,600 | $1.71 | 2d | 1 | 0.15mi |
| 4549 Greenholme Dr #2 Sacramento, CA | 2.0 | 1.0 | 840 | $2,000 | $2.38 | 3d | 1 | 0.18mi |
| 5800 Hamilton St Sacramento, CA | 1.0–2.0 | 1.0–2.0 | 823 | $1,770 | $2.15 | 2d | 4 | 0.26mi |
| 5600 Walerga Rd #4 Sacramento, CA | 2.0 | 1.0 | 924 | $1,700 | $1.84 | 2d | 1 | 0.28mi |
| 4215 Palm Ave Sacramento, CA | 1.0–2.0 | 1.0–2.0 | 775 | $1,660 | $2.14 | 2d | 3 | 0.29mi |
| 5516 Palmdale Way Sacramento, CA | 3.0 | 2.0 | 1115 | $2,250 | $2.02 | 20d | 1 | 0.34mi |
| 5525 Missie Way Unit 8346003001/85 Sacramento, CA | 2.0 | 1.0 | 1000 | $1,985 | $1.99 | 2d | 1 | 0.44mi |
| 4815 Mary Kate Dr Sacramento, CA | 2.0 | 2.0 | 1100 | $1,850 | $1.68 | 44d | 1 | 0.44mi |
| 4758 Greenholme Dr Sacramento, CA | 2.0 | 1.0 | 924 | $1,595 | $1.73 | 44d | 1 | 0.45mi |
| 4821 Mary Kate Dr Unit 4823 Sacramento, CA | 2.0 | 2.0 | 1050 | $1,675 | $1.60 | 2d | 1 | 0.45mi |
| 5948 Walerga Rd #3 Sacramento, CA | 2.0 | 1.0 | 840 | $1,395 | $1.66 | 2d | 1 | 0.47mi |
| 4440 Oakhollow Dr Sacramento, CA | 1.0–2.0 | 1.0 | 842 | $1,590 | $1.89 | 2d | 8 | 0.48mi |
| 5954 Walerga Rd #3 Sacramento, CA | 2.0 | 1.0 | 840 | $1,395 | $1.66 | 11d | 1 | 0.48mi |
| 5954 Walerga Rd #1 Sacramento, CA | 2.0 | 1.0 | 800 | $1,345 | $1.68 | 2d | 1 | 0.48mi |
| 5443 College Oak Dr Sacramento, CA | 1.0–2.0 | 1.0–2.0 | 821 | $1,850 | $2.25 | 44d | 3 | 0.49mi |
| 5966 Walerga Rd #4 Sacramento, CA | 2.0 | 1.0 | 924 | $1,550 | $1.68 | 2d | 1 | 0.50mi |
| 5415 College Oak Dr Sacramento, CA | 1.0–2.0 | 1.0–2.0 | 850 | $1,725 | $2.03 | 2d | 3 | 0.53mi |
| 5520 Harrison St North Highlands, CA | 2.0 | 1.0 | 735 | $1,478 | $2.01 | 8d | 1 | 0.54mi |
| Venuto Way North Highlands, CA | 2.0 | 1.0 | 906 | $2,095 | $2.31 | 11d | 2 | 0.69mi |
| 5119 Hillsdale Blvd Sacramento, CA | 1.0 | 1.0 | 592 | $1,250 | $2.11 | 2d | 1 | 0.71mi |
| 5416 Jackson St North Highlands, CA | 1.0–2.0 | 1.0–2.0 | 720 | $1,750 | $2.43 | 2d | 30 | 0.72mi |
| 5048 Date Ave Sacramento, CA | 2.0 | 1.0 | 1000 | $1,588 | $1.59 | 44d | 1 | 0.75mi |
| 5341 Walnut Ave Sacramento, CA | 1.0–2.0 | 1.0 | 750 | $1,795 | $2.39 | 2d | 6 | 0.76mi |
| 5625 San Vincente Way North Highlands, CA | 3.0 | 1.0 | 875 | $2,150 | $2.46 | 2d | 1 | 0.79mi |
| 5011 Bremner Way #2 Sacramento, CA | 2.0 | 1.0 | 850 | $1,700 | $2.00 | 2d | 1 | 0.80mi |
| 5011 Bremner Way #3 Sacramento, CA | 2.0 | 1.0 | 850 | $1,700 | $2.00 | 24d | 1 | 0.80mi |
| 5733 San Vincente Way North Highlands, CA | 3.0 | 1.0 | 925 | $2,195 | $2.37 | 2d | 1 | 0.83mi |
| 5008 Bremner Way #3 Sacramento, CA | 2.0 | 1.0 | 850 | $1,650 | $1.94 | 2d | 1 | 0.83mi |
| 5001 Date Ave Sacramento, CA | 3.0 | 2.0 | 1106 | $2,400 | $2.17 | 2d | 1 | 0.83mi |
| 6037 N Haven Dr North Highlands, CA | 3.0 | 1.0 | 884 | $2,150 | $2.43 | 2d | 1 | 0.83mi |
| 4605 Cyclamen Way Sacramento, CA | 2.0 | 1.0 | 870 | $1,695 | $1.95 | 2d | 1 | 0.83mi |
| 4728 Amber Ln Sacramento, CA | 2.0 | 1.0 | 730 | $1,900 | $2.60 | 19d | 1 | 0.86mi |
| 5500 Foothill Garden Ct Sacramento, CA | 1.0 | 1.0 | 750 | $1,472 | $1.96 | 2d | 2 | 0.92mi |
| 4561 Ashcroft Ave Unit 52 Sacramento, CA | 2.0 | 1.0 | 900 | $1,395 | $1.55 | 2d | 1 | 0.98mi |
| 4561 Ashcroft Ave Apt 49 Sacramento, CA | 2.0 | 1.0 | 888 | $1,499 | $1.69 | 2d | 1 | 0.98mi |
| 4552 Ashcroft Ave Unit 36D Sacramento, CA | 2.0 | 1.0 | 800 | $1,250 | $1.56 | 2d | 1 | 0.99mi |
| 5012 Sunshine Ln Sacramento, CA | 2.0 | 1.0 | 970 | $1,775 | $1.83 | 11d | 1 | 1.00mi |
| 5123 Shell St North Highlands, CA | 2.0 | 1.0 | 912 | $1,950 | $2.14 | 2d | 1 | 1.00mi |
Listing history 12 events
-
2026-06-16days on market $199,900 Active 21 DOM
-
2026-06-15days on market $199,900 Active 20 DOM
-
2026-06-13days on market $199,900 Active 18 DOM
-
2026-06-13days on market $199,900 Active 17 DOM
-
2026-06-09days on market $199,900 Active 14 DOM
-
2026-06-08days on market $199,900 Active 13 DOM
-
2026-06-07days on market $199,900 Active 12 DOM
-
2026-06-03days on market $199,900 Active 8 DOM
-
2026-06-02days on market $199,900 Active 7 DOM
-
2026-06-01days on market $199,900 Active 6 DOM
-
2026-05-31days on market $199,900 Active 5 DOM
-
2026-05-26$199,900 Active
ⓘ Source: listings_history table (triggers on properties + properties_extension) + one-shot
backfill from property_details.listing_events for pre-trigger history.
Climate risk First Street
- Flood 1/10 Low FEMA zone X (unshaded) · 0% chance over 30 yrs
- Wildfire 1/10 Low
- Heat 7/10 Severe 7 d/yr ≥102°F today · 16 d/yr by 30 yrs out
- Wind 1/10 Low
- Air quality 10/10 Extreme 34 unhealthy d/yr today · 38 by 30 yrs out
Nearby sold comps map
Loading sold comps map…
Walkable amenities ~0.75 mi
Loading nearby amenities…
Taxation est. · year 1
- Rental income
- $20,863
- − Mortgage interest
- −$11,198
- − Property taxes
- −$2,998
- − Insurance
- −$1,000
- − Repairs & maintenance
- −$1,669
- − Management
- −$1,669
- − Depreciation
- −$5,815
- Taxable loss
- −$3,485
- Est. tax savings @ 24.0%
- +$837
- After-tax cash flow
- $741/yr
For passive investors: Depreciation is non-cash, so a rental often shows a tax loss while cash-flowing — sheltering income. Rental losses are passive: they offset passive income freely, and up to $25,000/yr can offset ordinary (W-2) income if you actively participate and your MAGI is under $100k (phasing out to $0 by $150k); unused losses carry forward. On sale, claimed depreciation is recaptured at up to 25%, and gains may owe capital-gains tax (a 1031 exchange can defer both). Figures are a year-1 estimate at your 24.0% rate — not tax advice; consult a CPA.
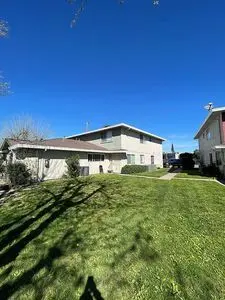
Condition & rehab AI · 1 photo
This multi-family property in Foothill Farms, CA, is in fair condition with average interior and exterior features. It requires moderate repairs and maintenance, particularly in the kitchen and interior walls, to improve its value for resale or rental.
Repairs flagged
- Minor kitchen appliances — Essential appliances present, but no specific details on condition.
- Minor interior walls/paint — No visible damage or issues, but may need touch-up paint.
- Minor landscaping — Well-maintained lawn and landscaping, but may need trimming or additional plants for curb appeal.
Value-add opportunities
- Both Paint interior walls — Fresh paint can improve the home's appearance and increase both resale and rental value.
- Both Replace kitchen appliances — Upgrading to modern appliances can significantly enhance the home's appeal and value.
- Both Landscaping improvements — Enhancing the landscaping can boost curb appeal and attract more potential buyers or renters.
Renovation cost estimate screening
| Repair item | Severity | Est. cost |
|---|---|---|
| kitchen appliances · Essential appliances present, but no specific details on condition. | Minor | $500–3,000 |
| interior walls/paint · No visible damage or issues, but may need touch-up paint. | Minor | $500–3,000 |
| landscaping · Well-maintained lawn and landscaping, but may need trimming or additional plants for curb appeal. | Minor | $500–3,000 |
| Total estimated repair cost · 3 items | $1,500–9,000 |
Value-add ROI direction
- Both Paint interior walls — Fresh paint can improve the home's appearance and increase both resale and rental value. ↑
- Both Replace kitchen appliances — Upgrading to modern appliances can significantly enhance the home's appeal and value. ↑
- Both Landscaping improvements — Enhancing the landscaping can boost curb appeal and attract more potential buyers or renters. ↑
ⓘ Cost ranges are severity-bucket heuristics (US national rule-of-thumb). Get contractor quotes + a written scope before underwriting a rehab budget.
Schools (NCES district)
- District
- Twin Rivers Unified
- NCES district ID
- 0601332
- Math proficiency
- 29% ▲ 2.00%
- Reading proficiency
- 37% ▲ 2.00%
- Median HH income
- $42,481
- Composite
- 30.67/100
- National rank
- #11437
- State rank
- #970 of 1400 in CA
Livability — Foothill Farms
- Score
- 64/100
- State rank
- #433
- US rank
- #14728
Category grades
Schools grade is shown separately in the Schools card above.
Census & demographics
- Census place
- Foothill Farms, CA
- County
- Sacramento County · 1,539,646 people
- City population
- 35,031
- Metro
- Sacramento-Roseville-Folsom, CA
- Population (ZIP)
- 34,034
- Household income
- $68,276
- Rent vs Own
- Severe rent burden
- 1906.0
Population outlook (Sacramento County) Hauer SSP2
- Today (2025)
- 1,660,763 people
- By 2030
- 1,732,990 · +4.3%
- By 2040
- 1,855,755 · +11.7%
- By 2050
- 1,941,335 · +16.9%
- By 2075
- 2,046,162 · +23.2%
- By 2100
- 1,961,444 · +18.1%
Race, ethnicity, and origin ACS 2023
- Neighborhood character
- Highly diverse neighborhood (Simpson 0.71)
- Race & ethnicity
- White 45% Hispanic / Latino 23% Two or more races 14% Asian 12% Black 12% Native American 1%
- Hispanic origin (detail)
- Mexican 19%
- Common ancestry
- Scotch-Irish 5% Subsaharan African 5% Lithuanian 2%
- Foreign-born
- 26% · Canada, Vietnam, South Korea
- Languages at home
- 61% English-only · Spanish 14% Russian/Polish/Slavic 11% Other Indo-European 5%
Political lean MEDSL · Sacramento
- 2024 margin
- D (+19.7) · D 58.1% · R 38.4% · Other 3.5%
- 2008→2024 swing
- +0.7pp no change · 2008: 19.0pp · 2024: 19.7pp
- All cycles
- 2024: D+19.7 2020: D+25.3 2016: D+23.7 2012: D+16.3 2008: D+19.0
Not yet ingested
- Civics
- —
Market trends
- HPI YoY
- ▼ -166.74%
- Current HPI
- 384.1812
- Rent YoY
- ▲ 6.52%
- Metro
- Sacramento-Roseville-Folsom, CA
- State GDP YoY
- ▲ 3.21%
- F500 in state
- 116
Industry mix (Fortune 500 HQ in CA)
| Industry | F500 HQs | Revenue |
|---|---|---|
| Technology | 27 | $1,492B |
|
||
| Financial Services | 3 | $174B |
|
||
| Retail | 3 | $44B |
|
||
| Insurance | 3 | $26B |
|
||
| Media / Entertainment | 2 | $115B |
|
||
| Pharmaceuticals / Biotech | 2 | $62B |
|
||
Price history
1 event — show timeline
- 2026-05-26 Listed $199,900 FSBO.com
Cash-flow waterfall
monthlySold comps — $/sqft
last 12 mo · ≤1 miLoading sold comps…