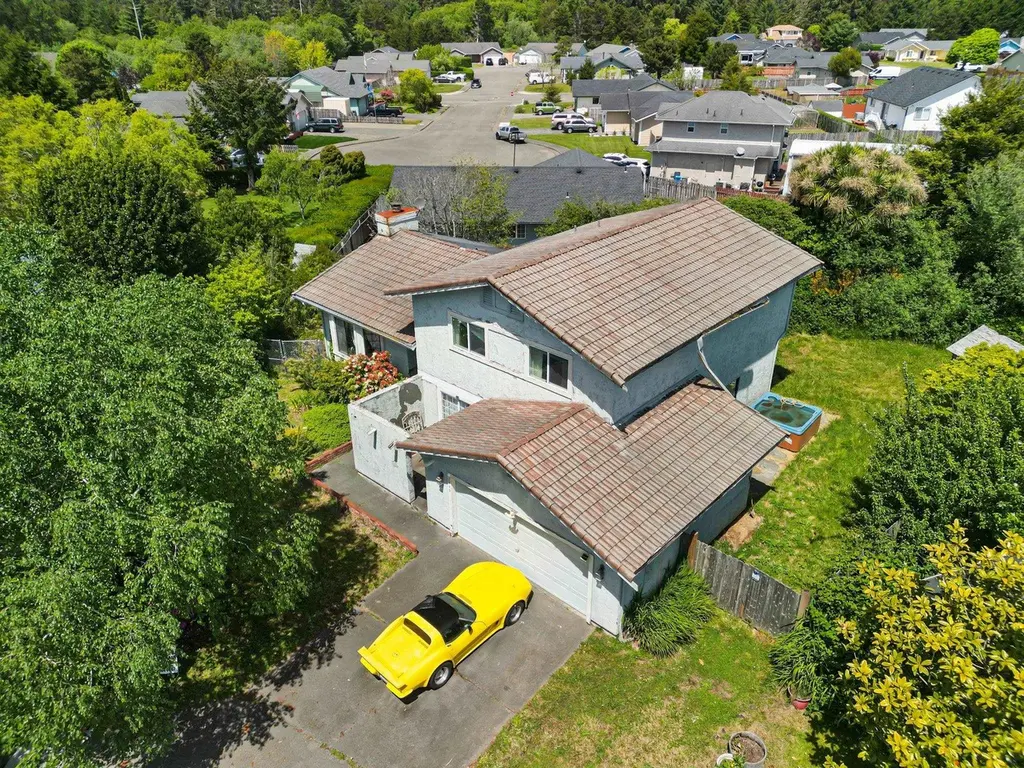
1745 Potomac Ct · Crescent City, CA
Flood risk 4/10 · Minor
- FEMA flood zone
- X (unshaded)
- Chance of flooding over 30 yrs
- 0.2%
- Est. flood insurance / yr
- $507 – $1,088
Fire risk 3/10 · Minor
- Est. fire insurance / yr
- $659 – $1,223
Heat risk 2/10 · Minimal
- Hot days now (above 71°F)
- 8 days/yr
- Hot days in 30 yrs
- 27 days/yr
Wind risk 1/10 · Minimal
- Chance of severe wind over 30 yrs
- —
Air-quality risk 6/10 · Moderate
- Unhealthy air days now
- 8 days/yr
- Unhealthy air days in 30 yrs
- 9 days/yr
Risk factors via First Street. Map © Google.
Why this score? — see what drove the D grade
The composite is a weighted blend of 9 inputs, each scored 0–100. Each bar is that input's sub-score; the figure is the points it added to the 100-point composite (weight × sub-score).
- ARV discount +15.0/15.0
- Cash flow +9.5/30.0
- Livability +2.9/5.0
- Schools +2.8/10.0
- DSCR +2.7/10.0
- 1% rule +2.5/10.0
- Rent growth +2.5/5.0
- Condition / age +2.5/5.0
- Appreciation +0.0/10.0
$310,000
🖨 Deal sheet 📄 Offer letter ✓ Due diligence
Listing remarks MLS
A diamond in the rough. This property has an immense amount of potential just needs some assistance getting it there. Sitting atop . 21 acres in a well maintained subdivision of consistent homes, near schools, town and ocean beaches, this large split level home features 4 bedrooms, 3 bathrooms, 2400+ sq feet and has a cul-de-sac location. 3 of the 4 bedrooms and 2 of the 3 bathrooms are located upstairs. Mid level is the entry level of the home and is the entertaining level with living room, kitchen, dining, and back deck. Downstairs features a large open family room with a pellet stove, laundry room, the final bedroom and bathroom. Drive By Today!
Key facts
- Cul-de-sac location
- Entertaining level
- Back deck
Tags
Neighborhood map
What this means for you Summary
Snapshot
- This is a 4-bed/3.0-bath single-family listed at $310k.
Deal economics
- At list price, monthly cash flow is $-217 ($-3k/yr) — negative.
- To cash-flow at today's rent, offer at most $272k (12.3% below list).
- To meet the 1% rule (rent ≥ 1% of price), the offer needs to be $231k (25.4% below list).
- Recommended offer: $231k (25.4% below list) — sets the bar for 1% rule.
- Cap rate 5.5% vs local median 3.1% in Crescent City — top-decile yield for the area; either an underpriced asset or a hidden risk that comps aren't pricing in. Stress-test before assuming the spread holds.
Location & tenants
- Location reads 57/100 on livability (#730 in CA) — a working-class tenant base; expect higher turnover. Strengths: health & safety A+, housing A; Watch: cost of living D, schools D-, crime F.
- Del Norte County Unified (town): math 25% / reading 36% proficiency, ranked #1,047 of 1,400 in CA (top 75%) — families likely to look elsewhere, expect single-tenant / working-renter base with shorter leases.
- Market conditions: 226 active listings in the ZIP; 55 units permitted in Del Norte County in 2024 (22 in 5+ unit buildings).
Forward outlook
- Local home prices are declining (-3.0%/yr); year-one equity from $2k of loan paydown is wiped out by about $9k of value loss. Plan a longer hold.
- Del Norte County population projected at -14% by 2050 — secular population decline; favor cash flow + early exit over multi-decade hold.
Negotiation context
- It's been on market 521 days — a 12% lower offer ($273k) is reasonable based on typical stale-listing flexibility.
Questions for the listing agent
- What do current leases actually rent for vs. the listed asking? Can we see a recent rent roll and the last 12 months of T-12 income?
- It's been on market 521 days. Have you received any prior offers? Is the seller open to a 25% concession, seller financing, or rate buy-down credit?
- Why hasn't it sold? Are there any deal-killer items the seller is aware of (foundation, flood, title, zoning, code violations)?
- Is there a deadline driving the sale (1031 exchange, divorce, estate, relocation)? That informs how much negotiation room exists.
- Schools are D-rated, which usually means shorter tenancies and higher turnover. Who's the typical renter profile here, and what's been the actual vacancy rate?
- Crime grade is F in this area — have there been break-ins, vandalism, or insurance claims at this property in the last 3 years? What carrier currently insures it and at what premium?
- The area grade is low — what's the realistic commute time and amenity access for the typical tenant pool here? Any planned neighborhood developments (good or bad) we should know about?
- What's the average days-on-market for RENTAL listings here right now (not sales)? A rising rental-DOM trend means longer vacancies and softer asking-rent achievability than the comps imply.
- What's the recent tenant-quality profile in this submarket — average credit score on applications, eviction rate, late-payment / NSF rate, and stable-employment percentage? A property-management company in the area should have these aggregated.
- How much new for-sale + rental construction is in the pipeline within 1–3 miles? Heavy new supply typically softens prices + rents 12–24 months out; constrained supply supports both.
Investment metrics
- 1% rule
- 0.75% ✗
- Cap rate
- 5.45%
- Cash-on-cash
- -3.00%
- DSCR
- 0.87
- GRM
- 11.2
CMA / ARV
- ARV (median comp)
- $445,581
- List price
- $310,000
- Delta
- -30.43%
- Verdict
- UNDERPRICED
- Comps
- 20 within 1.0 mi
Show comp detail 8 sales within ~0.75 mi
| Address | Dist | Beds/Ba | Sqft | Sold | Price | $/sf | Match |
|---|---|---|---|---|---|---|---|
| 1725 S Bethesda Way | 0.07mi | 4/3.0 | 2,510 (+1%) | 18mo | $480,000 | $191 | 81 |
| 1740 S Bethesda Way | 0.04mi | 4/2.5 | 2,204 (-12%) | 12mo | $467,500 | $212 | 67 |
| 260 W Jefferson Ave | 0.10mi | 4/2.5 | 2,140 (-14%) | 3mo | $475,000 | $222 | 67 |
| 1625 Franklin Ct | 0.13mi | 4/2.0 | 2,169 (-13%) | 8mo | $413,500 | $191 | 61 |
| 1725 Northcrest Dr | 0.41mi | 3/2.0 (-1) | 2,240 (-10%) | 2mo | $380,000 | $170 | 53 |
| 1700 Potomac Ct | 0.05mi | 4/2.0 | 2,140 (-14%) | 22mo | $465,000 | $217 | 52 |
| 1620 Franklin Ct | 0.15mi | 4/2.5 | 2,206 (-12%) | 24mo | $448,000 | $203 | 52 |
| 1333 Oregon St | 0.59mi | 4/3.0 | 2,162 (-13%) | 10mo | $408,000 | $189 | 42 |
Match score weights: distance 35% · size 25% · config 20% · recency 20%. Top-matched comps best support the ARV.
Projected returns pro-forma
-3.0% appreciation · 3.0% rent growth · sell at horizon
- IRR
- -21.3%
- Equity multiple
- 0.26×
- Total profit
- $-64,059
- Equity at exit
- $46,222
- IRR
- -14.9%
- Equity multiple
- 0.15×
- Total profit
- $-73,654
- Equity at exit
- $26,803
Cash invested: $86,800 (down + closing). Projections, not guarantees.
Landlord ↔ Tenant lean methodology
- Overall (STATE)
- 18 Strongly Tenant-Friendly
- State California
- 18 Strongly Tenant-Friendly · D+13
- County
- — inherits STATE
- City
- — inherits STATE
ZIP-level market 95531
- Active inventory
- 226
- Price-to-rent
- 11.2×
Monthly cashflow live
- Estimated rent
- $2,313 medium interval (Pro) →
- Mortgage (P&I)
- −$1,626
- Tax from tax record
- −$289 /mo · $3,473/yr
- Insurance
- −$129
- HOA
- −$0
- Vacancy / Maint / Mgmt
- −$486
- Net cashflow
- $-217
Break-even live
UW: 25.0% down · 7.5% · 30yr · 1.5% tax · 5.0% vac · 8.0% maint · 8.0% mgmt
Financing live
Cash to close
- Down payment
- $77,500
- Closing costs
- $9,300
- Reserves months
- —
- Total cash needed
- —
Loan-product check · same deal, 3 products live
Conventional
25% down · 7.5% · 30yr
- Down + closing
- —
- Monthly P&I
- —
- Monthly cashflow
- —
- DSCR
- —
- Eligible?
- —
Personal DTI + credit; lowest rate.
DSCR
20% down · 8.5% · 30yr
- Down + closing
- —
- Monthly P&I
- —
- Monthly cashflow
- —
- DSCR
- —
- Eligible?
- —
No personal income docs; deal must DSCR.
Hard money
10% down · 12.0% · 12mo
- Down + closing
- —
- Monthly P&I
- —
- Monthly cashflow
- —
- DSCR
- —
- Eligible?
- —
Short-term bridge; refi at stabilization.
Listing history 20 events
-
2026-06-19days on market $310,000 Active 521 DOM
-
2026-06-18days on market $310,000 Active 520 DOM
-
2026-06-17days on market $310,000 Active 519 DOM
-
2026-06-16days on market $310,000 Active 518 DOM
-
2026-06-15days on market $310,000 Active 517 DOM
-
2026-06-14days on market $310,000 Active 515 DOM
-
2026-06-12days on market $310,000 Active 514 DOM
-
2026-06-09days on market $310,000 Active 511 DOM
-
2026-06-08days on market $310,000 Active 510 DOM
-
2026-06-07days on market $310,000 Active 509 DOM
-
2026-06-07days on market $310,000 Active 508 DOM
-
2026-06-04days on market $310,000 Active 505 DOM
-
2026-06-02days on market $310,000 Active 504 DOM
-
2026-06-01days on market $310,000 Active 503 DOM
-
2026-05-31days on market $310,000 Active 502 DOM
-
2026-05-31days on market $310,000 Active 501 DOM
-
2026-05-18price $310,000 656-char remark
Show marketing remark (656 chars)
A diamond in the rough. This property has an immense amount of potential just needs some assistance getting it there. Sitting atop . 21 acres in a well maintained subdivision of consistent homes, near schools, town and ocean beaches, this large split level home features 4 bedrooms, 3 bathrooms, 2400+ sq feet and has a cul-de-sac location. 3 of the 4 bedrooms and 2 of the 3 bathrooms are located upstairs. Mid level is the entry level of the home and is the entertaining level with living room, kitchen, dining, and back deck. Downstairs features a large open family room with a pellet stove, laundry room, the final bedroom and bathroom. Drive By Today!
-
2025-07-09price $325,000 656-char remark
Show marketing remark (656 chars)
A diamond in the rough. This property has an immense amount of potential just needs some assistance getting it there. Sitting atop . 21 acres in a well maintained subdivision of consistent homes, near schools, town and ocean beaches, this large split level home features 4 bedrooms, 3 bathrooms, 2400+ sq feet and has a cul-de-sac location. 3 of the 4 bedrooms and 2 of the 3 bathrooms are located upstairs. Mid level is the entry level of the home and is the entertaining level with living room, kitchen, dining, and back deck. Downstairs features a large open family room with a pellet stove, laundry room, the final bedroom and bathroom. Drive By Today!
-
2025-06-09price $335,000 656-char remark
Show marketing remark (656 chars)
A diamond in the rough. This property has an immense amount of potential just needs some assistance getting it there. Sitting atop . 21 acres in a well maintained subdivision of consistent homes, near schools, town and ocean beaches, this large split level home features 4 bedrooms, 3 bathrooms, 2400+ sq feet and has a cul-de-sac location. 3 of the 4 bedrooms and 2 of the 3 bathrooms are located upstairs. Mid level is the entry level of the home and is the entertaining level with living room, kitchen, dining, and back deck. Downstairs features a large open family room with a pellet stove, laundry room, the final bedroom and bathroom. Drive By Today!
-
2025-01-14$350,000 Active 656-char remark
Show marketing remark (656 chars)
A diamond in the rough. This property has an immense amount of potential just needs some assistance getting it there. Sitting atop . 21 acres in a well maintained subdivision of consistent homes, near schools, town and ocean beaches, this large split level home features 4 bedrooms, 3 bathrooms, 2400+ sq feet and has a cul-de-sac location. 3 of the 4 bedrooms and 2 of the 3 bathrooms are located upstairs. Mid level is the entry level of the home and is the entertaining level with living room, kitchen, dining, and back deck. Downstairs features a large open family room with a pellet stove, laundry room, the final bedroom and bathroom. Drive By Today!
ⓘ Source: listings_history table (triggers on properties + properties_extension) + one-shot
backfill from property_details.listing_events for pre-trigger history.
Tax reassessment forecast CA · Resets to sale price
- Current annual tax
- $3,473 · $289/mo
- Projected year-2 tax
- $3,473 · $289/mo
- Expected delta
- $0/yr ($0/mo · 0.0%)
ⓘ Screening estimate from a state-policy table — verify with the county assessor before closing.
Climate risk First Street
- Flood 4/10 Moderate FEMA zone X (unshaded) · 20% chance over 30 yrs
- Wildfire 3/10 Moderate
- Heat 2/10 Low 8 d/yr ≥71°F today · 27 d/yr by 30 yrs out
- Wind 1/10 Low
- Air quality 6/10 Major 8 unhealthy d/yr today · 9 by 30 yrs out
Nearby sold comps map
Loading sold comps map…
Walkable amenities ~0.75 mi
Loading nearby amenities…
Taxation est. · year 1
- Rental income
- $27,760
- − Mortgage interest
- −$17,365
- − Property taxes
- −$3,473
- − Insurance
- −$1,550
- − Repairs & maintenance
- −$2,221
- − Management
- −$2,221
- − Depreciation
- −$9,018
- Taxable loss
- −$8,087
- Est. tax savings @ 24.0%
- +$1,941
- After-tax cash flow
- $-659/yr
For passive investors: Depreciation is non-cash, so a rental often shows a tax loss while cash-flowing — sheltering income. Rental losses are passive: they offset passive income freely, and up to $25,000/yr can offset ordinary (W-2) income if you actively participate and your MAGI is under $100k (phasing out to $0 by $150k); unused losses carry forward. On sale, claimed depreciation is recaptured at up to 25%, and gains may owe capital-gains tax (a 1031 exchange can defer both). Figures are a year-1 estimate at your 24.0% rate — not tax advice; consult a CPA.
Schools (NCES district)
- District
- Del Norte County Unified
- NCES district ID
- 0610770
- Math proficiency
- 25% ▲ 1.00%
- Reading proficiency
- 36% ▲ 1.00%
- Median HH income
- $39,747
- Composite
- 28.43/100
- National rank
- #12110
- State rank
- #1047 of 1400 in CA
Livability — Crescent City
- Score
- 57/100
- State rank
- #730
- US rank
- #21544
Category grades
Schools grade is shown separately in the Schools card above.
Census & demographics
- Population (ZIP)
- 22,491
Population outlook (Del Norte County) Hauer SSP2
- Today (2025)
- 25,011 people
- By 2030
- 24,204 · -3.2%
- By 2040
- 22,826 · -8.7%
- By 2050
- 21,495 · -14.1%
- By 2075
- 18,487 · -26.1%
- By 2100
- 16,113 · -35.6%
Race, ethnicity, and origin ACS 2023
- Neighborhood character
- Diverse neighborhood (Simpson 0.58)
- Race & ethnicity
- White 61% Hispanic / Latino 20% Two or more races 12% Native American 5% Asian 4% Black 3%
- Hispanic origin (detail)
- Mexican 15%
- Common ancestry
- Slovak 4% Russian 2% Lithuanian 2%
- Foreign-born
- 8% · Canada, Vietnam, South Korea
- Languages at home
- 88% English-only · Spanish 8% Other Asian/Pacific 2% Vietnamese 1%
Political lean MEDSL · Del Norte
- 2024 margin
- R (+16.4) · D 40.4% · R 56.8% · Other 2.8%
- 2008→2024 swing
- -9.7pp toward R · 2008: -6.8pp · 2024: -16.4pp
- All cycles
- 2024: R+16.4 2020: R+15.6 2016: R+17.6 2012: R+10.8 2008: R+6.8
Not yet ingested
- Civics
- —
Market trends
- HPI YoY
- ▼ -300.53%
- Current HPI
- 148.4819
- Rent YoY
- —
- Metro
- —
- State GDP YoY
- ▲ 3.21%
- F500 in state
- 116
Industry mix (Fortune 500 HQ in CA)
| Industry | F500 HQs | Revenue |
|---|---|---|
| Technology | 27 | $1,492B |
|
||
| Financial Services | 3 | $174B |
|
||
| Retail | 3 | $44B |
|
||
| Insurance | 3 | $26B |
|
||
| Media / Entertainment | 2 | $115B |
|
||
| Pharmaceuticals / Biotech | 2 | $62B |
|
||
Price history
-11.4% since first listed4 events — show timeline
- 2026-05-18 Price Changed $310,000 DNAORMLS
- 2025-07-09 Price Changed $325,000 DNAORMLS
- 2025-06-09 Price Changed $335,000 DNAORMLS
- 2025-01-14 Listed $350,000 DNAORMLS
Property tax history
+1.9%/yrLatest (2025): $3,473 · +4.6% YoY. Source: county tax records.
Cash-flow waterfall
monthlySold comps — $/sqft
last 12 mo · ≤1 miLoading sold comps…