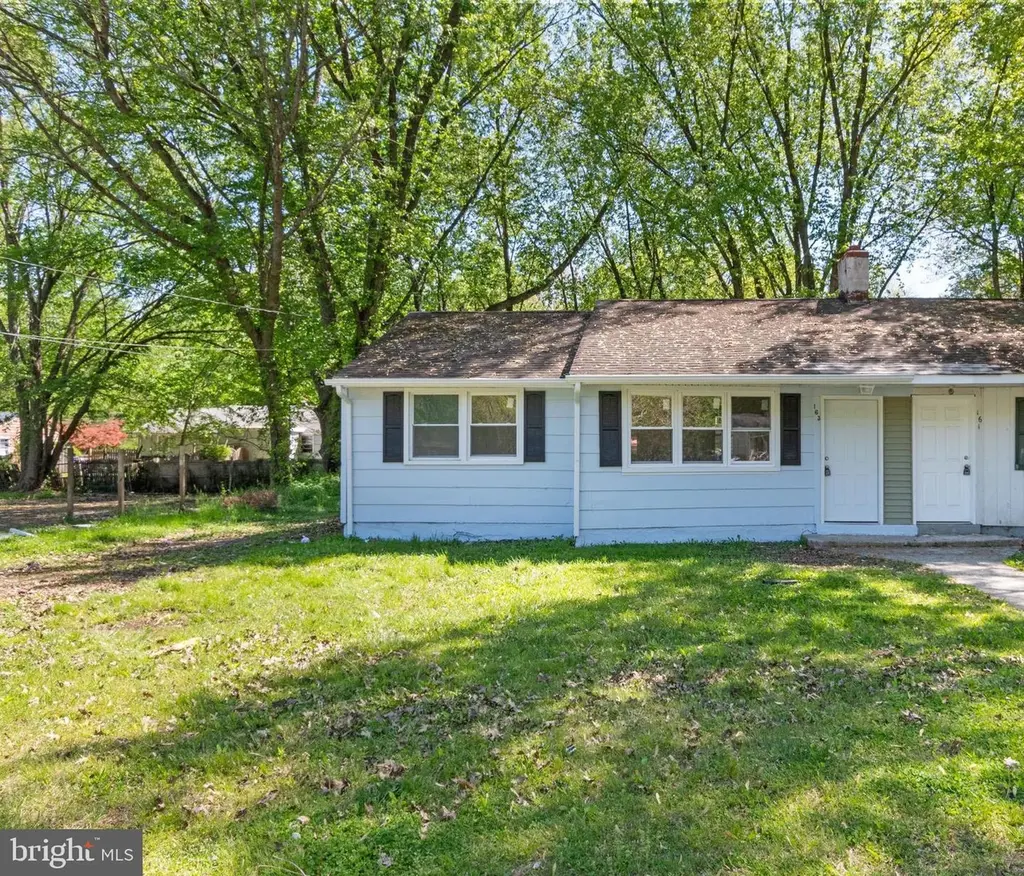
163 Kinsley Rd · Pemberton, NJ
Flood risk 4/10 · Minor
- FEMA flood zone
- X (unshaded)
- Chance of flooding over 30 yrs
- 0.22%
- Est. flood insurance / yr
- $507 – $1,088
Fire risk 3/10 · Minor
- Est. fire insurance / yr
- $526 – $976
Heat risk 6/10 · Moderate
- Hot days now (above 103°F)
- 7 days/yr
- Hot days in 30 yrs
- 15 days/yr
Wind risk 6/10 · Moderate
- Chance of severe wind over 30 yrs
- 56.0%
Air-quality risk 4/10 · Minor
- Unhealthy air days now
- 5 days/yr
- Unhealthy air days in 30 yrs
- 7 days/yr
Risk factors via First Street. Map © Google.
Why this score? — see what drove the C- grade
The composite is a weighted blend of 9 inputs, each scored 0–100. Each bar is that input's sub-score; the figure is the points it added to the 100-point composite (weight × sub-score).
- Cash flow +23.0/30.0
- DSCR +7.4/10.0
- 1% rule +5.5/10.0
- ARV discount +5.2/15.0
- Livability +3.6/5.0
- Rent growth +2.5/5.0
- Condition / age +2.5/5.0
- Schools +2.3/10.0
- Appreciation +1.6/10.0
$169,900
🖨 Deal sheet 📄 Offer letter ✓ Due diligence
Listing remarks
Fully remodeled throughout, this charming ranch blends modern finishes, functional living, and unbeatable affordability. Welcome to 163 Kinsley Road, nestled in the growing community of Pemberton Township. This beautifully renovated 2-bedroom ranch has been completely updated from top to bottom, offering a clean, modern feel paired with everyday comfort. Step inside to a thoughtfully designed interior featuring cohesive finishes and a bright, refreshed living space that’s truly move-in ready. Outside, enjoy a multi-car driveway, storage shed, and a spacious backyard situated on a generously sized lot—perfect for relaxing, entertaining, or future expansion. With low taxes, no HOA
Key facts
- Spacious backyard
- Remodeled ranch
- Generously sized lot
Tags
Property features AI
Exterior
- Parking: Driveway
- Utilities: Public water; Private sewer
- Home design: Semi-detached property; Fee simple ownership; Year built (estimated)
- Construction: Frame construction; Slab foundation; Above grade and below grade structures
- Exterior features: Lot approximately 50 x 120 (estimated); No tidal water
Interior
- Bedrooms: Two bedrooms on the main level
- Bathrooms: One full bathroom on the main level; One full bathroom total
- Heating & cooling: 90% forced air heating; Natural gas heating; Natural gas hot water
- Interior features: Estimated living area; Two or more access exits; No stairs (single-level access)
Neighborhood map
What this means for you Summary
Snapshot
- This is a 2-bed/1.0-bath single-family listed at $170k.
Deal economics
- At list price, monthly cash flow is $302 ($4k/yr) — positive.
- The deal already cash-flows at list — no discount required.
- Meets the 1% rule at list price ($2k rent vs $170k).
- Recommended offer: $165k (3.0% below list) — sets the bar for market timing.
- Cap rate 8.4% vs local median 4.9% in Pemberton — top-decile yield for the area; either an underpriced asset or a hidden risk that comps aren't pricing in. Stress-test before assuming the spread holds.
Location & tenants
- Location reads 72/100 on livability (#217 in NJ) — a middle-class / working-renter tenant base. Strengths: crime A+, housing A+, health & safety A+; Watch: cost of living C-, schools D-, amenities F.
- Pemberton Township School District (rural): math 12% / reading 38% proficiency, ranked #382 of 472 in NJ (top 81%) — low school quality limits family demand, transient renter base, plan for 1-2y turnover.
- Market conditions: 44 active listings in the ZIP; 4 comparable units currently listed for rent nearby; rentals leasing fast (median 1d on market — plan ~1-2 weeks tenant-placement turnaround); 2,161 units permitted in Burlington County in 2024 (988 in 5+ unit buildings).
Forward outlook
- Local home prices are declining (-3.0%/yr); year-one equity from $1k of loan paydown is wiped out by about $5k of value loss. Plan a longer hold.
- Burlington County population projected to shrink 5% by 2050 — rents likely to lag national; underwrite the cash flow, not the appreciation.
Negotiation context
- It's been on market 44 days — a 3% lower offer ($165k) is reasonable based on typical stale-listing flexibility.
- 2 sale attempts with the ask held roughly flat each time — persistent listings suggest the price (not the market) is what's stuck; bring a comps-based counter.
- Current owner paid $18k; list at $170k implies a 844% gain — meaningful room to come down on a strong offer.
Risks & watch-outs
- Watch-outs: built in 1952 — expect roof / HVAC / electrical / plumbing capex.
- Climate carrying-cost: major wind risk, 56% chance of damaging wind over 30y; extreme-heat days projected 7→15/yr by 2055 (HVAC capex compounding) — expect insurance premiums to compound above CPI over the hold.
Questions for the listing agent
- It's been on market 44 days. Have you received any prior offers? Is the seller open to a 3% concession, seller financing, or rate buy-down credit?
- Built in 1952 — when were the roof, HVAC, electrical panel, plumbing, and water heater last replaced?
- Is there a deadline driving the sale (1031 exchange, divorce, estate, relocation)? That informs how much negotiation room exists.
- Schools are D-rated, which usually means shorter tenancies and higher turnover. Who's the typical renter profile here, and what's been the actual vacancy rate?
- What's the average days-on-market for RENTAL listings here right now (not sales)? A rising rental-DOM trend means longer vacancies and softer asking-rent achievability than the comps imply.
- What's the recent tenant-quality profile in this submarket — average credit score on applications, eviction rate, late-payment / NSF rate, and stable-employment percentage? A property-management company in the area should have these aggregated.
- How much new for-sale + rental construction is in the pipeline within 1–3 miles? Heavy new supply typically softens prices + rents 12–24 months out; constrained supply supports both.
Investment metrics
- 1% rule
- 1.05% ✓
- Cap rate
- 8.43%
- Cash-on-cash
- 7.63%
- DSCR
- 1.34
- GRM
- 7.9
CMA / ARV
- ARV (median comp)
- $161,696
- List price
- $169,900
- Delta
- 5.07%
- Verdict
- FAIR
- Comps
- 20 within 1.0 mi
Show comp detail 11 sales within ~0.75 mi
| Address | Dist | Beds/Ba | Sqft | Sold | Price | $/sf | Match |
|---|---|---|---|---|---|---|---|
| 147 Lemmon Ave | 0.11mi | 2/1.0 | 690 (0%) | 1mo | $177,000 | $257 | 94 |
| 912 Pemberton Browns Mills Rd | 0.03mi | 2/1.0 | 690 (0%) | 6mo | $187,500 | $272 | 93 |
| 914 Pemberton Browns Mills Rd | 0.04mi | 2/1.0 | 690 (0%) | 6mo | $187,500 | $272 | 93 |
| 142 Kinsley Rd | 0.10mi | 2/1.0 | 690 (0%) | 13mo | $134,000 | $194 | 84 |
| 199 Kinsley Rd | 0.19mi | 2/1.0 | 705 (+2%) | 9mo | $164,900 | $234 | 80 |
| 128 Lemmon Ave | 0.22mi | 2/1.0 | 690 (0%) | 13mo | $165,000 | $239 | 79 |
| 132 Lemmon Ave | 0.19mi | 2/1.0 | 705 (+2%) | 10mo | $173,000 | $245 | 79 |
| 217 Kinsley Rd | 0.27mi | 2/1.0 | 690 (0%) | 10mo | $175,000 | $254 | 78 |
| 112 Kinsley | 0.27mi | 2/1.0 | 710 (+3%) | 6mo | $175,000 | $246 | 77 |
| 220 Norcross Ln | 0.29mi | 2/1.0 | 690 (0%) | 21mo | $140,000 | $203 | 69 |
| 123 Jane St | 0.61mi | 2/1.0 | 672 (-3%) | 17mo | $235,000 | $350 | 53 |
Match score weights: distance 35% · size 25% · config 20% · recency 20%. Top-matched comps best support the ARV.
Projected returns pro-forma
-3.0% appreciation · 3.0% rent growth · sell at horizon
- IRR
- -4.7%
- Equity multiple
- 0.83×
- Total profit
- $-8,283
- Equity at exit
- $25,333
- IRR
- 5.0%
- Equity multiple
- 1.37×
- Total profit
- $17,537
- Equity at exit
- $14,690
Cash invested: $47,572 (down + closing). Projections, not guarantees.
Landlord ↔ Tenant lean methodology
- Overall (STATE)
- 21 Tenant-Leaning
- State New Jersey
- 21 Tenant-Leaning · D+6
- County
- — inherits STATE
- City
- — inherits STATE
ZIP-level market 08068
- Home prices YoY
- -2.1%
- Active inventory
- 44
- Price-to-rent
- 7.9×
Monthly cashflow live
- Estimated rent
- $1,787 medium interval (Pro) →
- Mortgage (P&I)
- −$891
- Tax from tax record
- −$147 /mo · $1,770/yr
- Insurance
- −$71
- HOA
- −$0
- Vacancy / Maint / Mgmt
- −$375
- Net cashflow
- $302
Break-even live
UW: 25.0% down · 7.5% · 30yr · 1.5% tax · 5.0% vac · 8.0% maint · 8.0% mgmt
Financing live
Cash to close
- Down payment
- $42,475
- Closing costs
- $5,097
- Reserves months
- —
- Total cash needed
- —
Loan-product check · same deal, 3 products live
Conventional
25% down · 7.5% · 30yr
- Down + closing
- —
- Monthly P&I
- —
- Monthly cashflow
- —
- DSCR
- —
- Eligible?
- —
Personal DTI + credit; lowest rate.
DSCR
20% down · 8.5% · 30yr
- Down + closing
- —
- Monthly P&I
- —
- Monthly cashflow
- —
- DSCR
- —
- Eligible?
- —
No personal income docs; deal must DSCR.
Hard money
10% down · 12.0% · 12mo
- Down + closing
- —
- Monthly P&I
- —
- Monthly cashflow
- —
- DSCR
- —
- Eligible?
- —
Short-term bridge; refi at stabilization.
Rent comps 4 comps
| Address | Beds | Baths | Sqft | Rent | $/sqft | DOM | Units | Dist |
|---|---|---|---|---|---|---|---|---|
| 118 Lemmon Ave Pemberton, NJ | 2.0 | 1.0 | 705 | $1,700 | $2.41 | 1d | 1 | 0.25mi |
| 219 Kinsley Rd Pemberton, NJ | 2.0 | 1.0 | 690 | $2,000 | $2.90 | 1d | 1 | 0.30mi |
| 224 Swarthmore Ct Pemberton, NJ | 1.0–2.0 | 1.0 | 750 | $1,300 | $1.73 | 1d | 2 | 1.11mi |
| 198 W Hampton St Pemberton, NJ | 2.0 | 1.0 | 750 | $1,838 | $2.45 | 1d | 2 | 1.28mi |
Listing history 19 events
-
2026-06-18days on market $169,900 Active 44 DOM
-
2026-06-17days on market $169,900 Active 43 DOM
-
2026-06-16days on market $169,900 Active 42 DOM
-
2026-06-15days on market $169,900 Active 41 DOM
-
2026-06-13days on market $169,900 Active 39 DOM
-
2026-06-13days on market $169,900 Active 38 DOM
-
2026-06-09days on market $169,900 Active 35 DOM
-
2026-06-08days on market $169,900 Active 34 DOM
-
2026-06-07days on market $169,900 Active 33 DOM
-
2026-06-04days on market $169,900 Active 30 DOM
-
2026-06-03days on market $169,900 Active 29 DOM
-
2026-06-02days on market $169,900 Active 28 DOM
-
2026-06-02price $169,900 Active 27 DOM
-
2026-06-01days on market $174,900 Active 27 DOM
-
2026-05-31days on market $174,900 Active 26 DOM
-
2026-05-05$174,900 Active 1261-char remark
-
2026-03-09historical
-
2026-02-02$145,000 Active
-
1987-06-17soldstatus $18,000
ⓘ Source: listings_history table (triggers on properties + properties_extension) + one-shot
backfill from property_details.listing_events for pre-trigger history.
Tax reassessment forecast NJ · Partial reset (capped growth)
- Current annual tax
- $1,770 · $147/mo
- Projected year-2 tax
- $3,000 · $250/mo
- Expected delta
- +$1,230/yr (+$103/mo · 69.5%)
ⓘ Screening estimate from a state-policy table — verify with the county assessor before closing.
Climate risk First Street
- Flood 4/10 Moderate FEMA zone X (unshaded) · 22% chance over 30 yrs
- Wildfire 3/10 Moderate
- Heat 6/10 Major 7 d/yr ≥103°F today · 15 d/yr by 30 yrs out
- Wind 6/10 Major 56% chance of damaging wind over 30 yrs
- Air quality 4/10 Moderate 5 unhealthy d/yr today · 7 by 30 yrs out
Nearby sold comps map
Loading sold comps map…
Walkable amenities ~0.75 mi
Loading nearby amenities…
Taxation est. · year 1
- Rental income
- $21,443
- − Mortgage interest
- −$9,517
- − Property taxes
- −$1,770
- − Insurance
- −$850
- − Repairs & maintenance
- −$1,715
- − Management
- −$1,715
- − Depreciation
- −$4,943
- Taxable income
- $933
- Est. tax owed @ 24.0%
- −$224
- After-tax cash flow
- $3,405/yr
For passive investors: Depreciation is non-cash, so a rental often shows a tax loss while cash-flowing — sheltering income. Rental losses are passive: they offset passive income freely, and up to $25,000/yr can offset ordinary (W-2) income if you actively participate and your MAGI is under $100k (phasing out to $0 by $150k); unused losses carry forward. On sale, claimed depreciation is recaptured at up to 25%, and gains may owe capital-gains tax (a 1031 exchange can defer both). Figures are a year-1 estimate at your 24.0% rate — not tax advice; consult a CPA.
Schools (NCES district)
- District
- Pemberton Township School District
- NCES district ID
- 3412810
- Math proficiency
- 12% ▼ -14.00%
- Reading proficiency
- 38% ▼ -5.00%
- Median HH income
- $60,951
- Composite
- 23.0/100
- National rank
- #7979
- State rank
- #382 of 472 in NJ
Livability — Pemberton
- Score
- 72/100
- State rank
- #217
- US rank
- #6053
Category grades
Schools grade is shown separately in the Schools card above.
Census & demographics
- Population (ZIP)
- 6,811
Population outlook (Burlington County) Hauer SSP2
- Today (2025)
- 453,425 people
- By 2030
- 452,359 · -0.2%
- By 2040
- 445,033 · -1.9%
- By 2050
- 431,760 · -4.8%
- By 2075
- 406,277 · -10.4%
- By 2100
- 364,732 · -19.6%
Race, ethnicity, and origin ACS 2023
- Neighborhood character
- Diverse neighborhood (Simpson 0.66)
- Race & ethnicity
- White 51% Black 24% Hispanic / Latino 14% Two or more races 10% Asian 4%
- Hispanic origin (detail)
- Mexican 3% Puerto Rican 4% Dominican 2%
- Common ancestry
- Lithuanian 3% Romanian 3% Italian 2%
- Foreign-born
- 12% · Canada, South Korea, China
- Languages at home
- 82% English-only · Spanish 10% Tagalog/Filipino 2% French/Haitian/Cajun 1%
Political lean MEDSL · Burlington
- 2024 margin
- D (+16.6) · D 57.6% · R 41.0% · Other 1.3%
- 2008→2024 swing
- -2.0pp toward R · 2008: 18.6pp · 2024: 16.6pp
- All cycles
- 2024: D+16.6 2020: D+19.5 2016: D+14.8 2012: D+18.7 2008: D+18.6
Not yet ingested
- Civics
- —
Market trends
- HPI YoY
- ▼ -6.80%
- Current HPI
- 315.5986
- Rent YoY
- —
- Metro
- —
- State GDP YoY
- ▲ 2.05%
- F500 in state
- 34
Industry mix (Fortune 500 HQ in NJ)
| Industry | F500 HQs | Revenue |
|---|---|---|
| Consumer Goods | 3 | $31B |
|
||
| Pharmaceuticals | 2 | $153B |
|
||
| Technology | 2 | $21B |
|
||
| Insurance | 2 | $20B |
|
||
| Healthcare | 2 | $19B |
|
||
| Financial Services | 1 | $70B |
|
||
Price history
+843.9% since first listed5 events — show timeline
- 2026-06-01 Price Changed $169,900 BRIGHT MLS
- 2026-05-05 Listed $174,900 BRIGHT MLS
- 2026-03-09 Listing Removed — BRIGHT MLS
- 2026-02-02 Listed $145,000 BRIGHT MLS
- 1987-06-17 Sold (Public Records) $18,000 Public Records
Property tax history
+3.0%/yrLatest (2025): $1,770 · +6.1% YoY. Source: county tax records.
Cash-flow waterfall
monthlySold comps — $/sqft
last 12 mo · ≤1 miLoading sold comps…