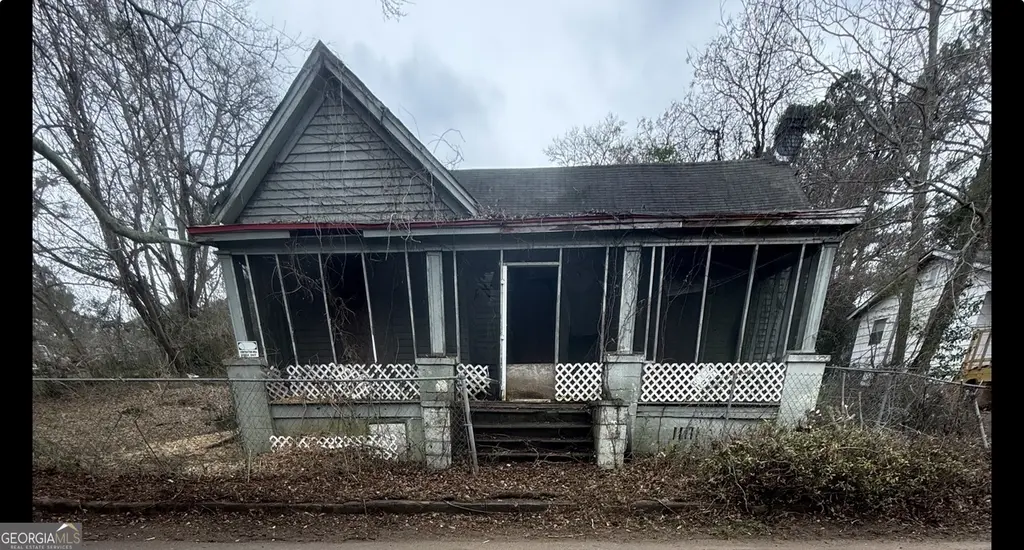
934 R D Hill St · Greenville, GA
Flood risk 1/10 · Minimal
- FEMA flood zone
- X (unshaded)
- Chance of flooding over 30 yrs
- 0.0%
- Est. flood insurance / yr
- $507 – $1,088
Fire risk 4/10 · Minor
- Est. fire insurance / yr
- $963 – $1,789
Heat risk 6/10 · Moderate
- Hot days now (above 106°F)
- 7 days/yr
- Hot days in 30 yrs
- 19 days/yr
Wind risk 6/10 · Moderate
- Chance of severe wind over 30 yrs
- 55.0%
Air-quality risk 2/10 · Minimal
- Unhealthy air days now
- 2 days/yr
- Unhealthy air days in 30 yrs
- 2 days/yr
Risk factors via First Street. Map © Google.
Why this score? — see what drove the B+ grade
The composite is a weighted blend of 9 inputs, each scored 0–100. Each bar is that input's sub-score; the figure is the points it added to the 100-point composite (weight × sub-score).
- Cash flow +30.0/30.0
- 1% rule +10.0/10.0
- DSCR +10.0/10.0
- Appreciation +10.0/10.0
- ARV discount +7.5/15.0
- Livability +3.1/5.0
- Rent growth +2.5/5.0
- Condition / age +2.5/5.0
- Schools +1.7/10.0
$49,500
🖨 Deal sheet 📄 Offer letter ✓ Due diligence
Listing remarks
Investor Opportunity in Growing Greenville, GA! Position yourself in an emerging small-town market where investors are continuing to find value. Located in Meriwether County, this property offers a prime opportunity for a renovation project or long-term investment in a community where revitalization and redevelopment are gaining momentum. Surrounded by properties that have seen strong renovation activity, the potential after-repair value in the area has reached the $250K+ range, making this an appealing opportunity for investors looking to add value. Conveniently located near downtown Greenville with access to local shops, dining, and community amenities. Whether you're looking for your
Key facts
- Cleared exterior
- Full renovation
- Investor opportunity
Tags
Neighborhood map
What this means for you Summary
Snapshot
- This is a 3-bed/1.0-bath single-family listed at $50k.
Deal economics
- At list price, monthly cash flow is $365 ($4k/yr) — positive.
- The deal already cash-flows at list — no discount required.
- Meets the 1% rule at list price ($849 rent vs $50k).
- Recommended offer: $45k (9.0% below list) — sets the bar for market timing.
Location & tenants
- Location reads 62/100 on livability (#318 in GA) — a middle-class / working-renter tenant base. Strengths: cost of living A+, housing A+, crime A; Watch: schools F, amenities F, commute F.
- Meriwether County (rural): math 18% / reading 22% proficiency, ranked #144 of 174 in GA (top 83%) — low school quality limits family demand, transient renter base, plan for 1-2y turnover; 71% free/reduced lunch — lower-income household profile, screen leases tightly.
- Market conditions: 43 active listings in the ZIP; 1 comparable units currently listed for rent nearby; 180 units permitted in Meriwether County in 2024 (0 in 5+ unit buildings).
Forward outlook
- In year one you build about $5k of equity ($342 loan paydown + $5k appreciation (10.0% local appreciation)).
- Meriwether County population projected at -28% by 2050 — secular population decline; favor cash flow + early exit over multi-decade hold.
- At projected returns (10.0% appreciation + 3.0% rent growth), your $14k cash investment doubles in ~2 years — after that, you're playing with house money.
- By year 6, paydown + projected appreciation supports a ~$31k cash-out refi (75% LTV) — recoverable capital for the next deal without selling this one.
Negotiation context
- It's been on market 98 days — a 9% lower offer ($45k) is reasonable based on typical stale-listing flexibility.
- 5 sale attempts; this cycle's ask has dropped $6k (10%) from the opening price — seller is motivated, your offer sets the floor, not the list.
Risks & watch-outs
- Watch-outs: built in 1940 — expect roof / HVAC / electrical / plumbing capex.
- Climate carrying-cost: major wind risk, 55% chance of damaging wind over 30y; extreme-heat days projected 7→19/yr by 2055 (HVAC capex compounding) — expect insurance premiums to compound above CPI over the hold.
Questions for the listing agent
- It's been on market 98 days. Have you received any prior offers? Is the seller open to a 9% concession, seller financing, or rate buy-down credit?
- Built in 1940 — when were the roof, HVAC, electrical panel, plumbing, and water heater last replaced?
- Why hasn't it sold? Are there any deal-killer items the seller is aware of (foundation, flood, title, zoning, code violations)?
- Is there a deadline driving the sale (1031 exchange, divorce, estate, relocation)? That informs how much negotiation room exists.
- Schools are F-rated, which usually means shorter tenancies and higher turnover. Who's the typical renter profile here, and what's been the actual vacancy rate?
- What's the average days-on-market for RENTAL listings here right now (not sales)? A rising rental-DOM trend means longer vacancies and softer asking-rent achievability than the comps imply.
- What's the recent tenant-quality profile in this submarket — average credit score on applications, eviction rate, late-payment / NSF rate, and stable-employment percentage? A property-management company in the area should have these aggregated.
- How much new for-sale + rental construction is in the pipeline within 1–3 miles? Heavy new supply typically softens prices + rents 12–24 months out; constrained supply supports both.
Investment metrics
- 1% rule
- 1.72% ✓
- Cap rate
- 15.15%
- Cash-on-cash
- 31.63%
- DSCR
- 2.41
- GRM
- 4.9
CMA / ARV
- ARV (median comp)
- $152,084
- List price
- $49,500
- Delta
- -67.45%
- Verdict
- UNDERPRICED
- Comps
- 11 within 1.0 mi
Show comp detail 1 sale within ~0.75 mi
| Address | Dist | Beds/Ba | Sqft | Sold | Price | $/sf | Match |
|---|---|---|---|---|---|---|---|
| 8008 College St | 0.54mi | 2/2.0 (-1) | 1,248 (-12%) | 12mo | $152,000 | $122 | 36 |
Match score weights: distance 35% · size 25% · config 20% · recency 20%. Top-matched comps best support the ARV.
Projected returns pro-forma
10.0% appreciation · 3.0% rent growth · sell at horizon
- IRR
- 48.4%
- Equity multiple
- 4.62×
- Total profit
- $50,219
- Equity at exit
- $44,594
- IRR
- 42.2%
- Equity multiple
- 10.35×
- Total profit
- $129,567
- Equity at exit
- $96,168
Cash invested: $13,860 (down + closing). Projections, not guarantees.
Landlord ↔ Tenant lean methodology
- Overall (STATE)
- 90 Strongly Landlord-Friendly
- State Georgia
- 90 Strongly Landlord-Friendly · R+3
- County
- — inherits STATE
- City
- — inherits STATE
ZIP-level market 30222
- Home prices YoY
- 35.0%
- Active inventory
- 43
- Price-to-rent
- 4.9×
Monthly cashflow live
- Estimated rent
- $849 medium interval (Pro) →
- Mortgage (P&I)
- −$260
- Tax from tax record
- −$25 /mo · $302/yr
- Insurance
- −$21
- HOA
- −$0
- Vacancy / Maint / Mgmt
- −$178
- Net cashflow
- $365
Break-even live
UW: 25.0% down · 7.5% · 30yr · 1.5% tax · 5.0% vac · 8.0% maint · 8.0% mgmt
Financing live
Cash to close
- Down payment
- $12,375
- Closing costs
- $1,485
- Reserves months
- —
- Total cash needed
- —
Loan-product check · same deal, 3 products live
Conventional
25% down · 7.5% · 30yr
- Down + closing
- —
- Monthly P&I
- —
- Monthly cashflow
- —
- DSCR
- —
- Eligible?
- —
Personal DTI + credit; lowest rate.
DSCR
20% down · 8.5% · 30yr
- Down + closing
- —
- Monthly P&I
- —
- Monthly cashflow
- —
- DSCR
- —
- Eligible?
- —
No personal income docs; deal must DSCR.
Hard money
10% down · 12.0% · 12mo
- Down + closing
- —
- Monthly P&I
- —
- Monthly cashflow
- —
- DSCR
- —
- Eligible?
- —
Short-term bridge; refi at stabilization.
Rent comps 1 comps
| Address | Beds | Baths | Sqft | Rent | $/sqft | DOM | Units | Dist |
|---|---|---|---|---|---|---|---|---|
| 738 N Depot St Greenville, GA | 2.0–3.0 | 2.0 | 1262 | $849 | $0.67 | 43d | 1 | 0.86mi |
Listing history 28 events
-
2026-06-19days on market $49,500 Active 98 DOM
-
2026-06-18days on market $49,500 Active 97 DOM
-
2026-06-17days on market $49,500 Active 96 DOM
-
2026-06-16days on market $49,500 Active 95 DOM
-
2026-06-15days on market $49,500 Active 94 DOM
-
2026-06-14days on market $49,500 Active 92 DOM
-
2026-06-12days on market $49,500 Active 91 DOM
-
2026-06-09days on market $49,500 Active 88 DOM
-
2026-06-08days on market $49,500 Active 87 DOM
-
2026-06-07days on market $49,500 Active 86 DOM
-
2026-06-05days on market $49,500 Active 83 DOM
-
2026-06-03days on market $49,500 Active 82 DOM
-
2026-06-02days on market $49,500 Active 81 DOM
-
2026-06-01days on market $49,500 Active 80 DOM
-
2026-05-31days on market $49,500 Active 79 DOM
-
2026-05-30days on market $49,500 Active 78 DOM
-
2026-03-13historical
-
2026-02-16historical
-
2025-09-13$49,500 New
-
2025-09-13$49,500 New
-
2025-09-13$55,000 New
-
2025-08-07historical
-
2025-08-07historical
-
2025-05-28price $55,000
-
2025-05-28price $55,000
-
2025-02-17$61,000 New
-
2025-02-17$61,000 Active
-
2025-02-17historical
ⓘ Source: listings_history table (triggers on properties + properties_extension) + one-shot
backfill from property_details.listing_events for pre-trigger history.
Tax reassessment forecast GA · Resets to sale price
- Current annual tax
- $302 · $25/mo
- Projected year-2 tax
- $455 · $38/mo
- Expected delta
- +$154/yr (+$13/mo · 50.9%)
ⓘ Screening estimate from a state-policy table — verify with the county assessor before closing.
Climate risk First Street
- Flood 1/10 Low FEMA zone X (unshaded) · 0% chance over 30 yrs
- Wildfire 4/10 Moderate
- Heat 6/10 Major 7 d/yr ≥106°F today · 19 d/yr by 30 yrs out
- Wind 6/10 Major 55% chance of damaging wind over 30 yrs
- Air quality 2/10 Low 2 unhealthy d/yr today · 2 by 30 yrs out
Nearby sold comps map
Loading sold comps map…
Walkable amenities ~0.75 mi
Loading nearby amenities…
Taxation est. · year 1
- Rental income
- $10,188
- − Mortgage interest
- −$2,773
- − Property taxes
- −$302
- − Insurance
- −$248
- − Repairs & maintenance
- −$815
- − Management
- −$815
- − Depreciation
- −$1,440
- Taxable income
- $3,796
- Est. tax owed @ 24.0%
- −$911
- After-tax cash flow
- $3,473/yr
For passive investors: Depreciation is non-cash, so a rental often shows a tax loss while cash-flowing — sheltering income. Rental losses are passive: they offset passive income freely, and up to $25,000/yr can offset ordinary (W-2) income if you actively participate and your MAGI is under $100k (phasing out to $0 by $150k); unused losses carry forward. On sale, claimed depreciation is recaptured at up to 25%, and gains may owe capital-gains tax (a 1031 exchange can defer both). Figures are a year-1 estimate at your 24.0% rate — not tax advice; consult a CPA.
Schools (NCES district)
- District
- Meriwether County
- NCES district ID
- 1303630
- Math proficiency
- 18% ▼ -11.00%
- Reading proficiency
- 22% ▼ -6.00%
- Median HH income
- $36,287
- Composite
- 16.59/100
- National rank
- #9175
- State rank
- #144 of 174 in GA
Livability — Greenville
- Score
- 62/100
- State rank
- #318
- US rank
- #17072
Category grades
Schools grade is shown separately in the Schools card above.
Census & demographics
- Census place
- Greenville, GA
- Population (ZIP)
- 4,219
Population outlook (Meriwether County) Hauer SSP2
- Today (2025)
- 19,554 people
- By 2030
- 18,482 · -5.5%
- By 2040
- 16,204 · -17.1%
- By 2050
- 14,030 · -28.2%
- By 2075
- 9,539 · -51.2%
- By 2100
- 6,136 · -68.6%
Race, ethnicity, and origin ACS 2023
- Neighborhood character
- Majority White (52%)
- Race & ethnicity
- White 52% Black 44% Two or more races 2%
- Common ancestry
- Italian 13% Russian 1% Slovak 1%
- Foreign-born
- 1% · Canada
- Languages at home
- 99% English-only · Spanish 1%
Political lean MEDSL · Meriwether
- 2024 margin
- Strong R (+25.5) · D 37.1% · R 62.6%
- 2008→2024 swing
- -20.0pp toward R · 2008: -5.4pp · 2024: -25.5pp
- All cycles
- 2024: R+25.5 2020: R+20.6 2016: R+15.4 2012: R+5.7 2008: R+5.4
Not yet ingested
- Civics
- —
Market trends
- HPI YoY
- ▲ 110.39%
- Current HPI
- 426.1094
- Rent YoY
- —
- Metro
- —
- State GDP YoY
- ▲ 2.66%
- F500 in state
- 28
Industry mix (Fortune 500 HQ in GA)
| Industry | F500 HQs | Revenue |
|---|---|---|
| Paper / Packaging | 2 | $29B |
|
||
| Retail | 1 | $160B |
|
||
| Transportation / Logistics | 1 | $91B |
|
||
| Airlines | 1 | $62B |
|
||
| Consumer Goods | 1 | $47B |
|
||
| Utilities | 1 | $25B |
|
||
Price history
-9.8% since first listed12 events — show timeline
- 2026-03-13 Listing Removed — GAMLS
- 2026-02-16 Listing Removed — GAMLS
- 2025-09-13 Listed $55,000 GAMLS
- 2025-09-13 Listed $49,500 GAMLS
- 2025-09-13 Listed $49,500 GAMLS
- 2025-08-07 Listing Removed — FMLS
- 2025-08-07 Listing Removed — GAMLS
- 2025-05-28 Price Changed $55,000 FMLS
- 2025-05-28 Price Changed $55,000 GAMLS
- 2025-02-17 Listed $61,000 GAMLS
- 2025-02-17 Listed $61,000 FMLS
- 2025-02-17 Coming Soon — FMLS
Property tax history
-0.5%/yrLatest (2025): $302 · +2.2% YoY. Source: county tax records.
Cash-flow waterfall
monthlySold comps — $/sqft
last 12 mo · ≤1 miLoading sold comps…