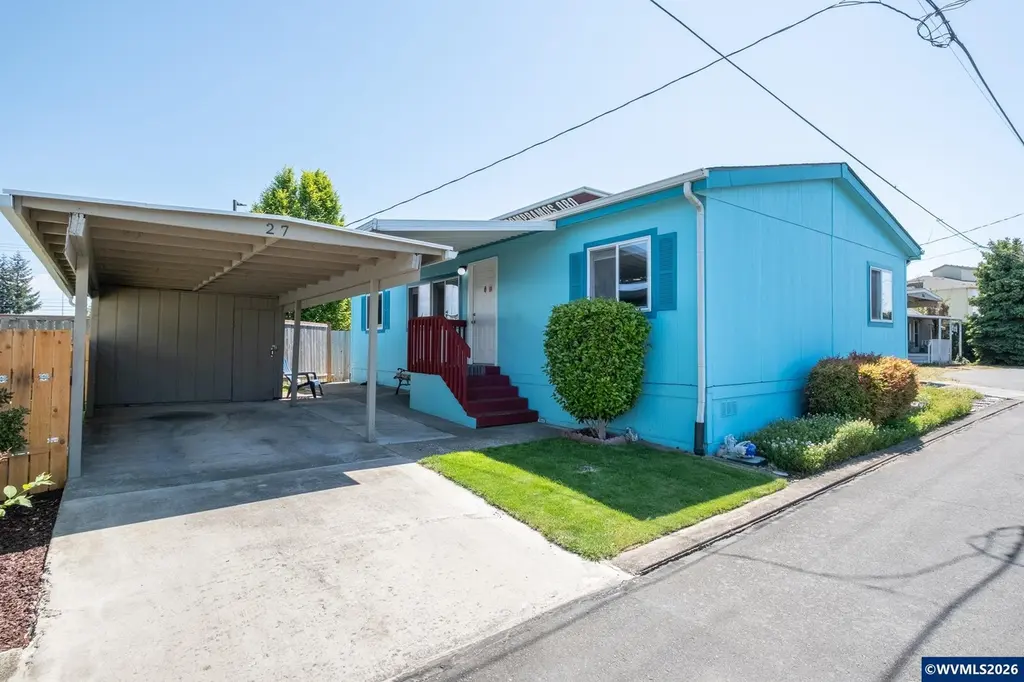
3346 Sunnyview Rd NE #27 · Salem, OR
Flood risk 4/10 · Minor
- FEMA flood zone
- X (unshaded)
- Chance of flooding over 30 yrs
- 0.13%
- Est. flood insurance / yr
- $507 – $1,088
Fire risk 1/10 · Minimal
- Est. fire insurance / yr
- $498 – $926
Heat risk 3/10 · Minor
- Hot days now (above 92°F)
- 7 days/yr
- Hot days in 30 yrs
- 14 days/yr
Wind risk 1/10 · Minimal
- Chance of severe wind over 30 yrs
- —
Air-quality risk 10/10 · Severe
- Unhealthy air days now
- 13 days/yr
- Unhealthy air days in 30 yrs
- 14 days/yr
Risk factors via First Street. Map © Google.
Why this score? — see what drove the C+ grade
The composite is a weighted blend of 9 inputs, each scored 0–100. Each bar is that input's sub-score; the figure is the points it added to the 100-point composite (weight × sub-score).
- Cash flow +30.0/30.0
- DSCR +10.0/10.0
- 1% rule +8.4/10.0
- Livability +4.0/5.0
- Schools +3.7/10.0
- Condition / age +2.5/5.0
- Rent growth +2.3/5.0
- ARV discount +0.0/15.0
- Appreciation +0.0/10.0
$115,000
🖨 Deal sheet (PDF) 📄 Offer letter ✓ Due diligence
Listing remarks MLS
Nice 55 and older park centrally located in Salem. Close to shopping, freeway and more. Nice layout with an open concept. Feels much bigger than the SF! Easy low maintenance landscaping and near the back of a dead end.
Key facts
- New heat pump
- Shed
- Carport
Tags
Property features AI
Finance
- Other: Park make/model: Fleetwood Berkshire; Serial number: ORFLX48A2691
- HOA & community: Small 55+ park; Park rent reported as $691/month and includes water and sewer
Exterior
- Parking: Carport; Detached 1-car garage space (1 garage space listed)
- Utilities: City water; City sewer; Electric water heater; Park rent includes garbage and sewer
- Home design: Double-wide mobile home; Adult park (55+); Located in Roseland Park; Turquoise exterior color; Entry and main living areas on main level
- Construction: Built in 1999; Wood siding (T111); Composition shingle roof; Newer roof on home with transferable warranty; New carport roof (2024)
- Exterior features: Partial fenced yard; Covered deck (new Trex); Landscaped; Shed outbuilding; Bench (on property)
Interior
- Kitchen: Range (electric) included; Dishwasher included; Osmosis under-sink water filter
- Bedrooms: Master bedroom on the main level; Second bedroom on the main level; Third bedroom on the main level
- Flooring: Carpet; Vinyl
- Bathrooms: Includes walk-in shower
- Heating & cooling: Electric heating; Heat pump (new, transferable warranty); Central air; Forced air
- Interior features: Open concept with bright sunlight; Dining area (combination); Walk-in shower; Window coverings included
- Laundry & utility: Washer and dryer included; Utility room on the main level
Neighborhood map
What this means for you Summary
Snapshot
- This is a 3-bed/2.0-bath manufactured listed at $115k.
Deal economics
- At list price, monthly cash flow is $503 ($6k/yr) — positive.
- The deal already cash-flows at list — no discount required.
- Meets the 1% rule at list price ($2k rent vs $115k).
- Recommended offer: $112k (3.0% below list) — sets the bar for market timing.
- Cap rate 11.5% vs local median 2.9% in Salem — top-decile yield for the area; either an underpriced asset or a hidden risk that comps aren't pricing in. Stress-test before assuming the spread holds.
Location & tenants
- Location reads 79/100 on livability (#59 in OR, #2,084 nationally) — a middle-class / working-renter tenant base. Strengths: amenities A+, commute A+, housing A+; Watch: schools D, crime F.
- Salem-Keizer SD 24J (urban): math 34% / reading 47% proficiency, ranked #103 of 183 in OR (top 56%) — families likely to look elsewhere, expect single-tenant / working-renter base with shorter leases.
- Market conditions: Rents soft (-0.7%/yr); 280 active listings in the ZIP; 40 comparable units currently listed for rent nearby; rentals at typical pace (median 25d on market — plan ~3-4 weeks tenant-placement turnaround); 42% of comp listings sitting > 30 days — soft ceiling on asking rent; 1,591 units permitted in Marion County in 2024 (716 in 5+ unit buildings).
- This rent runs 31% of the median local income ($60k/yr) — at the standard rent-burdened threshold; future hikes will face affordability resistance.
Forward outlook
- Local home prices are declining (-3.0%/yr); year-one equity from $795 of loan paydown is wiped out by about $3k of value loss. Plan a longer hold.
- Marion County population projected at +17% by 2050 — long-run rental-demand tailwind backs the buy-and-hold thesis.
- At projected returns (-3.0% appreciation + 0.0% rent growth), your $32k cash investment doubles in ~9 years — after that, you're playing with house money.
Negotiation context
- It's been on market 51 days — a 3% lower offer ($112k) is reasonable based on typical stale-listing flexibility.
- 10 sale attempts since 22y ago with the ask held roughly flat each time — persistent listings suggest the price (not the market) is what's stuck; bring a comps-based counter.
- Current owner paid $40k; list at $115k implies a 188% gain — meaningful room to come down on a strong offer.
Questions for the listing agent
- It's been on market 51 days. Have you received any prior offers? Is the seller open to a 3% concession, seller financing, or rate buy-down credit?
- Is there a deadline driving the sale (1031 exchange, divorce, estate, relocation)? That informs how much negotiation room exists.
- Schools are D-rated, which usually means shorter tenancies and higher turnover. Who's the typical renter profile here, and what's been the actual vacancy rate?
- Crime grade is F in this area — have there been break-ins, vandalism, or insurance claims at this property in the last 3 years? What carrier currently insures it and at what premium?
- What's the average days-on-market for RENTAL listings here right now (not sales)? A rising rental-DOM trend means longer vacancies and softer asking-rent achievability than the comps imply.
- What's the recent tenant-quality profile in this submarket — average credit score on applications, eviction rate, late-payment / NSF rate, and stable-employment percentage? A property-management company in the area should have these aggregated.
- How much new for-sale + rental construction is in the pipeline within 1–3 miles? Heavy new supply typically softens prices + rents 12–24 months out; constrained supply supports both.
Investment metrics
- 1% rule
- 1.34% ✓
- Cap rate
- 11.54%
- Cash-on-cash
- 18.75%
- DSCR
- 1.83
- GRM
- 6.2
CMA / ARV
- ARV (median comp)
- $98,625
- List price
- $115,000
- Delta
- 16.60%
- Verdict
- OVERPRICED
- Comps
- 2 within 1.0 mi
Show comp detail 1 sale within ~0.75 mi
| Address | Dist | Beds/Ba | Sqft | Sold | Price | $/sf | Match |
|---|---|---|---|---|---|---|---|
| 3346 NE Sunnyview Rd #22 | 0.00mi | 3/2.0 | 1,020 (+2%) | 6mo | $80,000 | $78 | 92 |
Match score weights: distance 35% · size 25% · config 20% · recency 20%. Top-matched comps best support the ARV.
Projected returns pro-forma
-3.0% appreciation · 0.0% rent growth · sell at horizon
- IRR
- 7.3%
- Equity multiple
- 1.28×
- Total profit
- $8,868
- Equity at exit
- $17,147
- IRR
- 14.0%
- Equity multiple
- 1.98×
- Total profit
- $31,425
- Equity at exit
- $9,943
Cash invested: $32,200 (down + closing). Projections, not guarantees.
Landlord ↔ Tenant lean methodology
- Overall (STATE)
- 28 Tenant-Leaning
- State Oregon
- 28 Tenant-Leaning · D+6
- County
- — inherits STATE
- City
- — inherits STATE
ZIP-level market 97301
- Rents YoY
- -0.7%
- Active inventory
- 280
- Price-to-rent
- 6.2×
Monthly cashflow live
- Estimated rent
- $1,541 high interval (Pro) →
- Mortgage (P&I)
- −$603
- Tax from tax record
- −$63 /mo · $760/yr
- Insurance
- −$48
- HOA
- −$0
- Vacancy / Maint / Mgmt
- −$324
- Net cashflow
- $503
Break-even live
Sensitivity live
| Price | -10% $568 | -5% $536 | +0% $503 | +5% $471 | +10% $438 |
|---|---|---|---|---|---|
| Rent | -10% $381 | -5% $442 | +0% $503 | +5% $564 | +10% $625 |
| Rate | -1.0pp $561 | -0.5pp $532 | base $503 | +0.5pp $473 | +1.0pp $443 |
UW: 25.0% down · 7.5% · 30yr · 1.5% tax · 5.0% vac · 8.0% maint · 8.0% mgmt
Financing live
Cash to close
- Down payment
- $28,750
- Closing costs
- $3,450
- Reserves months
- —
- Total cash needed
- —
Loan-product check · same deal, 3 products live
Conventional
25% down · 7.5% · 30yr
- Down + closing
- —
- Monthly P&I
- —
- Monthly cashflow
- —
- DSCR
- —
- Eligible?
- —
Personal DTI + credit; lowest rate.
DSCR
20% down · 8.5% · 30yr
- Down + closing
- —
- Monthly P&I
- —
- Monthly cashflow
- —
- DSCR
- —
- Eligible?
- —
No personal income docs; deal must DSCR.
Hard money
10% down · 12.0% · 12mo
- Down + closing
- —
- Monthly P&I
- —
- Monthly cashflow
- —
- DSCR
- —
- Eligible?
- —
Short-term bridge; refi at stabilization.
Rent comps 40 comps
| Address | Beds | Baths | Sqft | Rent | $/sqft | DOM | Units | Dist |
|---|---|---|---|---|---|---|---|---|
| 2015 Debbie Way NE Unit 2045 Salem, OR | 3.0 | 1.0 | 1008 | $1,825 | $1.81 | 15d | 1 | 0.10mi |
| 1897 32nd Pl NE Salem, OR | 2.0 | 1.0 | 800 | $1,450 | $1.81 | 45d | 1 | 0.15mi |
| 1899 32nd Pl NE Unit 1885 Salem, OR | 2.0 | 1.0 | 800 | $1,450 | $1.81 | 45d | 1 | 0.15mi |
| 3864 Sunnyview Rd NE Salem, OR | 2.0 | 1.0 | 835 | $1,135 | $1.36 | 15d | 7 | 0.29mi |
| 3910-3930 Sunnyview Rd NE Salem, OR | 3.0 | 2.5 | 1300 | $1,845 | $1.42 | 15d | 6 | 0.33mi |
| 2489 Coral Ave NE Salem, OR | 1.0–2.0 | 1.0 | 817 | $1,301 | $1.59 | 15d | 11 | 0.42mi |
| 1738 Park Ave NE Unit 1738 Salem, OR | 2.0 | 1.0 | 850 | $995 | $1.17 | 45d | 1 | 0.44mi |
| 1744 Park Ave NE Unit 1744 Salem, OR | 2.0 | 1.0 | 850 | $995 | $1.17 | 45d | 1 | 0.45mi |
| 3420 Monarch Dr NE Unit 3422 Salem, OR | 2.0 | 1.0 | 910 | $1,250 | $1.37 | 15d | 1 | 0.45mi |
| 1729 Park Ave NE Unit 1761 Salem, OR | 2.0 | 1.0 | 769 | $1,295 | $1.68 | 45d | 1 | 0.47mi |
| 1592 Park Ave NE Salem, OR | 2.0 | 1.0 | 895 | $1,390 | $1.55 | 15d | 2 | 0.49mi |
| 1415 Lancaster Dr NE Unit 21 Salem, OR | 2.0 | 1.0 | 850 | $1,225 | $1.44 | 15d | 1 | 0.50mi |
| 1415 Lancaster Dr NE Unit 18 Salem, OR | 2.0 | 1.0 | 850 | $1,200 | $1.41 | 45d | 1 | 0.53mi |
| 1415 Lancaster Dr NE Unit 16 Salem, OR | 2.0 | 1.0 | 850 | $1,250 | $1.47 | 45d | 1 | 0.53mi |
| 1415 Lancaster Dr NE Unit 33 Salem, OR | 2.0 | 1.0 | 850 | $1,225 | $1.44 | 45d | 1 | 0.53mi |
| 2915 Jensen St NE Salem, OR | 2.0 | 1.0 | 804 | $1,450 | $1.80 | 15d | 1 | 0.54mi |
| 4154 Sunnyview Rd NE Salem, OR | 1.0–2.0 | 1.0 | 806 | $1,375 | $1.71 | 15d | 6 | 0.55mi |
| 4098 Market St NE Unit MT21 Salem, OR | 2.0 | 1.0 | 900 | $1,275 | $1.42 | 24d | 1 | 0.59mi |
| 1725 Evergreen Ave NE Unit 1727 Salem, OR | 2.0 | 2.0 | 910 | $1,228 | $1.35 | 45d | 1 | 0.59mi |
| 4116 Market St NE Salem, OR | 2.0 | 1.0 | 858 | $1,350 | $1.57 | 15d | 1 | 0.61mi |
| 4116 Market St NE Salem, OR | 2.0 | 1.0 | 858 | $1,350 | $1.57 | 45d | 1 | 0.61mi |
| 3695 D St NE Salem, OR | 1.0–2.0 | 1.0–2.0 | 1037 | $1,650 | $1.59 | 45d | 3 | 0.61mi |
| 3301 D St NE Salem, OR | 2.0 | 1.0 | 850 | $1,225 | $1.44 | 24d | 4 | 0.61mi |
| 3739 Beverly Ave NE Salem, OR | 2.0 | 1.0 | 838 | $1,275 | $1.52 | 22d | 2 | 0.62mi |
| 3370 Beacon Ct NE Salem, OR | 3.0 | 1.0 | 936 | $2,100 | $2.24 | 45d | 1 | 0.63mi |
| 2500 Lancaster Dr NE Unit 35 Salem, OR | 2.0 | 1.0 | 890 | $1,295 | $1.46 | 45d | 1 | 0.63mi |
| 2500 Lancaster Dr NE Salem, OR | 1.0–2.0 | 1.0 | 771 | $1,350 | $1.75 | 15d | 11 | 0.64mi |
| 4200 Sunnyview Rd NE Salem, OR | 2.0 | 1.0–2.0 | 880 | $1,445 | $1.64 | 24d | 1 | 0.66mi |
| 1003-1085 Savage Rd NE Unit 1053 Salem, OR | 2.0 | 1.0 | 950 | $1,095 | $1.15 | 24d | 1 | 0.67mi |
| 990 Charter Pl NE Salem, OR | 3.0 | 2.5 | 1248 | $1,895 | $1.52 | 45d | 1 | 0.68mi |
| 3071 D St NE Salem, OR | 2.0 | 1.5 | 890 | $1,195 | $1.34 | 15d | 1 | 0.69mi |
| 3071 D St NE Unit 3097 Salem, OR | 2.0 | 1.5 | 890 | $1,195 | $1.34 | 24d | 1 | 0.69mi |
| 3017 Alameda St NE Salem, OR | 4.0 | 2.0 | 1350 | $2,395 | $1.77 | 45d | 1 | 0.70mi |
| 2800 Fisher Rd NE Salem, OR | 2.0 | 1.0 | 856 | $1,270 | $1.48 | 22d | 2 | 0.70mi |
| 793 Hawthorne Ave NE Unit 837 Salem, OR | 2.0 | 1.0 | 750 | $1,125 | $1.50 | 15d | 1 | 0.83mi |
| 793 Hawthorne Ave NE Unit 803 Salem, OR | 2.0 | 1.0 | 750 | $1,225 | $1.63 | 15d | 1 | 0.83mi |
| 909 Park Ave NE Salem, OR | 1.0–3.0 | 1.0–2.0 | 942 | $1,800 | $1.91 | 15d | 28 | 0.86mi |
| 2773 Basalt Ct NE Salem, OR | 3.0 | 2.0 | 1305 | $2,800 | $2.15 | 45d | 1 | 0.87mi |
| 721-759 Hawthorne Ave NE Unit 733 Salem, OR | 2.0 | 1.0 | 712 | $995 | $1.40 | 45d | 1 | 0.88mi |
| 1973 45th Ave NE Salem, OR | 2.0 | 1.0–2.0 | 1043 | $1,360 | $1.30 | 15d | 2 | 0.90mi |
Listing history 48 events
-
2026-06-21days on market $115,000 Active 51 DOM
-
2026-06-18days on market $115,000 Active 48 DOM
-
2026-06-17days on market $115,000 Active 47 DOM
-
2026-06-16days on market $115,000 Active 46 DOM
-
2026-06-15days on market $115,000 Active 45 DOM
-
2026-06-14pricedays on market $115,000 Active 43 DOM
-
2026-06-10days on market $120,000 Active 40 DOM
-
2026-06-09days on market $120,000 Active 39 DOM
-
2026-06-08days on market $120,000 Active 38 DOM
-
2026-06-07days on market $120,000 Active 37 DOM
-
2026-06-03days on market $120,000 Active 33 DOM
-
2026-06-02days on market $120,000 Active 32 DOM
-
2026-06-01days on market $120,000 Active 31 DOM
-
2026-05-31days on market $120,000 Active 30 DOM
-
2026-05-30days on market $120,000 Active 29 DOM
-
2026-05-01$120,000 Active 520-char remark
-
2026-01-07historical
-
2025-12-17historical Active under Contract
-
2025-09-12price $110,000
-
2025-05-29price $115,000
-
2025-05-23price $119,000
-
2025-05-05$120,000 Active
-
2019-12-13soldstatus $40,000 Sold
Show marketing remark (221 chars)
Nice 55 and older park centrally located in Salem. Close to shopping, freeway and more. Nice layout with an open concept. Feels much bigger than the SF! Easy low maintenance landscaping and near the back of a dead end.
-
2019-11-15historical Active under Contract
Show marketing remark (221 chars)
Nice 55 and older park centrally located in Salem. Close to shopping, freeway and more. Nice layout with an open concept. Feels much bigger than the SF! Easy low maintenance landscaping and near the back of a dead end.
-
2019-11-08price $45,900
Show marketing remark (221 chars)
Nice 55 and older park centrally located in Salem. Close to shopping, freeway and more. Nice layout with an open concept. Feels much bigger than the SF! Easy low maintenance landscaping and near the back of a dead end.
-
2019-11-07status Active
Show marketing remark (221 chars)
Nice 55 and older park centrally located in Salem. Close to shopping, freeway and more. Nice layout with an open concept. Feels much bigger than the SF! Easy low maintenance landscaping and near the back of a dead end.
-
2019-10-29historical Active under Contract
Show marketing remark (221 chars)
Nice 55 and older park centrally located in Salem. Close to shopping, freeway and more. Nice layout with an open concept. Feels much bigger than the SF! Easy low maintenance landscaping and near the back of a dead end.
-
2019-10-19price $46,400
Show marketing remark (221 chars)
Nice 55 and older park centrally located in Salem. Close to shopping, freeway and more. Nice layout with an open concept. Feels much bigger than the SF! Easy low maintenance landscaping and near the back of a dead end.
-
2019-10-04price $46,900
Show marketing remark (221 chars)
Nice 55 and older park centrally located in Salem. Close to shopping, freeway and more. Nice layout with an open concept. Feels much bigger than the SF! Easy low maintenance landscaping and near the back of a dead end.
-
2019-09-25price $48,900
Show marketing remark (221 chars)
Nice 55 and older park centrally located in Salem. Close to shopping, freeway and more. Nice layout with an open concept. Feels much bigger than the SF! Easy low maintenance landscaping and near the back of a dead end.
-
2019-09-05$49,900 Active
Show marketing remark (221 chars)
Nice 55 and older park centrally located in Salem. Close to shopping, freeway and more. Nice layout with an open concept. Feels much bigger than the SF! Easy low maintenance landscaping and near the back of a dead end.
-
2016-11-10soldstatus $28,900 Sold
-
2016-11-10soldstatus $28,900 Sold
-
2016-09-28historical Active under Contract
-
2016-09-28status Pending
-
2016-09-12price $29,900
-
2016-09-08price $29,900
-
2016-08-30price $28,000
-
2016-08-29$28,000 Active
-
2016-08-18status Active
-
2016-08-15historical Active under Contract
-
2016-06-03$29,900 Active
-
2014-10-17soldstatus $21,700 Sold
-
2014-09-26historical
-
2014-09-25$23,000 Active
-
2014-09-25$23,000 Active
-
2012-01-13historical
-
2004-05-20$25,950
ⓘ Source: listings_history table (triggers on properties + properties_extension) + one-shot
backfill from property_details.listing_events for pre-trigger history.
Tax reassessment forecast OR · Resets to sale price
- Current annual tax
- $760 · $63/mo
- Projected year-2 tax
- $1,116 · $93/mo
- Expected delta
- +$355/yr (+$30/mo · 46.8%)
ⓘ Screening estimate from a state-policy table — verify with the county assessor before closing.
Climate risk First Street
- Flood 4/10 Moderate FEMA zone X (unshaded) · 13% chance over 30 yrs
- Wildfire 1/10 Low
- Heat 3/10 Moderate 7 d/yr ≥92°F today · 14 d/yr by 30 yrs out
- Wind 1/10 Low
- Air quality 10/10 Extreme 13 unhealthy d/yr today · 14 by 30 yrs out
Nearby sold comps map
Loading sold comps map…
Walkable amenities ~0.75 mi
Loading nearby amenities…
Taxation est. · year 1
- Rental income
- $18,493
- − Mortgage interest
- −$6,442
- − Property taxes
- −$760
- − Insurance
- −$575
- − Repairs & maintenance
- −$1,479
- − Management
- −$1,479
- − Depreciation
- −$3,345
- Taxable income
- $4,412
- Est. tax owed @ 24.0%
- −$1,059
- After-tax cash flow
- $4,979/yr
For passive investors: Depreciation is non-cash, so a rental often shows a tax loss while cash-flowing — sheltering income. Rental losses are passive: they offset passive income freely, and up to $25,000/yr can offset ordinary (W-2) income if you actively participate and your MAGI is under $100k (phasing out to $0 by $150k); unused losses carry forward. On sale, claimed depreciation is recaptured at up to 25%, and gains may owe capital-gains tax (a 1031 exchange can defer both). Figures are a year-1 estimate at your 24.0% rate — not tax advice; consult a CPA.
Schools (NCES district)
- District
- Salem-Keizer SD 24J
- NCES district ID
- 4110820
- Math proficiency
- 34% ▼ -1.00%
- Reading proficiency
- 47% ▼ -2.00%
- Median HH income
- $48,632
- Composite
- 37.16/100
- National rank
- #9017
- State rank
- #103 of 183 in OR
Livability — Salem
- Score
- 79/100
- State rank
- #59
- US rank
- #2084
Category grades
Schools grade is shown separately in the Schools card above.
Census & demographics
- Census place
- Salem, OR
- County
- Marion County · 258,219 people
- City population
- 193,601
- Metro
- Salem, OR
- Population (ZIP)
- 57,574
- Household income
- $60,422
- Rent vs Own
- Severe rent burden
- 3089.0
Population outlook (Marion County) Hauer SSP2
- Today (2025)
- 360,940 people
- By 2030
- 375,178 · +3.9%
- By 2040
- 400,914 · +11.1%
- By 2050
- 422,187 · +17.0%
- By 2075
- 460,305 · +27.5%
- By 2100
- 464,025 · +28.6%
Race, ethnicity, and origin ACS 2023
- Neighborhood character
- Diverse neighborhood (Simpson 0.58)
- Race & ethnicity
- White 55% Hispanic / Latino 35% Two or more races 19% Asian 2% Black 2% Native American 1% Pacific Islander 1%
- Hispanic origin (detail)
- Mexican 31%
- Common ancestry
- Italian 4% Portuguese 2% Lithuanian 2%
- Foreign-born
- 17% · Canada, China, Philippines
- Languages at home
- 68% English-only · Spanish 27% Other Asian/Pacific 1% Russian/Polish/Slavic 1%
Political lean MEDSL · Marion
- 2024 margin
- Toss-up / Even · D 47.5% · R 49.5% · Other 3.0%
- 2008→2024 swing
- -4.2pp toward R · 2008: 2.2pp · 2024: -2.0pp
- All cycles
- 2024: R+2.0 2020: D+1.1 2016: R+5.0 2012: R+3.5 2008: D+2.2
Not yet ingested
- Civics
- —
Market trends
- HPI YoY
- ▼ -548.17%
- Current HPI
- 335.8199
- Rent YoY
- ▼ -0.70%
- Metro
- Salem, OR
- State GDP YoY
- ▲ 2.05%
- F500 in state
- 2
Industry mix (Fortune 500 HQ in OR)
| Industry | F500 HQs | Revenue |
|---|---|---|
| Consumer Goods | 1 | $51B |
|
||
Price history
+343.2% since first listed34 events — show timeline
- 2026-06-14 Price Changed $115,000 WVMLS
- 2026-05-01 Listed $120,000 WVMLS
- 2026-01-07 Listing Removed — WVMLS
- 2025-12-17 Contingent — WVMLS
- 2025-09-12 Price Changed $110,000 WVMLS
- 2025-05-29 Price Changed $115,000 WVMLS
- 2025-05-23 Price Changed $119,000 WVMLS
- 2025-05-05 Listed $120,000 WVMLS
- 2019-12-13 Sold (MLS) $40,000 WVMLS
- 2019-11-15 Contingent — WVMLS
- 2019-11-08 Price Changed $45,900 WVMLS
- 2019-11-07 Relisted — WVMLS
- 2019-10-29 Contingent — WVMLS
- 2019-10-19 Price Changed $46,400 WVMLS
- 2019-10-04 Price Changed $46,900 WVMLS
- 2019-09-25 Price Changed $48,900 WVMLS
- 2019-09-05 Listed $49,900 WVMLS
- 2016-11-10 Sold (MLS) $28,900 WVMLS
- 2016-11-10 Sold (MLS) $28,900 RMLS
- 2016-09-28 Contingent — WVMLS
- 2016-09-28 Pending — RMLS
- 2016-09-12 Price Changed $29,900 RMLS
- 2016-09-08 Price Changed $29,900 WVMLS
- 2016-08-30 Price Changed $28,000 WVMLS
- 2016-08-29 Listed $28,000 RMLS
- 2016-08-18 Relisted — WVMLS
- 2016-08-15 Contingent — WVMLS
- 2016-06-03 Listed $29,900 WVMLS
- 2014-10-17 Sold (MLS) $21,700 WVMLS
- 2014-09-26 Listing Removed — WVMLS
- 2014-09-25 Listed $23,000 WVMLS
- 2014-09-25 Listed $23,000 WVMLS
- 2012-01-13 Listing Removed — WVMLS
- 2004-05-20 Listed $25,950 WVMLS
Property tax history
+2.2%/yrLatest (2025): $760 · +7.7% YoY. Source: county tax records.
Cash-flow waterfall
monthlySold comps — $/sqft
last 12 mo · ≤1 miLoading sold comps…