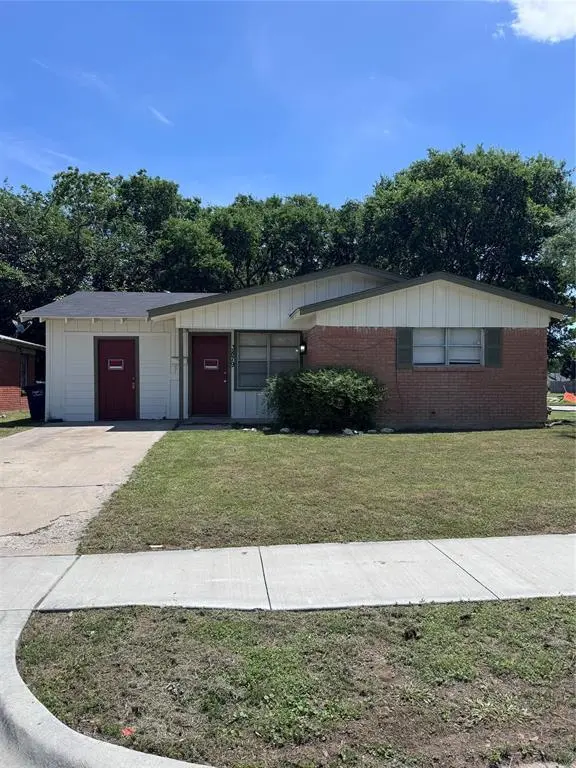
3879 Freddie St · Fort Worth, TX
Flood risk 1/10 · Minimal
- FEMA flood zone
- X (unshaded)
- Chance of flooding over 30 yrs
- 0.0%
- Est. flood insurance / yr
- $507 – $1,088
Fire risk 1/10 · Minimal
- Est. fire insurance / yr
- $1,222 – $2,270
Heat risk 7/10 · Major
- Hot days now (above 110°F)
- 7 days/yr
- Hot days in 30 yrs
- 23 days/yr
Wind risk 4/10 · Minor
- Chance of severe wind over 30 yrs
- 24.0%
Air-quality risk 3/10 · Minor
- Unhealthy air days now
- 3 days/yr
- Unhealthy air days in 30 yrs
- 4 days/yr
Risk factors via First Street. Map © Google.
Why this score? — see what drove the C+ grade
The composite is a weighted blend of 9 inputs, each scored 0–100. Each bar is that input's sub-score; the figure is the points it added to the 100-point composite (weight × sub-score).
- Cash flow +24.6/30.0
- ARV discount +15.0/15.0
- DSCR +7.9/10.0
- 1% rule +6.0/10.0
- Livability +4.0/5.0
- Condition / age +2.5/5.0
- Rent growth +2.1/5.0
- Schools +2.0/10.0
- Appreciation +0.0/10.0
$155,000
🖨 Deal sheet 📄 Offer letter ✓ Due diligence
Listing remarks
SHOWINGS START WITH OPEN HOUSE Sat. May 9. at 10am. This 3-bedroom, 1.5-bath home sits on a corner lot and offers a solid opportunity for a buyer looking for a property with potential. The home features a large living room area and a nice-sized eat-in kitchen. The garage has been converted into an additional living space, offering flexibility for a second living area, office, or hobby room. A full-size washer and dryer hookup is also included for added convenience. Several major updates have already been completed, including a water heater replaced in 2022, HVAC system updated in 2016, a new roof installed in 2024, and all-new electrical system completed in 2026. These improvements provide
Key facts
- Converted garage
- Corner lot
- Mature trees
Tags
Property features AI
Finance
- Other: Property is listed For Sale and currently Active Under Contract; Possession at closing/funding
- Financial info: Listing accepts Cash, Conventional, FHA, and VA financing; Special listing condition: Affordable Housing
- HOA & community: No association
Exterior
- Parking: Driveway; Converted garage; Additional parking
- Utilities: City water; City sewer; Electricity connected; Individual gas meter; Individual water meter; Curbs and sidewalks
- Home design: Single family residence; One story; Residential property
- Construction: Built in 1958; Brick construction; Composition roof
- Exterior features: Corner lot; Large backyard with grass; Chain link fencing
Interior
- Kitchen: Kitchen approximately 13 x 16; No appliances included
- Bedrooms: 3 bedrooms (all on the main level); Primary bedroom approximately 12 x 14 (main level); Other bedrooms approximately 12 x 12 and 12 x 13 (main level)
- Flooring: Carpet; Ceramic tile; Luxury vinyl plank
- Bathrooms: 1 full bathroom (main level); 1 half bathroom (main level)
- Heating & cooling: Central heating; Central air; Ceiling fans
- Interior features: 9 total rooms; 2 living areas; 1 dining area; Window coverings
- Laundry & utility: Full-size washer/dryer area
Neighborhood map
What this means for you Summary
Snapshot
- This is a 3-bed/2.0-bath single-family listed at $155k.
Deal economics
- At list price, monthly cash flow is $319 ($4k/yr) — positive.
- The deal already cash-flows at list — no discount required.
- Meets the 1% rule at list price ($2k rent vs $155k).
- Cap rate 8.8% vs local median 3.9% in Fort Worth — top-decile yield for the area; either an underpriced asset or a hidden risk that comps aren't pricing in. Stress-test before assuming the spread holds.
Location & tenants
- Location reads 80/100 on livability (#49 in TX, #1,954 nationally) — a professional / high-income tenant draw. Strengths: amenities A+, cost of living A+, housing A+; Watch: crime F.
- Fort Worth ISD (urban): math 18% / reading 28% proficiency, ranked #742 of 826 in TX (top 90%) — low school quality limits family demand, transient renter base, plan for 1-2y turnover; 73% free/reduced lunch — lower-income household profile, screen leases tightly.
- Zoned schools: Christene C Moss El (math 12% / reading 17%, grade F, #4,048 of 4,322 statewide, top 95%, 291 students, 99% FRL) — zoned schools average 99% FRL vs 73% district-wide (26 pts higher); higher-poverty schools than district average — tighter screening recommended.
- Market conditions: Rents soft (-1.6%/yr); 186 active listings in the ZIP; 16 comparable units currently listed for rent nearby; rentals at typical pace (median 25d on market — plan ~3-4 weeks tenant-placement turnaround); 18,938 units permitted in Tarrant County in 2024 (8,336 in 5+ unit buildings).
- This rent runs 40% of the median local income ($51k/yr) — at the standard rent-burdened threshold; future hikes will face affordability resistance.
Forward outlook
- Local home prices are declining (-3.0%/yr); year-one equity from $1k of loan paydown is wiped out by about $5k of value loss. Plan a longer hold.
- Tarrant County population projected at +41% by 2050 — long-run rental-demand tailwind backs the buy-and-hold thesis.
Negotiation context
- Only 13 days on market — expect competitive offers; lowballing is unlikely to land.
Risks & watch-outs
- Watch-outs: built in 1958 — expect roof / HVAC / electrical / plumbing capex.
- Climate carrying-cost: extreme-heat days projected 7→23/yr by 2055 (HVAC capex compounding) — expect insurance premiums to compound above CPI over the hold.
Questions for the listing agent
- Built in 1958 — when were the roof, HVAC, electrical panel, plumbing, and water heater last replaced?
- Is there a deadline driving the sale (1031 exchange, divorce, estate, relocation)? That informs how much negotiation room exists.
- Schools are D-rated, which usually means shorter tenancies and higher turnover. Who's the typical renter profile here, and what's been the actual vacancy rate?
- Crime grade is F in this area — have there been break-ins, vandalism, or insurance claims at this property in the last 3 years? What carrier currently insures it and at what premium?
- What's the average days-on-market for RENTAL listings here right now (not sales)? A rising rental-DOM trend means longer vacancies and softer asking-rent achievability than the comps imply.
- What's the recent tenant-quality profile in this submarket — average credit score on applications, eviction rate, late-payment / NSF rate, and stable-employment percentage? A property-management company in the area should have these aggregated.
- How much new for-sale + rental construction is in the pipeline within 1–3 miles? Heavy new supply typically softens prices + rents 12–24 months out; constrained supply supports both.
Investment metrics
- 1% rule
- 1.10% ✓
- Cap rate
- 8.76%
- Cash-on-cash
- 8.82%
- DSCR
- 1.39
- GRM
- 7.6
CMA / ARV
- ARV (median comp)
- $211,707
- List price
- $155,000
- Delta
- -26.79%
- Verdict
- UNDERPRICED
- Comps
- 20 within 1.0 mi
Show comp detail 12 sales within ~0.75 mi
| Address | Dist | Beds/Ba | Sqft | Sold | Price | $/sf | Match |
|---|---|---|---|---|---|---|---|
| 3879 Freddie St | 0.00mi | 3/1.5 | 1,390 (0%) | 0mo | $155,000 | $112 | 98 |
| 3918 Miller Ave | 0.11mi | 4/2.0 (+1) | 1,500 (+8%) | 2mo | $235,000 | $157 | 75 |
| 4117 Wiman Dr | 0.26mi | 3/2.5 | 1,513 (+9%) | 3mo | $115,000 | $76 | 68 |
| 4509 Quails Ln | 0.50mi | 4/2.0 (+1) | 1,419 (+2%) | 3mo | $228,999 | $161 | 66 |
| 3912 Wilbarger St | 0.40mi | 3/2.0 | 1,232 (-11%) | 4mo | $225,000 | $183 | 59 |
| 4301 Martin Luther King Fwy | 0.67mi | 3/2.0 | 1,332 (-4%) | 5mo | $270,000 | $203 | 58 |
| 4238 Martin Luther King Fwy | 0.70mi | 3/2.0 | 1,475 (+6%) | 0mo | $250,000 | $169 | 57 |
| 3617 Bright St | 0.44mi | 3/1.0 | 1,256 (-10%) | 5mo | $125,000 | $100 | 55 |
| 4413 Quails Ln | 0.46mi | 3/2.0 | 1,200 (-14%) | 2mo | $225,000 | $188 | 54 |
| 4613 Reed St | 0.62mi | 4/2.0 (+1) | 1,306 (-6%) | 3mo | $217,000 | $166 | 54 |
| 3612 Mountcastle Dr | 0.70mi | 4/2.0 (+1) | 1,284 (-8%) | 7mo | $239,999 | $187 | 44 |
| 4474 Burke Rd | 0.74mi | 3/2.0 | 1,571 (+13%) | 2mo | $245,000 | $156 | 42 |
Match score weights: distance 35% · size 25% · config 20% · recency 20%. Top-matched comps best support the ARV.
Projected returns pro-forma
-3.0% appreciation · 0.0% rent growth · sell at horizon
- IRR
- -6.3%
- Equity multiple
- 0.77×
- Total profit
- $-9,786
- Equity at exit
- $23,111
- IRR
- -0.6%
- Equity multiple
- 0.96×
- Total profit
- $-1,654
- Equity at exit
- $13,402
Cash invested: $43,400 (down + closing). Projections, not guarantees.
Landlord ↔ Tenant lean methodology
- Overall (STATE)
- 87 Strongly Landlord-Friendly
- State Texas
- 87 Strongly Landlord-Friendly · R+5
- County
- — inherits STATE
- City
- — inherits STATE
ZIP-level market 76119
- Home prices YoY
- -6.4%
- Rents YoY
- -1.6%
- Active inventory
- 186
- Price-to-rent
- 7.6×
Monthly cashflow live
- Estimated rent
- $1,704 high interval (Pro) →
- Mortgage (P&I)
- −$813
- Tax from tax record
- −$150 /mo · $1,797/yr
- Insurance
- −$65
- HOA
- −$0
- Vacancy / Maint / Mgmt
- −$358
- Net cashflow
- $319
Break-even live
UW: 25.0% down · 7.5% · 30yr · 1.5% tax · 5.0% vac · 8.0% maint · 8.0% mgmt
Financing live
Cash to close
- Down payment
- $38,750
- Closing costs
- $4,650
- Reserves months
- —
- Total cash needed
- —
Loan-product check · same deal, 3 products live
Conventional
25% down · 7.5% · 30yr
- Down + closing
- —
- Monthly P&I
- —
- Monthly cashflow
- —
- DSCR
- —
- Eligible?
- —
Personal DTI + credit; lowest rate.
DSCR
20% down · 8.5% · 30yr
- Down + closing
- —
- Monthly P&I
- —
- Monthly cashflow
- —
- DSCR
- —
- Eligible?
- —
No personal income docs; deal must DSCR.
Hard money
10% down · 12.0% · 12mo
- Down + closing
- —
- Monthly P&I
- —
- Monthly cashflow
- —
- DSCR
- —
- Eligible?
- —
Short-term bridge; refi at stabilization.
Rent comps 16 comps
| Address | Beds | Baths | Sqft | Rent | $/sqft | DOM | Units | Dist |
|---|---|---|---|---|---|---|---|---|
| 4336 Jana Dr Fort Worth, TX | 3.0 | 1.0 | 1070 | $1,650 | $1.54 | 4d | 1 | 0.43mi |
| 4508 Wiman Dr Fort Worth, TX | 3.0 | 2.0 | 1045 | $1,580 | $1.51 | 6d | 1 | 0.46mi |
| 3421 Bright St Unit 3421 Fort Worth, TX | 3.0 | 1.0 | 900 | $1,375 | $1.53 | 43d | 1 | 0.53mi |
| 4217 Wilhelm St Fort Worth, TX | 3.0 | 2.0 | 1380 | $1,650 | $1.20 | 43d | 1 | 0.68mi |
| 4514 Erath St Fort Worth, TX | 4.0 | 2.0 | 1536 | $1,850 | $1.20 | 43d | 1 | 0.81mi |
| 3211 Montague St Fort Worth, TX | 3.0 | 2.0 | 1460 | $1,999 | $1.37 | 43d | 1 | 0.84mi |
| 2701 Vogt St Fort Worth, TX | 3.0 | 2.0 | 1090 | $1,475 | $1.35 | 14d | 1 | 0.96mi |
| 3155 N Glen Garden Dr Fort Worth, TX | 3.0 | 2.0 | 1254 | $1,995 | $1.59 | 4d | 1 | 0.96mi |
| 4312 Lorin Ave Fort Worth, TX | 4.0 | 2.0 | 1230 | $2,000 | $1.63 | 43d | 1 | 1.04mi |
| 5055 Virgil St Fort Worth, TX | 3.0 | 2.0 | 1089 | $1,650 | $1.52 | 24d | 1 | 1.06mi |
| 2500 S Edgewood Ter Fort Worth, TX | 1.0–3.0 | 1.0–2.5 | 1123 | $1,895 | $1.69 | 2d | 34 | 1.13mi |
| 3229 Denman St Fort Worth, TX | 3.0 | 1.0 | 1236 | $1,550 | $1.25 | 10d | 1 | 1.16mi |
| 3816 Avenue N Fort Worth, TX | 3.0 | 1.0 | 1108 | $1,550 | $1.40 | 5d | 1 | 1.20mi |
| 3731 Avenue M Unit M Fort Worth, TX | 3.0 | 2.0 | 1425 | $1,900 | $1.33 | 22d | 1 | 1.31mi |
| 2825 Bideker Ave Fort Worth, TX | 3.0 | 1.0 | 900 | $1,500 | $1.67 | 24d | 1 | 1.46mi |
| 2939 Timberline Dr Fort Worth, TX | 3.0 | 2.0 | 1294 | $2,000 | $1.55 | 43d | 1 | 1.48mi |
Listing history 5 events
-
2026-05-17status Pending 1433-char remark
-
2026-05-13historical Active Option Contract 1433-char remark
-
2026-05-04$155,000 Active 1433-char remark
-
2026-04-16soldstatus
-
2023-06-28soldstatus
ⓘ Source: listings_history table (triggers on properties + properties_extension) + one-shot
backfill from property_details.listing_events for pre-trigger history.
Tax reassessment forecast TX · Resets to sale price
- Current annual tax
- $1,797 · $150/mo
- Projected year-2 tax
- $2,836 · $236/mo
- Expected delta
- +$1,040/yr (+$87/mo · 57.9%)
ⓘ Screening estimate from a state-policy table — verify with the county assessor before closing.
Climate risk First Street
- Flood 1/10 Low FEMA zone X (unshaded) · 0% chance over 30 yrs
- Wildfire 1/10 Low
- Heat 7/10 Severe 7 d/yr ≥110°F today · 23 d/yr by 30 yrs out
- Wind 4/10 Moderate 24% chance of damaging wind over 30 yrs
- Air quality 3/10 Moderate 3 unhealthy d/yr today · 4 by 30 yrs out
Nearby sold comps map
Loading sold comps map…
Walkable amenities ~0.75 mi
Loading nearby amenities…
Taxation est. · year 1
- Rental income
- $20,450
- − Mortgage interest
- −$8,682
- − Property taxes
- −$1,797
- − Insurance
- −$775
- − Repairs & maintenance
- −$1,636
- − Management
- −$1,636
- − Depreciation
- −$4,509
- Taxable income
- $1,415
- Est. tax owed @ 24.0%
- −$340
- After-tax cash flow
- $3,490/yr
For passive investors: Depreciation is non-cash, so a rental often shows a tax loss while cash-flowing — sheltering income. Rental losses are passive: they offset passive income freely, and up to $25,000/yr can offset ordinary (W-2) income if you actively participate and your MAGI is under $100k (phasing out to $0 by $150k); unused losses carry forward. On sale, claimed depreciation is recaptured at up to 25%, and gains may owe capital-gains tax (a 1031 exchange can defer both). Figures are a year-1 estimate at your 24.0% rate — not tax advice; consult a CPA.
Schools (NCES district)
- District
- Fort Worth ISD
- NCES district ID
- 4819700
- Math proficiency
- 18% ▼ -16.00%
- Reading proficiency
- 28% ▼ -6.00%
- Median HH income
- $42,109
- Composite
- 19.61/100
- National rank
- #8753
- State rank
- #742 of 826 in TX
Livability — Fort Worth
- Score
- 80/100
- State rank
- #49
- US rank
- #1954
Category grades
Schools grade is shown separately in the Schools card above.
Census & demographics
- Census place
- Fort Worth, TX
- County
- Tarrant County · 2,033,669 people
- City population
- 911,619
- Metro
- Dallas-Fort Worth-Arlington, TX
- Population (ZIP)
- 52,974
- Household income
- $51,267
- Rent vs Own
- Severe rent burden
- 2221.0
Population outlook (Tarrant County) Hauer SSP2
- Today (2025)
- 2,380,417 people
- By 2030
- 2,578,900 · +8.3%
- By 2040
- 2,974,995 · +25.0%
- By 2050
- 3,350,489 · +40.8%
- By 2075
- 4,216,909 · +77.2%
- By 2100
- 4,741,527 · +99.2%
Race, ethnicity, and origin ACS 2023
- Neighborhood character
- Diverse neighborhood (Simpson 0.60)
- Race & ethnicity
- Hispanic / Latino 51% Black 36% Two or more races 26% White 8% Asian 3%
- Hispanic origin (detail)
- Mexican 44%
- Foreign-born
- 25% · Canada, Philippines
- Languages at home
- 54% English-only · Spanish 42% Other Indo-European 2% Other Asian/Pacific 1%
Political lean MEDSL · Tarrant
- 2024 margin
- Lean R (+5.1) · D 46.7% · R 51.9% · Other 1.4%
- 2008→2024 swing
- +6.6pp toward D · 2008: -11.7pp · 2024: -5.1pp
- All cycles
- 2024: R+5.1 2020: D+0.2 2016: R+8.7 2012: R+15.7 2008: R+11.7
Not yet ingested
- Civics
- —
Market trends
- HPI YoY
- ▼ -23.04%
- Current HPI
- 336.7941
- Rent YoY
- ▼ -1.61%
- Metro
- Dallas-Fort Worth-Arlington, TX
- State GDP YoY
- ▲ 3.95%
- F500 in state
- 110
Industry mix (Fortune 500 HQ in TX)
| Industry | F500 HQs | Revenue |
|---|---|---|
| Energy | 16 | $1,198B |
|
||
| Technology | 5 | $198B |
|
||
| Engineering / Construction | 4 | $72B |
|
||
| Energy Services | 3 | $60B |
|
||
| Utilities | 3 | $41B |
|
||
| Healthcare | 2 | $330B |
|
||
Price history
6 events — show timeline
- 2026-06-11 Sold (MLS) — NTREIS
- 2026-05-17 Pending — NTREIS
- 2026-05-13 Contingent — NTREIS
- 2026-05-04 Listed $155,000 NTREIS
- 2026-04-16 Sold (Public Records) — Public Records
- 2023-06-28 Sold (Public Records) — Public Records
Property tax history
+4.7%/yrLatest (2025): $1,797 · -17.5% YoY. Source: county tax records.
Cash-flow waterfall
monthlySold comps — $/sqft
last 12 mo · ≤1 miLoading sold comps…