 🏷️ Likely Rental
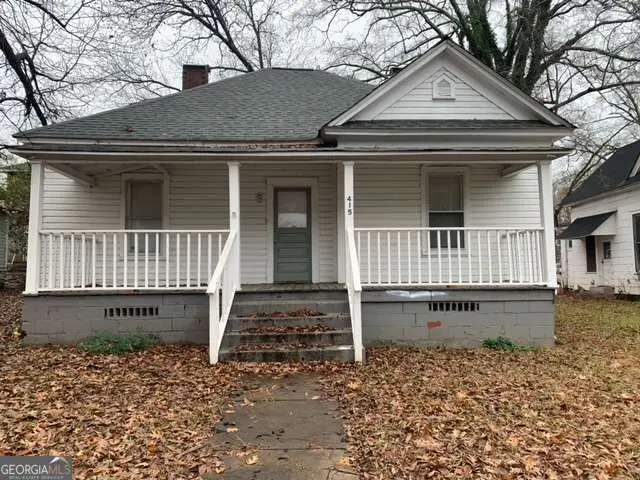
415 Calhoun Ave NE · Rome, GA
Flood risk 1/10 · Minimal
- FEMA flood zone
- X (unshaded)
- Chance of flooding over 30 yrs
- 0.0%
- Est. flood insurance / yr
- $507 – $1,088
Fire risk 4/10 · Minor
- Est. fire insurance / yr
- $963 – $1,789
Heat risk 6/10 · Moderate
- Hot days now (above 104°F)
- 7 days/yr
- Hot days in 30 yrs
- 19 days/yr
Wind risk 4/10 · Minor
- Chance of severe wind over 30 yrs
- 21.0%
Air-quality risk 3/10 · Minor
- Unhealthy air days now
- 3 days/yr
- Unhealthy air days in 30 yrs
- 3 days/yr
Risk factors via First Street. Map © Google.
Why this score? — see what drove the B+ grade
The composite is a weighted blend of 9 inputs, each scored 0–100. Each bar is that input's sub-score; the figure is the points it added to the 100-point composite (weight × sub-score).
- Cash flow +30.0/30.0
- ARV discount +15.0/15.0
- 1% rule +10.0/10.0
- DSCR +10.0/10.0
- Rent growth +4.1/5.0
- Livability +3.2/5.0
- Condition / age +2.5/5.0
- Schools +2.3/10.0
- Appreciation +0.0/10.0
$105,000
🖨 Deal sheet 📄 Offer letter ✓ Due diligence
Listing remarks MLS
Investors! 4BR - 1BA Rental House. Vacant for 2 months. Rented for $1100/mo the past 2 years.
Key facts
- 9,147 sq ft lot
- 2 parking spots
- Built 1919
Neighborhood map
What this means for you Summary
Snapshot
- This is a 4-bed/1.0-bath single-family listed at $105k.
Deal economics
- At list price, monthly cash flow is $803 ($10k/yr) — positive.
- The deal already cash-flows at list — no discount required.
- Meets the 1% rule at list price ($2k rent vs $105k).
- Recommended offer: $103k (1.5% below list) — sets the bar for market timing.
- Cap rate 15.5% vs local median 3.3% in Rome — top-decile yield for the area; either an underpriced asset or a hidden risk that comps aren't pricing in. Stress-test before assuming the spread holds.
Location & tenants
- Location reads 64/100 on livability (#266 in GA) — a middle-class / working-renter tenant base. Strengths: cost of living A+, housing A+, health & safety A+; Watch: schools F, crime F, amenities F.
- Rome City (urban): math 27% / reading 29% proficiency, ranked #112 of 174 in GA (top 64%) — low school quality limits family demand, transient renter base, plan for 1-2y turnover; 71% free/reduced lunch — lower-income household profile, screen leases tightly.
- Market conditions: Rents rising fast (+6.3%/yr); 411 active listings in the ZIP; 4 comparable units currently listed for rent nearby; rentals lingering (median 44d on market — plan ~5-8 weeks vacancy on turnover, expect pricing pressure); 100% of comp listings sitting > 30 days — soft ceiling on asking rent; 355 units permitted in Floyd County in 2024 (0 in 5+ unit buildings).
- This rent runs 37% of the median local income ($62k/yr) — at the standard rent-burdened threshold; future hikes will face affordability resistance.
Forward outlook
- Local home prices are declining (-3.0%/yr); year-one equity from $726 of loan paydown is wiped out by about $3k of value loss. Plan a longer hold.
- Floyd County population projected to shrink 6% by 2050 — rents likely to lag national; underwrite the cash flow, not the appreciation.
- At projected returns (-3.0% appreciation + 6.3% rent growth), your $29k cash investment doubles in ~4 years — after that, you're playing with house money.
Negotiation context
- It's been on market 18 days — a 2% lower offer ($103k) is reasonable based on typical stale-listing flexibility.
- 4 sale attempts since 5y ago; this cycle's ask has dropped $15k (12%) from the opening price — seller is motivated, your offer sets the floor, not the list.
- Current owner paid $54k; list at $105k implies a 94% gain — meaningful room to come down on a strong offer.
Risks & watch-outs
- Watch-outs: built in 1919 — expect roof / HVAC / electrical / plumbing capex.
- Climate carrying-cost: extreme-heat days projected 7→19/yr by 2055 (HVAC capex compounding) — expect insurance premiums to compound above CPI over the hold.
Questions for the listing agent
- Built in 1919 — when were the roof, HVAC, electrical panel, plumbing, and water heater last replaced?
- Is there a deadline driving the sale (1031 exchange, divorce, estate, relocation)? That informs how much negotiation room exists.
- Schools are F-rated, which usually means shorter tenancies and higher turnover. Who's the typical renter profile here, and what's been the actual vacancy rate?
- Crime grade is F in this area — have there been break-ins, vandalism, or insurance claims at this property in the last 3 years? What carrier currently insures it and at what premium?
- What's the average days-on-market for RENTAL listings here right now (not sales)? A rising rental-DOM trend means longer vacancies and softer asking-rent achievability than the comps imply.
- What's the recent tenant-quality profile in this submarket — average credit score on applications, eviction rate, late-payment / NSF rate, and stable-employment percentage? A property-management company in the area should have these aggregated.
- How much new for-sale + rental construction is in the pipeline within 1–3 miles? Heavy new supply typically softens prices + rents 12–24 months out; constrained supply supports both.
Investment metrics
- 1% rule
- 1.83% ✓
- Cap rate
- 15.47%
- Cash-on-cash
- 32.77%
- DSCR
- 2.46
- GRM
- 4.6
CMA / ARV
- ARV (median comp)
- $143,004
- List price
- $105,000
- Delta
- -19.58%
- Verdict
- UNDERPRICED
- Comps
- 20 within 1.0 mi
Show comp detail 12 sales within ~0.75 mi
| Address | Dist | Beds/Ba | Sqft | Sold | Price | $/sf | Match |
|---|---|---|---|---|---|---|---|
| 310 Kingston Ave NE | 0.12mi | 3/2.0 (-1) | 1,420 (+0%) | 2mo | $200,000 | $141 | 84 |
| 308 Perkins St NE | 0.15mi | 3/1.0 (-1) | 1,338 (-6%) | 5mo | $37,000 | $28 | 74 |
| 203 Forsyth St NE | 0.34mi | 3/2.0 (-1) | 1,395 (-2%) | 1mo | $90,000 | $65 | 72 |
| 501 Calhoun Ave NE | 0.03mi | 3/2.0 (-1) | 1,329 (-6%) | 10mo | $132,000 | $99 | 71 |
| 110 Burnett St NE | 0.12mi | 3/1.0 (-1) | 1,306 (-8%) | 10mo | $139,900 | $107 | 68 |
| 413 Calhoun Ave NE | 0.01mi | 3/2.0 (-1) | 1,626 (+15%) | 1mo | $140,000 | $86 | 65 |
| 313 Kingston Ave NE | 0.09mi | 3/2.0 (-1) | 1,276 (-10%) | 10mo | $219,900 | $172 | 62 |
| 122 Perkins St NE | 0.26mi | 3/2.0 (-1) | 1,289 (-9%) | 3mo | $199,000 | $154 | 61 |
| 43 King Bee Cir NE | 0.19mi | 3/2.0 (-1) | 1,269 (-10%) | 4mo | $180,000 | $142 | 61 |
| 206 Church Street St | 0.40mi | 3/2.0 (-1) | 1,473 (+4%) | 7mo | $195,000 | $132 | 60 |
| 200 Ross St NE | 0.64mi | 3/2.0 (-1) | 1,358 (-4%) | 9mo | $190,000 | $140 | 46 |
| 11 Pine St NE | 0.49mi | 3/2.0 (-1) | 1,611 (+14%) | 8mo | $184,000 | $114 | 39 |
Match score weights: distance 35% · size 25% · config 20% · recency 20%. Top-matched comps best support the ARV.
Projected returns pro-forma
-3.0% appreciation · 6.28% rent growth · sell at horizon
- IRR
- 31.6%
- Equity multiple
- 2.38×
- Total profit
- $40,686
- Equity at exit
- $15,656
- IRR
- 40.5%
- Equity multiple
- 5.43×
- Total profit
- $130,098
- Equity at exit
- $9,078
Cash invested: $29,400 (down + closing). Projections, not guarantees.
Landlord ↔ Tenant lean methodology
- Overall (STATE)
- 90 Strongly Landlord-Friendly
- State Georgia
- 90 Strongly Landlord-Friendly · R+3
- County
- — inherits STATE
- City
- — inherits STATE
ZIP-level market 30161
- Rents YoY
- 6.3%
- Active inventory
- 411
- Price-to-rent
- 4.6×
Monthly cashflow live
- Estimated rent
- $1,921 medium interval (Pro) →
- Mortgage (P&I)
- −$551
- Tax from tax record
- −$120 /mo · $1,441/yr
- Insurance
- −$44
- HOA
- −$0
- Vacancy / Maint / Mgmt
- −$403
- Net cashflow
- $803
Break-even live
UW: 25.0% down · 7.5% · 30yr · 1.5% tax · 5.0% vac · 8.0% maint · 8.0% mgmt
Financing live
Cash to close
- Down payment
- $26,250
- Closing costs
- $3,150
- Reserves months
- —
- Total cash needed
- —
Loan-product check · same deal, 3 products live
Conventional
25% down · 7.5% · 30yr
- Down + closing
- —
- Monthly P&I
- —
- Monthly cashflow
- —
- DSCR
- —
- Eligible?
- —
Personal DTI + credit; lowest rate.
DSCR
20% down · 8.5% · 30yr
- Down + closing
- —
- Monthly P&I
- —
- Monthly cashflow
- —
- DSCR
- —
- Eligible?
- —
No personal income docs; deal must DSCR.
Hard money
10% down · 12.0% · 12mo
- Down + closing
- —
- Monthly P&I
- —
- Monthly cashflow
- —
- DSCR
- —
- Eligible?
- —
Short-term bridge; refi at stabilization.
Rent comps 4 comps
| Address | Beds | Baths | Sqft | Rent | $/sqft | DOM | Units | Dist |
|---|---|---|---|---|---|---|---|---|
| 105 W Callahan St Rome, GA | 3.0 | 2.0 | 1500 | $2,000 | $1.33 | 43d | 1 | 0.32mi |
| 3 Forsyth St NE Rome, GA | 3.0 | 2.0 | 1134 | $1,795 | $1.58 | 43d | 1 | 0.38mi |
| 20 Joplin St NE Rome, GA | 3.0 | 2.5 | 1740 | $2,399 | $1.38 | 43d | 1 | 1.14mi |
| 525 W 13th St NE Rome, GA | 2.0–3.0 | 2.0 | 1059 | $1,499 | $1.41 | 43d | 12 | 1.48mi |
Listing history 29 events
-
2026-06-19days on market $105,000 Active 18 DOM
-
2026-06-18days on market $105,000 Active 17 DOM
-
2026-06-17days on market $105,000 Active 16 DOM
-
2026-06-16days on market $105,000 Active 15 DOM
-
2026-06-15days on market $105,000 Active 14 DOM
-
2026-06-14days on market $105,000 Active 12 DOM
-
2026-06-13days on market $105,000 Active 11 DOM
-
2026-06-10days on market $105,000 Active 9 DOM
-
2026-06-09days on market $105,000 Active 8 DOM
-
2026-06-08days on market $105,000 Active 7 DOM
-
2026-06-07days on market $105,000 Active 6 DOM
-
2026-06-05days on market $105,000 Active 3 DOM
-
2026-06-03days on market $105,000 Active 2 DOM
-
2026-06-02pricedays on market $105,000 Active 1 DOM
-
2026-04-22price $115,000 95-char remark
Show marketing remark (95 chars)
Investors! 4BR - 1BA Rental House. Vacant for 2 months. Rented for $1100/mo the past 2 years.
-
2026-01-27$120,000 New 95-char remark
Show marketing remark (95 chars)
Investors! 4BR - 1BA Rental House. Vacant for 2 months. Rented for $1100/mo the past 2 years.
-
2022-12-19historical
-
2021-06-29soldstatus $54,000 Closed 141-char remark
Show marketing remark (141 chars)
Investors! 4BR - 1BA Rental House. $750/mo. Tenant occupied, please do not disturb. Walk through and inspections after accepted contract.
-
2021-06-29soldstatus $54,000 Sold
Show marketing remark (141 chars)
Investors! 4BR - 1BA Rental House. $750/mo. Tenant occupied, please do not disturb. Walk through and inspections after accepted contract.
-
2021-06-29soldstatus $54,000
Show marketing remark (141 chars)
Investors! 4BR - 1BA Rental House. $750/mo. Tenant occupied, please do not disturb. Walk through and inspections after accepted contract.
-
2021-06-29soldstatus $54,000
Show marketing remark (141 chars)
Investors! 4BR - 1BA Rental House. $750/mo. Tenant occupied, please do not disturb. Walk through and inspections after accepted contract.
-
2021-06-24status Pending 141-char remark
Show marketing remark (141 chars)
Investors! 4BR - 1BA Rental House. $750/mo. Tenant occupied, please do not disturb. Walk through and inspections after accepted contract.
-
2021-06-09status Under Contract
-
2021-06-07$54,000 Active 141-char remark
Show marketing remark (141 chars)
Investors! 4BR - 1BA Rental House. $750/mo. Tenant occupied, please do not disturb. Walk through and inspections after accepted contract.
-
2021-06-07$54,000 New
Show marketing remark (141 chars)
Investors! 4BR - 1BA Rental House. $750/mo. Tenant occupied, please do not disturb. Walk through and inspections after accepted contract.
-
2021-06-07$54,000
Show marketing remark (141 chars)
Investors! 4BR - 1BA Rental House. $750/mo. Tenant occupied, please do not disturb. Walk through and inspections after accepted contract.
-
2001-04-12soldstatus $10,000
-
1999-06-11soldstatus $30,900
-
1998-02-27soldstatus $20,000
ⓘ Source: listings_history table (triggers on properties + properties_extension) + one-shot
backfill from property_details.listing_events for pre-trigger history.
Tax reassessment forecast GA · Resets to sale price
- Current annual tax
- $1,441 · $120/mo
- Projected year-2 tax
- $1,441 · $120/mo
- Expected delta
- $0/yr ($0/mo · 0.0%)
ⓘ Screening estimate from a state-policy table — verify with the county assessor before closing.
Climate risk First Street
- Flood 1/10 Low FEMA zone X (unshaded) · 0% chance over 30 yrs
- Wildfire 4/10 Moderate
- Heat 6/10 Major 7 d/yr ≥104°F today · 19 d/yr by 30 yrs out
- Wind 4/10 Moderate 21% chance of damaging wind over 30 yrs
- Air quality 3/10 Moderate 3 unhealthy d/yr today · 3 by 30 yrs out
Nearby sold comps map
Loading sold comps map…
Walkable amenities ~0.75 mi
Loading nearby amenities…
Taxation est. · year 1
- Rental income
- $23,047
- − Mortgage interest
- −$5,882
- − Property taxes
- −$1,441
- − Insurance
- −$525
- − Repairs & maintenance
- −$1,844
- − Management
- −$1,844
- − Depreciation
- −$3,055
- Taxable income
- $8,458
- Est. tax owed @ 24.0%
- −$2,030
- After-tax cash flow
- $7,604/yr
For passive investors: Depreciation is non-cash, so a rental often shows a tax loss while cash-flowing — sheltering income. Rental losses are passive: they offset passive income freely, and up to $25,000/yr can offset ordinary (W-2) income if you actively participate and your MAGI is under $100k (phasing out to $0 by $150k); unused losses carry forward. On sale, claimed depreciation is recaptured at up to 25%, and gains may owe capital-gains tax (a 1031 exchange can defer both). Figures are a year-1 estimate at your 24.0% rate — not tax advice; consult a CPA.
Schools (NCES district)
- District
- Rome City
- NCES district ID
- 1304440
- Math proficiency
- 27% ▼ -14.00%
- Reading proficiency
- 29% ▼ -4.00%
- Median HH income
- $34,889
- Composite
- 23.1/100
- National rank
- #7963
- State rank
- #112 of 174 in GA
Livability — Rome
- Score
- 64/100
- State rank
- #266
- US rank
- #14459
Category grades
Schools grade is shown separately in the Schools card above.
Census & demographics
- Census place
- Rome, GA
- County
- Floyd County · 77,706 people
- City population
- 77,706
- Metro
- Rome, GA
- Population (ZIP)
- 34,705
- Household income
- $61,667
- Rent vs Own
- Severe rent burden
- 1104.0
Population outlook (Floyd County) Hauer SSP2
- Today (2025)
- 96,321 people
- By 2030
- 95,532 · -0.8%
- By 2040
- 93,332 · -3.1%
- By 2050
- 90,850 · -5.7%
- By 2075
- 84,989 · -11.8%
- By 2100
- 76,097 · -21.0%
Race, ethnicity, and origin ACS 2023
- Neighborhood character
- Predominantly White (68%)
- Race & ethnicity
- White 68% Black 20% Hispanic / Latino 7% Two or more races 6% Asian 1%
- Hispanic origin (detail)
- Mexican 2%
- Common ancestry
- Slovak 3% Serbian 2% Italian 2%
- Foreign-born
- 5% · Canada
- Languages at home
- 91% English-only · Spanish 5% Other Indo-European 1%
Political lean MEDSL · Floyd
- 2024 margin
- Solid R (+42.0) · D 28.8% · R 70.7%
- 2008→2024 swing
- -5.6pp toward R · 2008: -36.4pp · 2024: -42.0pp
- All cycles
- 2024: R+42.0 2020: R+41.1 2016: R+43.5 2012: R+39.9 2008: R+36.4
Not yet ingested
- Civics
- —
Market trends
- HPI YoY
- ▼ -186.06%
- Current HPI
- 257.8168
- Rent YoY
- ▲ 6.28%
- Metro
- Rome, GA
- State GDP YoY
- ▲ 2.66%
- F500 in state
- 28
Industry mix (Fortune 500 HQ in GA)
| Industry | F500 HQs | Revenue |
|---|---|---|
| Paper / Packaging | 2 | $29B |
|
||
| Retail | 1 | $160B |
|
||
| Transportation / Logistics | 1 | $91B |
|
||
| Airlines | 1 | $62B |
|
||
| Consumer Goods | 1 | $47B |
|
||
| Utilities | 1 | $25B |
|
||
Price history
+475.0% since first listed15 events — show timeline
- 2026-04-22 Price Changed $115,000 GAMLS
- 2026-01-27 Listed $120,000 GAMLS
- 2022-12-19 Rental Removed — FMLS
- 2021-06-29 Sold (Public Records) $54,000 Public Records
- 2021-06-29 Sold (MLS) $54,000 WCARE
- 2021-06-29 Sold (MLS) $54,000 GAMLS
- 2021-06-29 Sold (MLS) $54,000 FMLS
- 2021-06-24 Pending — FMLS
- 2021-06-09 Pending — GAMLS
- 2021-06-07 Listed $54,000 WCARE
- 2021-06-07 Listed $54,000 GAMLS
- 2021-06-07 Listed $54,000 FMLS
- 2001-04-12 Sold (Public Records) $10,000 Public Records
- 1999-06-11 Sold (Public Records) $30,900 Public Records
- 1998-02-27 Sold (Public Records) $20,000 Public Records
Property tax history
+14.6%/yrLatest (2025): $1,441 · -8.9% YoY. Source: county tax records.
Cash-flow waterfall
monthlySold comps — $/sqft
last 12 mo · ≤1 miLoading sold comps…