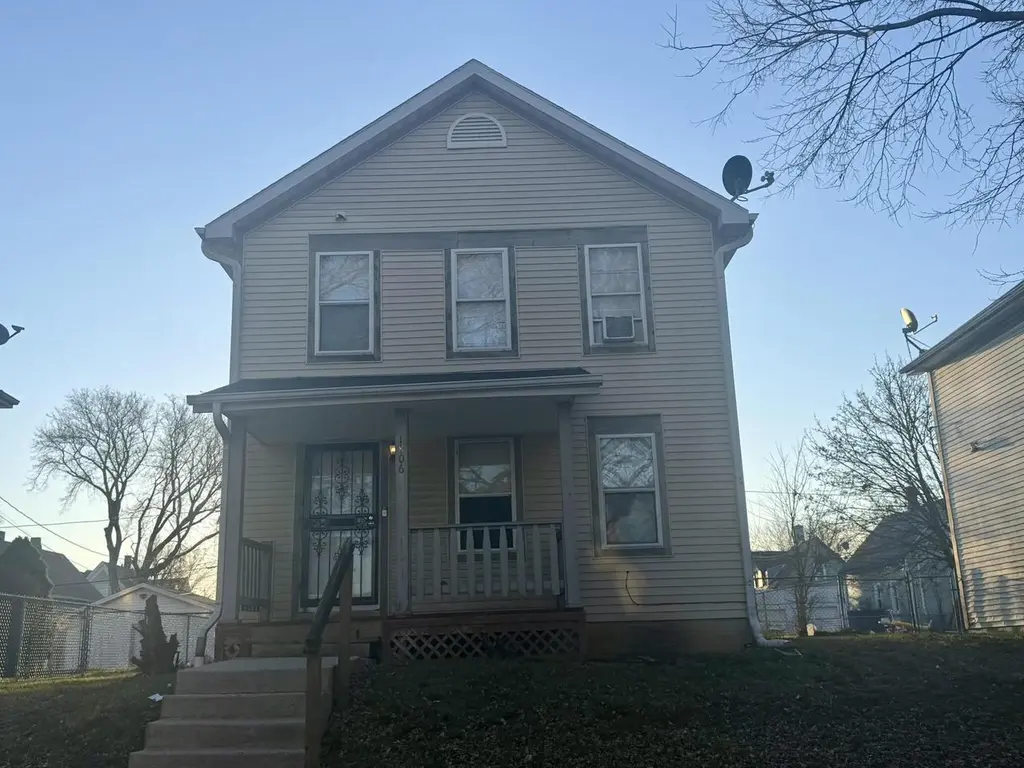
1806 N 24th St · Milwaukee, WI
Flood risk 1/10 · Minimal
- FEMA flood zone
- X (unshaded)
- Chance of flooding over 30 yrs
- 0.0%
- Est. flood insurance / yr
- $473 – $860
Fire risk 1/10 · Minimal
- Est. fire insurance / yr
- $636 – $1,182
Heat risk 2/10 · Minimal
- Hot days now (above 98°F)
- 7 days/yr
- Hot days in 30 yrs
- 13 days/yr
Wind risk 2/10 · Minimal
- Chance of severe wind over 30 yrs
- —
Air-quality risk 3/10 · Minor
- Unhealthy air days now
- 3 days/yr
- Unhealthy air days in 30 yrs
- 4 days/yr
Risk factors via First Street. Map © Google.
Why this score? — see what drove the C- grade
The composite is a weighted blend of 9 inputs, each scored 0–100. Each bar is that input's sub-score; the figure is the points it added to the 100-point composite (weight × sub-score).
- Cash flow +18.5/30.0
- Appreciation +6.5/10.0
- DSCR +5.8/10.0
- 1% rule +5.0/10.0
- ARV discount +4.9/15.0
- Livability +4.0/5.0
- Rent growth +2.5/5.0
- Condition / age +2.5/5.0
- Schools +1.2/10.0
$139,900
🖨 Deal sheet 📄 Offer letter ✓ Due diligence
Listing remarks MLS
Built in 1999 this 3BR colonial home has much to offer with newer construction. Long time rental home is occupied. Parking in the back. Priced under assessed value!
Key facts
- 6,098 sq ft lot
- Parking
- Built 1999
Neighborhood map
What this means for you Summary
Snapshot
- This is a 3-bed/1.0-bath single-family listed at $140k.
Deal economics
- At list price, monthly cash flow is $132 ($2k/yr) — positive.
- The deal already cash-flows at list — no discount required.
- To meet the 1% rule (rent ≥ 1% of price), the offer needs to be $139k (0.4% below list).
- Recommended offer: $132k (6.0% below list) — sets the bar for market timing.
- Cap rate 7.4% vs local median 5.1% in Milwaukee — top-decile yield for the area; either an underpriced asset or a hidden risk that comps aren't pricing in. Stress-test before assuming the spread holds.
Location & tenants
- Location reads 81/100 on livability (#55 in WI, #1,534 nationally) — a professional / high-income tenant draw. Strengths: amenities A+, commute A+, cost of living A+; Watch: employment D+, schools F, crime F.
- Milwaukee School District (urban): math 10% / reading 18% proficiency, ranked #337 of 342 in WI (top 98%) — low school quality limits family demand, transient renter base, plan for 1-2y turnover; 77% free/reduced lunch — lower-income household profile, screen leases tightly.
- Market conditions: 28 active listings in the ZIP; 40 comparable units currently listed for rent nearby; rentals at typical pace (median 17d on market — plan ~3-4 weeks tenant-placement turnaround); lower-income renter base — watch delinquency; 1,017 units permitted in Milwaukee County in 2024 (803 in 5+ unit buildings).
- At $1,394/mo this rent would consume 53% of the median local household income ($32k/yr) (locally 636% of renters already pay >50% of income on rent) — very limited rent-growth headroom before tenants either downsize or default.
Forward outlook
- In year one you build about $5k of equity ($967 loan paydown + $4k appreciation (3.0% local appreciation)).
- Milwaukee County population projected at +4% by 2050 — modest demand growth; plan on rents tracking national, not racing it.
- At projected returns (3.0% appreciation + 3.0% rent growth), your $39k cash investment doubles in ~5 years — after that, you're playing with house money.
- By year 7, paydown + projected appreciation supports a ~$33k cash-out refi (75% LTV) — recoverable capital for the next deal without selling this one.
Negotiation context
- It's been on market 62 days — a 6% lower offer ($132k) is reasonable based on typical stale-listing flexibility.
- 2 sale attempts since 12y ago; this cycle's ask has dropped $10k (7%) from the opening price — seller is motivated, your offer sets the floor, not the list.
- Current owner paid $31k; list at $140k implies a 351% gain — meaningful room to come down on a strong offer.
Questions for the listing agent
- It's been on market 62 days. Have you received any prior offers? Is the seller open to a 6% concession, seller financing, or rate buy-down credit?
- Why hasn't it sold? Are there any deal-killer items the seller is aware of (foundation, flood, title, zoning, code violations)?
- Is there a deadline driving the sale (1031 exchange, divorce, estate, relocation)? That informs how much negotiation room exists.
- Schools are F-rated, which usually means shorter tenancies and higher turnover. Who's the typical renter profile here, and what's been the actual vacancy rate?
- Crime grade is F in this area — have there been break-ins, vandalism, or insurance claims at this property in the last 3 years? What carrier currently insures it and at what premium?
- What's the average days-on-market for RENTAL listings here right now (not sales)? A rising rental-DOM trend means longer vacancies and softer asking-rent achievability than the comps imply.
- What's the recent tenant-quality profile in this submarket — average credit score on applications, eviction rate, late-payment / NSF rate, and stable-employment percentage? A property-management company in the area should have these aggregated.
- How much new for-sale + rental construction is in the pipeline within 1–3 miles? Heavy new supply typically softens prices + rents 12–24 months out; constrained supply supports both.
Investment metrics
- 1% rule
- 1.00% ✗
- Cap rate
- 7.43%
- Cash-on-cash
- 4.04%
- DSCR
- 1.18
- GRM
- 8.4
CMA / ARV
- ARV (median comp)
- $132,233
- List price
- $139,900
- Delta
- 5.80%
- Verdict
- FAIR
- Comps
- 20 within 1.0 mi
Show comp detail 12 sales within ~0.75 mi
| Address | Dist | Beds/Ba | Sqft | Sold | Price | $/sf | Match |
|---|---|---|---|---|---|---|---|
| 2459 W Walnut St | 0.13mi | 3/1.0 | 1,108 (-3%) | 4mo | $24,000 | $22 | 85 |
| 1931 N 20th St | 0.26mi | 3/1.0 | 1,121 (-2%) | 10mo | $152,500 | $136 | 76 |
| 1431 N 24th Pl | 0.33mi | 3/1.0 | 1,106 (-3%) | 8mo | $47,900 | $43 | 73 |
| 1955 N 26th St | 0.26mi | 3/1.0 | 1,176 (+3%) | 14mo | $172,500 | $147 | 72 |
| 1437 N 26th St | 0.37mi | 3/1.0 | 1,082 (-5%) | 11mo | $205,000 | $189 | 64 |
| 1209 N 25th St | 0.55mi | 3/1.0 | 1,084 (-5%) | 3mo | $106,000 | $98 | 64 |
| 1444 N 29th St | 0.47mi | 4/2.0 (+1) | 1,158 (+1%) | 6mo | $76,000 | $66 | 62 |
| 2932 W Juneau Ave | 0.70mi | 3/2.0 | 1,087 (-5%) | 0mo | $75,000 | $69 | 55 |
| 2462 N 23rd St | 0.68mi | 3/1.0 | 1,227 (+7%) | 7mo | $129,900 | $106 | 51 |
| 1915 W Galena St | 0.34mi | 3/1.5 | 994 (-13%) | 15mo | $81,000 | $81 | 48 |
| 2453 N 25th St | 0.68mi | 4/1.0 (+1) | 1,194 (+4%) | 14mo | $88,000 | $74 | 44 |
| 2457 N 25th St | 0.68mi | 4/1.0 (+1) | 1,230 (+8%) | 13mo | $126,500 | $103 | 40 |
Match score weights: distance 35% · size 25% · config 20% · recency 20%. Top-matched comps best support the ARV.
Projected returns pro-forma
3.02% appreciation · 3.0% rent growth · sell at horizon
- IRR
- 11.3%
- Equity multiple
- 1.65×
- Total profit
- $25,458
- Equity at exit
- $63,089
- IRR
- 13.5%
- Equity multiple
- 3.01×
- Total profit
- $78,681
- Equity at exit
- $97,372
Cash invested: $39,172 (down + closing). Projections, not guarantees.
Landlord ↔ Tenant lean methodology
- Overall (STATE)
- 73 Landlord-Friendly
- State Wisconsin
- 73 Landlord-Friendly · R+2
- County
- — inherits STATE
- City
- — inherits STATE
ZIP-level market 53205
- Home prices YoY
- 0.8%
- Active inventory
- 28
- Price-to-rent
- 8.4×
Monthly cashflow live
- Estimated rent
- $1,394 high interval (Pro) →
- Mortgage (P&I)
- −$734
- Tax from tax record
- −$177 /mo · $2,128/yr
- Insurance
- −$58
- HOA
- −$0
- Vacancy / Maint / Mgmt
- −$293
- Net cashflow
- $132
Break-even live
UW: 25.0% down · 7.5% · 30yr · 1.5% tax · 5.0% vac · 8.0% maint · 8.0% mgmt
Financing live
Cash to close
- Down payment
- $34,975
- Closing costs
- $4,197
- Reserves months
- —
- Total cash needed
- —
Loan-product check · same deal, 3 products live
Conventional
25% down · 7.5% · 30yr
- Down + closing
- —
- Monthly P&I
- —
- Monthly cashflow
- —
- DSCR
- —
- Eligible?
- —
Personal DTI + credit; lowest rate.
DSCR
20% down · 8.5% · 30yr
- Down + closing
- —
- Monthly P&I
- —
- Monthly cashflow
- —
- DSCR
- —
- Eligible?
- —
No personal income docs; deal must DSCR.
Hard money
10% down · 12.0% · 12mo
- Down + closing
- —
- Monthly P&I
- —
- Monthly cashflow
- —
- DSCR
- —
- Eligible?
- —
Short-term bridge; refi at stabilization.
Rent comps 40 comps
| Address | Beds | Baths | Sqft | Rent | $/sqft | DOM | Units | Dist |
|---|---|---|---|---|---|---|---|---|
| 1430 N 21st St Unit 2 Milwaukee, WI | 2.0 | 1.0 | 1000 | $975 | $0.97 | 43d | 1 | 0.39mi |
| 3109 W Walnut St Milwaukee, WI | 2.0 | 1.0 | 1000 | $1,095 | $1.09 | 43d | 1 | 0.53mi |
| 1239 N 26th St Unit 1 Milwaukee, WI | 3.0 | 1.0 | 1300 | $1,400 | $1.08 | 43d | 1 | 0.53mi |
| 1239 N 26th St Unit 1 Milwaukee, WI | 3.0 | 1.0 | 1300 | $1,400 | $1.08 | 44d | 1 | 0.53mi |
| 1235 N 26th St Milwaukee, WI | 3.0 | 1.0 | 900 | $950 | $1.06 | 43d | 1 | 0.53mi |
| 2478-2480 W Juneau Ave Unit 2478 Milwaukee, WI | 4.0 | 1.0 | 1375 | $1,495 | $1.09 | 23d | 1 | 0.55mi |
| 2610 W Juneau Ave Unit 2610 Milwaukee, WI | 3.0 | 1.0 | 893 | $1,400 | $1.57 | 23d | 1 | 0.58mi |
| 1515 N 32nd St Unit 1515 Milwaukee, WI | 3.0 | 1.0 | 1200 | $1,245 | $1.04 | 4d | 1 | 0.63mi |
| 1639 N 33rd St Milwaukee, WI | 3.0 | 1.0 | 1424 | $950 | $0.67 | 23d | 1 | 0.65mi |
| 2201 N 32nd St Unit 2201 Milwaukee, WI | 3.0 | 1.0 | 1100 | $1,195 | $1.09 | 16d | 1 | 0.68mi |
| 936 N 25th St Unit 1 Milwaukee, WI | 2.0 | 1.0 | 900 | $1,338 | $1.49 | 43d | 1 | 0.80mi |
| 2530 N 28th St Unit 2530 Lower Milwaukee, WI | 2.0 | 1.0 | 764 | $995 | $1.30 | 14d | 1 | 0.81mi |
| 3303 W Juneau Ave Unit 5 Milwaukee, WI | 2.0 | 1.0 | 750 | $945 | $1.26 | 43d | 1 | 0.85mi |
| 1135 N 33rd St Unit 2 Milwaukee, WI | 2.0 | 1.0 | 850 | $995 | $1.17 | 43d | 1 | 0.86mi |
| 2809 W Clarke St Unit 12811 Milwaukee, WI | 3.0 | 1.0 | 1400 | $1,200 | $0.86 | 17d | 1 | 0.87mi |
| 2125 W Kilbourn Ave Unit 15 Milwaukee, WI | 2.0 | 1.0 | 800 | $1,395 | $1.74 | 43d | 1 | 0.88mi |
| 2630 N 24th St Milwaukee, WI | 2.0 | 1.0 | 934 | $1,450 | $1.55 | 19d | 1 | 0.88mi |
| 825 N 22nd St Milwaukee, WI | 2.0 | 1.0 | 675 | $1,088 | $1.61 | 4d | 5 | 0.91mi |
| 2001 N 38th St #2003 Milwaukee, WI | 3.0 | 1.0 | 1326 | $950 | $0.72 | 1d | 1 | 0.95mi |
| 1116 N 13th St Milwaukee, WI | 3.0 | 1.0 | 1400 | $1,345 | $0.96 | 14d | 1 | 0.97mi |
| 2741 N 23rd St Milwaukee, WI | 3.0 | 1.0 | 900 | $1,050 | $1.17 | 14d | 1 | 1.02mi |
| 2741 N 23rd St Unit 2 Milwaukee, WI | 3.0 | 1.0 | 1000 | $1,100 | $1.10 | 17d | 1 | 1.03mi |
| 1303 N 10th St Milwaukee, WI | 3.0 | 1.0–2.0 | 797 | $2,990 | $3.75 | 1d | 26 | 1.04mi |
| 2765 N 26th St Unit 2 Milwaukee, WI | 2.0 | 1.0 | 1100 | $1,100 | $1.00 | 4d | 1 | 1.07mi |
| 2765 N 26th St Unit 1 Milwaukee, WI | 3.0 | 1.0 | 1125 | $1,200 | $1.07 | 4d | 1 | 1.07mi |
| 2517 W Hadley St Milwaukee, WI | 2.0 | 1.0 | 850 | $1,050 | $1.24 | 14d | 1 | 1.08mi |
| 1009 W Juneau Ave Unit 114 Milwaukee, WI | 2.0 | 1.5 | 900 | $2,350 | $2.61 | 43d | 1 | 1.10mi |
| 3100 W Center St Milwaukee, WI | 3.0 | 2.0 | 1174 | $1,531 | $1.30 | 1d | 1 | 1.10mi |
| 2550 N 36th St Unit 2550A Upper Milwaukee, WI | 2.0 | 1.0 | 711 | $845 | $1.19 | 23d | 1 | 1.11mi |
| 901 W Winnebago St Milwaukee, WI | 1.0–3.0 | 1.0–2.0 | 1359 | $2,629 | $1.93 | 2d | 10 | 1.12mi |
| 2530 N 37th St Milwaukee, WI | 2.0 | 1.0 | 1037 | $1,000 | $0.96 | 14d | 1 | 1.13mi |
| 2403-2405 N 39th St Unit 2403 Lower Milwaukee, WI | 3.0 | 1.0 | 1200 | $995 | $0.83 | 10d | 1 | 1.15mi |
| 2403-2405 N 39th St Unit 2405 Upper Milwaukee, WI | 3.0 | 1.0 | 1141 | $995 | $0.87 | 10d | 1 | 1.16mi |
| 1125 N 9th St Unit 111 Milwaukee, WI | 2.0 | 1.0 | 735 | $1,550 | $2.11 | 43d | 1 | 1.18mi |
| 4232 W Highland Blvd Milwaukee, WI | 2.0 | 1.0 | 700 | $950 | $1.36 | 14d | 1 | 1.18mi |
| 1125 N 9th St Unit 1379032P Milwaukee, WI | 2.0 | 1.0 | 731 | $2,975 | $4.07 | 1d | 1 | 1.19mi |
| 1125 N 9th St Unit 1379037P Milwaukee, WI | 2.0 | 1.0 | 731 | $2,717 | $3.72 | 43d | 1 | 1.19mi |
| 1125 N 9th St Unit 1379036P Milwaukee, WI | 2.0 | 1.0 | 731 | $3,063 | $4.19 | 23d | 1 | 1.19mi |
| 2251 N 41st St Unit Lower Milwaukee, WI | 3.0 | 1.0 | 1187 | $1,198 | $1.01 | 14d | 1 | 1.19mi |
| 2870 N 29th St #2872 Milwaukee, WI | 3.0 | 1.0 | 1300 | $1,250 | $0.96 | 43d | 1 | 1.24mi |
Listing history 18 events
-
2026-06-18days on market $139,900 Active 62 DOM
-
2026-06-17days on market $139,900 Active 61 DOM
-
2026-06-16days on market $139,900 Active 60 DOM
-
2026-06-15days on market $139,900 Active 59 DOM
-
2026-06-13days on market $139,900 Active 57 DOM
-
2026-06-13days on market $139,900 Active 56 DOM
-
2026-06-09days on market $139,900 Active 53 DOM
-
2026-06-08days on market $139,900 Active 52 DOM
-
2026-06-07days on market $139,900 Active 51 DOM
-
2026-06-05days on market $139,900 Active 48 DOM
-
2026-06-03days on market $139,900 Active 47 DOM
-
2026-06-02days on market $139,900 Active 46 DOM
-
2026-06-01days on market $139,900 Active 45 DOM
-
2026-05-31days on market $139,900 Active 44 DOM
-
2026-04-24price $139,900 164-char remark
Show marketing remark (164 chars)
Built in 1999 this 3BR colonial home has much to offer with newer construction. Long time rental home is occupied. Parking in the back. Priced under assessed value!
-
2026-04-17$149,900 Active 164-char remark
Show marketing remark (164 chars)
Built in 1999 this 3BR colonial home has much to offer with newer construction. Long time rental home is occupied. Parking in the back. Priced under assessed value!
-
2014-05-22$29,999 98-char remark
Show marketing remark (98 chars)
Great Owner Occupied or investtor. Property in need of minor updating. Price below city assessment
-
2014-05-21soldstatus $31,000 98-char remark
Show marketing remark (98 chars)
Great Owner Occupied or investtor. Property in need of minor updating. Price below city assessment
ⓘ Source: listings_history table (triggers on properties + properties_extension) + one-shot
backfill from property_details.listing_events for pre-trigger history.
Tax reassessment forecast WI · Partial reset (capped growth)
- Current annual tax
- $2,128 · $177/mo
- Projected year-2 tax
- $2,358 · $196/mo
- Expected delta
- +$230/yr (+$19/mo · 10.8%)
ⓘ Screening estimate from a state-policy table — verify with the county assessor before closing.
Climate risk First Street
- Flood 1/10 Low FEMA zone X (unshaded) · 0% chance over 30 yrs
- Wildfire 1/10 Low
- Heat 2/10 Low 7 d/yr ≥98°F today · 13 d/yr by 30 yrs out
- Wind 2/10 Low
- Air quality 3/10 Moderate 3 unhealthy d/yr today · 4 by 30 yrs out
Nearby sold comps map
Loading sold comps map…
Walkable amenities ~0.75 mi
Loading nearby amenities…
Taxation est. · year 1
- Rental income
- $16,728
- − Mortgage interest
- −$7,837
- − Property taxes
- −$2,128
- − Insurance
- −$700
- − Repairs & maintenance
- −$1,338
- − Management
- −$1,338
- − Depreciation
- −$4,070
- Taxable loss
- −$682
- Est. tax savings @ 24.0%
- +$164
- After-tax cash flow
- $1,748/yr
For passive investors: Depreciation is non-cash, so a rental often shows a tax loss while cash-flowing — sheltering income. Rental losses are passive: they offset passive income freely, and up to $25,000/yr can offset ordinary (W-2) income if you actively participate and your MAGI is under $100k (phasing out to $0 by $150k); unused losses carry forward. On sale, claimed depreciation is recaptured at up to 25%, and gains may owe capital-gains tax (a 1031 exchange can defer both). Figures are a year-1 estimate at your 24.0% rate — not tax advice; consult a CPA.
Schools (NCES district)
- District
- Milwaukee School District
- NCES district ID
- 5509600
- Math proficiency
- 10% ▼ -5.00%
- Reading proficiency
- 18% ▬ 0.00%
- Median HH income
- $36,339
- Composite
- 11.61/100
- National rank
- #9696
- State rank
- #337 of 342 in WI
Livability — Milwaukee
- Score
- 81/100
- State rank
- #55
- US rank
- #1534
Category grades
Schools grade is shown separately in the Schools card above.
Census & demographics
- Census place
- Milwaukee, WI
- County
- Milwaukee County · 926,379 people
- City population
- 573,768
- Metro
- Milwaukee-Waukesha, WI
- Population (ZIP)
- 9,265
- Household income
- $31,529
- Rent vs Own
- Severe rent burden
- 636.0
Population outlook (Milwaukee County) Hauer SSP2
- Today (2025)
- 995,758 people
- By 2030
- 1,009,124 · +1.3%
- By 2040
- 1,028,128 · +3.3%
- By 2050
- 1,040,066 · +4.4%
- By 2075
- 1,057,849 · +6.2%
- By 2100
- 1,039,774 · +4.4%
Race, ethnicity, and origin ACS 2023
- Neighborhood character
- Predominantly Black (80%)
- Race & ethnicity
- Black 80% Asian 7% White 6% Hispanic / Latino 6% Two or more races 3%
- Hispanic origin (detail)
- Mexican 4%
- Common ancestry
- Portuguese 1% Lithuanian 1% Swedish 1%
- Foreign-born
- 6% · Canada
- Languages at home
- 88% English-only · Other Asian/Pacific 5% Spanish 5%
Political lean MEDSL · Milwaukee
- 2024 margin
- Solid D (+38.5) · D 68.3% · R 29.8% · Other 1.8%
- 2008→2024 swing
- +2.7pp toward D · 2008: 35.9pp · 2024: 38.5pp
- All cycles
- 2024: D+38.5 2020: D+39.9 2016: D+37.5 2012: D+34.6 2008: D+35.9
Not yet ingested
- Civics
- —
Market trends
- HPI YoY
- ▲ 3.02%
- Current HPI
- 363.0038
- Rent YoY
- —
- Metro
- Milwaukee-Waukesha, WI
- State GDP YoY
- ▲ 2.10%
- F500 in state
- 20
Industry mix (Fortune 500 HQ in WI)
| Industry | F500 HQs | Revenue |
|---|---|---|
| Industrial Machinery | 4 | $23B |
|
||
| Industrial Technology | 2 | $36B |
|
||
| Insurance | 1 | $36B |
|
||
| Professional Services | 1 | $19B |
|
||
| Utilities | 1 | $9B |
|
||
| Consumer Goods | 1 | $3B |
|
||
Price history
+351.3% since first listed4 events — show timeline
- 2026-04-24 Price Changed $139,900 METROMLS
- 2026-04-17 Listed $149,900 METROMLS
- 2014-05-22 Listed $29,999 METROMLS
- 2014-05-21 Sold (MLS) $31,000 METROMLS
Property tax history
+1.4%/yrLatest (2024): $2,128 · +13.7% YoY. Source: county tax records.
Cash-flow waterfall
monthlySold comps — $/sqft
last 12 mo · ≤1 miLoading sold comps…