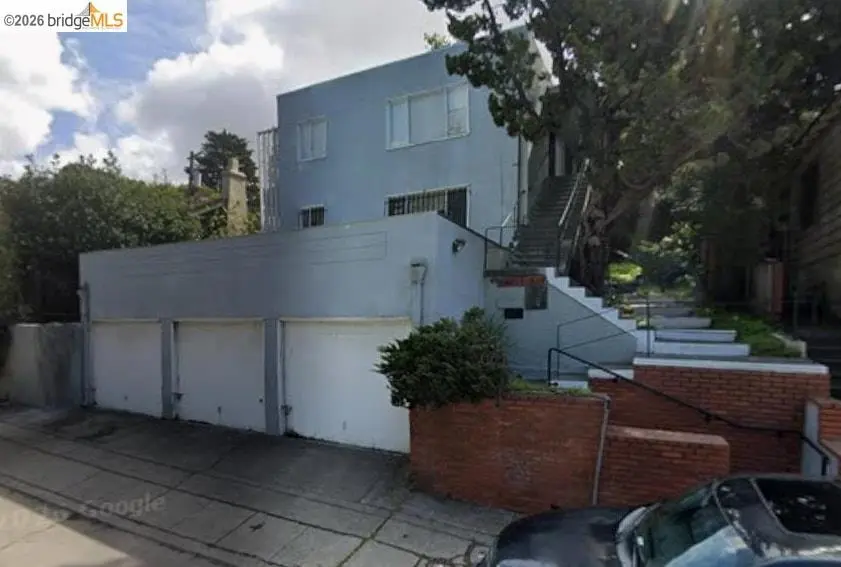
 Fourplex
3562 Seminary Ave · Oakland, CA
Flood risk 3/10 · Minor
- FEMA flood zone
- X (unshaded)
- Chance of flooding over 30 yrs
- 0.2%
- Est. flood insurance / yr
- $507 – $1,088
Fire risk 2/10 · Minimal
- Est. fire insurance / yr
- $659 – $1,223
Heat risk 3/10 · Minor
- Hot days now (above 86°F)
- 7 days/yr
- Hot days in 30 yrs
- 14 days/yr
Wind risk 1/10 · Minimal
- Chance of severe wind over 30 yrs
- —
Air-quality risk 8/10 · Major
- Unhealthy air days now
- 14 days/yr
- Unhealthy air days in 30 yrs
- 14 days/yr
Risk factors via First Street. Map © Google.
Why this score? — see what drove the B grade
The composite is a weighted blend of 9 inputs, each scored 0–100. Each bar is that input's sub-score; the figure is the points it added to the 100-point composite (weight × sub-score).
- Cash flow +27.5/30.0
- ARV discount +15.0/15.0
- DSCR +9.7/10.0
- 1% rule +7.5/10.0
- Livability +3.6/5.0
- Schools +3.0/10.0
- Rent growth +2.7/5.0
- Condition / age +2.5/5.0
- Appreciation +0.0/10.0
$900,000
🖨 Deal sheet 📄 Offer letter ✓ Due diligence
Multi-family units
County records classify this as Multi-Family (2-4 Unit). Listing-text estimate: 4 units. confirmed
Listing remarks
Beautifully situated in Oakland’s Millsmont neighborhood, this fourplex offers a great investment opportunity with convenient access to Interstate 580 for easy commuting. Conveniently located near shopping, schools, parks, public transportation, and Oakland International Airport.
Key facts
- Near schools
- Near shopping
- Convenient access
Tags
Property features AI
Finance
- Other: Building total area approximately 2,652 (area units available but not listed in interior/exterior per instructions); Lot approximately 0.14 acres
- Financial info: No financial details provided
- HOA & community: No HOA information provided
Exterior
- Parking: Attached parking; Total of 3 parking spaces
- Security: No security features listed
- Utilities: Public water; Public sewer
- Home design: Residential income property (quadruplex); Built in 1951
- Construction: Brick construction
- Exterior features: Front yard; Side yard
Interior
- Kitchen: No specific kitchen appliance list provided
- Bedrooms: 4-unit property (individual unit bedroom counts not provided)
- Flooring: No flooring information provided
- Bathrooms: Each unit has 1 bathroom (4 total)
- Heating & cooling: Electric heating; No air conditioning
- Interior features: Gas water heater
- Laundry & utility: No laundry or utility appliances listed
Neighborhood map
What this means for you Summary
Snapshot
- This is a 4 × 4-bed/4.0-bath units multifamily listed at $900k.
Deal economics
- At list price, monthly cash flow is $3k ($32k/yr) — positive. Per door: $667/mo.
- The deal already cash-flows at list — no discount required.
- Meets the 1% rule at list price ($11k rent vs $900k).
- Recommended offer: $886k (1.5% below list) — sets the bar for market timing.
- Cap rate 9.9% vs local median 2.4% in Oakland — top-decile yield for the area; either an underpriced asset or a hidden risk that comps aren't pricing in. Stress-test before assuming the spread holds.
Location & tenants
- Location reads 71/100 on livability (#224 in CA) — a middle-class / working-renter tenant base. Strengths: amenities A+, commute A+, employment A+; Watch: schools C-, crime F, cost of living F.
- Oakland Unified (urban): math 27% / reading 33% proficiency, ranked #1,007 of 1,400 in CA (top 72%) — families likely to look elsewhere, expect single-tenant / working-renter base with shorter leases; 68% free/reduced lunch — lower-income household profile, screen leases tightly.
- Market conditions: Rents flat; 186 active listings in the ZIP; 7 comparable units currently listed for rent nearby; rentals at typical pace (median 24d on market — plan ~3-4 weeks tenant-placement turnaround); 43% of comp listings sitting > 30 days — soft ceiling on asking rent; solid renter incomes; 1,742 units permitted in Alameda County in 2024 (856 in 5+ unit buildings).
- At $11,280/mo this rent would consume 128% of the median local household income ($106k/yr) (locally 2086% of renters already pay >50% of income on rent) — very limited rent-growth headroom before tenants either downsize or default.
Forward outlook
- Local home prices are declining (-3.0%/yr); year-one equity from $6k of loan paydown is wiped out by about $27k of value loss. Plan a longer hold.
- Alameda County population projected at +34% by 2050 — long-run rental-demand tailwind backs the buy-and-hold thesis.
Negotiation context
- It's been on market 17 days — a 2% lower offer ($886k) is reasonable based on typical stale-listing flexibility.
- 4 sale attempts; this cycle's ask is 38% above the opening price — seller raised mid-cycle; expect resistance to lowballs.
Risks & watch-outs
- Watch-outs: built in 1951 — expect roof / HVAC / electrical / plumbing capex.
Questions for the listing agent
- Can we see the unit-by-unit rent roll, current vacancy, and any below-market leases? What's the average tenancy length?
- What capital expenditures (roof, boiler, parking lot, exteriors) have been made in the last 5 years, and what's planned in the next 2?
- Built in 1951 — when were the roof, HVAC, electrical panel, plumbing, and water heater last replaced?
- Is there a deadline driving the sale (1031 exchange, divorce, estate, relocation)? That informs how much negotiation room exists.
- Crime grade is F in this area — have there been break-ins, vandalism, or insurance claims at this property in the last 3 years? What carrier currently insures it and at what premium?
- What's the average days-on-market for RENTAL listings here right now (not sales)? A rising rental-DOM trend means longer vacancies and softer asking-rent achievability than the comps imply.
- What's the recent tenant-quality profile in this submarket — average credit score on applications, eviction rate, late-payment / NSF rate, and stable-employment percentage? A property-management company in the area should have these aggregated.
- How much new apartment / multifamily construction is in the pipeline within 1–3 miles? Heavy new supply (>2% of stock underway) typically softens rents 12–24 months out; light construction supports rent growth.
Investment metrics
- 1% rule
- 1.25% ✓
- Cap rate
- 9.85%
- Cash-on-cash
- 12.71%
- DSCR
- 1.57
- GRM
- 6.6
CMA / ARV
- ARV (on-the-fly)
- $1,150,968
- Comps found
- 2
Show comp detail 2 sales within ~0.75 mi
| Address | Dist | Beds/Ba | Sqft | Sold | Price | $/sf | Match |
|---|---|---|---|---|---|---|---|
| 3440 Seminary Ave | 0.12mi | 5/3.0 (+1) | 2,488 (-6%) | 8mo | $675,000 | $271 | 69 |
| 3835 Buell St | 0.60mi | 4/5.0 | 2,273 (-14%) | 12mo | $987,000 | $434 | 34 |
Match score weights: distance 35% · size 25% · config 20% · recency 20%. Top-matched comps best support the ARV.
Projected returns pro-forma
-3.0% appreciation · 0.65% rent growth · sell at horizon
- IRR
- -0.2%
- Equity multiple
- 0.99×
- Total profit
- $-1,696
- Equity at exit
- $134,193
- IRR
- 6.9%
- Equity multiple
- 1.46×
- Total profit
- $116,178
- Equity at exit
- $77,816
Cash invested: $252,000 (down + closing). Projections, not guarantees.
Landlord ↔ Tenant lean methodology
- Overall (CITY)
- 0 Strongly Tenant-Friendly
- State California
- 18 Strongly Tenant-Friendly · D+13
- County
- — inherits STATE
- City Oakland
- 0 Strongly Tenant-Friendly · D+62
ZIP-level market 94605
- Rents YoY
- 0.7%
- Active inventory
- 186
- Price-to-rent
- 26.6×
Monthly cashflow live
- Estimated rent
- $11,280 medium interval (Pro) →
- Mortgage (P&I)
- −$4,720
- Tax from tax record
- −$1,147 /mo · $13,764/yr
- Insurance
- −$375
- HOA
- −$0
- Vacancy / Maint / Mgmt
- −$2,369
- Net cashflow
- $2,669
Break-even live
4-unit breakdown (identical units grouped — click to expand)
| Units | Beds | Baths | Est. rent |
|---|---|---|---|
| 4× units | 4 | 4 | $11,280 |
| #1 | 4 | 4 | $2,820 |
| #2 | 4 | 4 | $2,820 |
| #3 | 4 | 4 | $2,820 |
| #4 | 4 | 4 | $2,820 |
| Total (4 units) | $11,280 | ||
UW: 25.0% down · 7.5% · 30yr · 1.5% tax · 5.0% vac · 8.0% maint · 8.0% mgmt
Financing live
Cash to close
- Down payment
- $225,000
- Closing costs
- $27,000
- Reserves months
- —
- Total cash needed
- —
Loan-product check · same deal, 3 products live
Conventional
25% down · 7.5% · 30yr
- Down + closing
- —
- Monthly P&I
- —
- Monthly cashflow
- —
- DSCR
- —
- Eligible?
- —
Personal DTI + credit; lowest rate.
DSCR
20% down · 8.5% · 30yr
- Down + closing
- —
- Monthly P&I
- —
- Monthly cashflow
- —
- DSCR
- —
- Eligible?
- —
No personal income docs; deal must DSCR.
Hard money
10% down · 12.0% · 12mo
- Down + closing
- —
- Monthly P&I
- —
- Monthly cashflow
- —
- DSCR
- —
- Eligible?
- —
Short-term bridge; refi at stabilization.
Rent comps 7 comps
| Address | Beds | Baths | Sqft | Rent | $/sqft | DOM | Units | Dist |
|---|---|---|---|---|---|---|---|---|
| 5875 Picardy Dr Oakland, CA | 4.0 | 2.5 | 1906 | $5,200 | $2.73 | 43d | 1 | 0.57mi |
| 5307 Hillen Dr Oakland, CA | 3.0 | 2.0 | 1831 | $3,895 | $2.13 | 5d | 1 | 0.76mi |
| 6252 Ridgemont Dr Oakland, CA | 3.0 | 2.5 | 1885 | $5,495 | $2.92 | 1d | 1 | 0.85mi |
| 4254 Gregory St Oakland, CA | 3.0 | 3.0 | 1949 | $4,500 | $2.31 | 43d | 1 | 0.99mi |
| 6297 Rocky Point Ct Oakland, CA | 4.0 | 4.0 | 2513 | $4,750 | $1.89 | 1d | 1 | 1.01mi |
| 6492 Bayview Dr Oakland, CA | 4.0 | 3.0 | 2349 | $4,999 | $2.13 | 24d | 1 | 1.03mi |
| 7625 Lockwood St Oakland, CA | 5.0 | 3.0 | 2115 | $1,199 | $0.57 | 43d | 1 | 1.23mi |
Listing history 17 events
-
2026-06-13days on market $900,000 Active 17 DOM
-
2026-06-13days on market $900,000 Active 16 DOM
-
2026-06-09days on market $900,000 Active 13 DOM
-
2026-06-08days on market $900,000 Active 12 DOM
-
2026-06-07pricedays on market $900,000 Active 11 DOM
-
2026-06-04days on market $650,000 Active 8 DOM
-
2026-06-03days on market $650,000 Active 7 DOM
-
2026-06-02days on market $650,000 Active 6 DOM
-
2026-06-01days on market $650,000 Active 5 DOM
-
2026-05-31days on market $650,000 Active 4 DOM
-
2026-05-27$650,000 Active
-
2026-01-14historical $1,499
-
2026-01-01$1,499
-
2025-12-21historical $1,499
-
2025-12-18$1,499
-
2025-11-23historical $1,499
-
2025-11-06$1,499
ⓘ Source: listings_history table (triggers on properties + properties_extension) + one-shot
backfill from property_details.listing_events for pre-trigger history.
Tax reassessment forecast CA · Resets to sale price
- Current annual tax
- $13,764 · $1,147/mo
- Projected year-2 tax
- $13,764 · $1,147/mo
- Expected delta
- $0/yr ($0/mo · 0.0%)
ⓘ Screening estimate from a state-policy table — verify with the county assessor before closing.
Climate risk First Street
- Flood 3/10 Moderate FEMA zone X (unshaded) · 20% chance over 30 yrs
- Wildfire 2/10 Low
- Heat 3/10 Moderate 7 d/yr ≥86°F today · 14 d/yr by 30 yrs out
- Wind 1/10 Low
- Air quality 8/10 Severe 14 unhealthy d/yr today · 14 by 30 yrs out
Nearby sold comps map
Loading sold comps map…
Walkable amenities ~0.75 mi
Loading nearby amenities…
Taxation est. · year 1
- Rental income
- $135,360
- − Mortgage interest
- −$50,414
- − Property taxes
- −$13,764
- − Insurance
- −$4,500
- − Repairs & maintenance
- −$10,829
- − Management
- −$10,829
- − Depreciation
- −$26,182
- Taxable income
- $18,842
- Est. tax owed @ 24.0%
- −$4,522
- After-tax cash flow
- $27,511/yr
For passive investors: Depreciation is non-cash, so a rental often shows a tax loss while cash-flowing — sheltering income. Rental losses are passive: they offset passive income freely, and up to $25,000/yr can offset ordinary (W-2) income if you actively participate and your MAGI is under $100k (phasing out to $0 by $150k); unused losses carry forward. On sale, claimed depreciation is recaptured at up to 25%, and gains may owe capital-gains tax (a 1031 exchange can defer both). Figures are a year-1 estimate at your 24.0% rate — not tax advice; consult a CPA.
Schools (NCES district)
- District
- Oakland Unified
- NCES district ID
- 0628050
- Math proficiency
- 27% ▬ 0.00%
- Reading proficiency
- 33% ▬ 0.00%
- Median HH income
- $55,194
- Composite
- 29.52/100
- National rank
- #11769
- State rank
- #1007 of 1400 in CA
Livability — Oakland
- Score
- 71/100
- State rank
- #224
- US rank
- #7245
Category grades
Schools grade is shown separately in the Schools card above.
Census & demographics
- Census place
- Oakland, CA
- County
- Alameda County · 1,614,355 people
- City population
- 385,993
- Metro
- San Francisco-Oakland-Berkeley, CA
- Population (ZIP)
- 44,103
- Household income
- $106,068
- Rent vs Own
- Severe rent burden
- 2086.0
Population outlook (Alameda County) Hauer SSP2
- Today (2025)
- 1,928,884 people
- By 2030
- 2,069,146 · +7.3%
- By 2040
- 2,338,405 · +21.2%
- By 2050
- 2,586,608 · +34.1%
- By 2075
- 3,061,911 · +58.7%
- By 2100
- 3,234,133 · +67.7%
Race, ethnicity, and origin ACS 2023
- Neighborhood character
- Highly diverse neighborhood (Simpson 0.73)
- Race & ethnicity
- Black 40% Hispanic / Latino 27% White 17% Two or more races 11% Asian 9%
- Hispanic origin (detail)
- Mexican 18% Puerto Rican 1%
- Common ancestry
- Italian 2% Lithuanian 1% Romanian 1%
- Foreign-born
- 20% · Canada, China, Vietnam
- Languages at home
- 70% English-only · Spanish 21% Chinese 2% Other Asian/Pacific 2%
Political lean MEDSL · Alameda
- 2024 margin
- Solid D (+53.6) · D 74.6% · R 21.0% · Other 4.4%
- 2008→2024 swing
- -5.9pp toward R · 2008: 59.5pp · 2024: 53.6pp
- All cycles
- 2024: D+53.6 2020: D+62.5 2016: D+64.4 2012: D+59.8 2008: D+59.5
Not yet ingested
- Civics
- —
Market trends
- HPI YoY
- ▼ -793.09%
- Current HPI
- 294.5467
- Rent YoY
- ▲ 0.65%
- Metro
- San Francisco-Oakland-Berkeley, CA
- State GDP YoY
- ▲ 3.21%
- F500 in state
- 116
Industry mix (Fortune 500 HQ in CA)
| Industry | F500 HQs | Revenue |
|---|---|---|
| Technology | 27 | $1,492B |
|
||
| Financial Services | 3 | $174B |
|
||
| Retail | 3 | $44B |
|
||
| Insurance | 3 | $26B |
|
||
| Media / Entertainment | 2 | $115B |
|
||
| Pharmaceuticals / Biotech | 2 | $62B |
|
||
Price history
+43262.2% since first listed7 events — show timeline
- 2026-05-27 Listed $650,000 bridgeMLS, Bay East AOR, or Contra Costa AOR
- 2026-01-14 Rental Removed $1,499 BRIDGEMLS
- 2026-01-01 Listed for Rent $1,499 BRIDGEMLS
- 2025-12-21 Rental Removed $1,499 BRIDGEMLS
- 2025-12-18 Listed for Rent $1,499 BRIDGEMLS
- 2025-11-23 Rental Removed $1,499 BRIDGEMLS
- 2025-11-06 Listed for Rent $1,499 BRIDGEMLS
Property tax history
+10.1%/yrLatest (2025): $13,764 · +155.0% YoY. Source: county tax records.
Cash-flow waterfall
monthlySold comps — $/sqft
last 12 mo · ≤1 miLoading sold comps…