 5-Plex
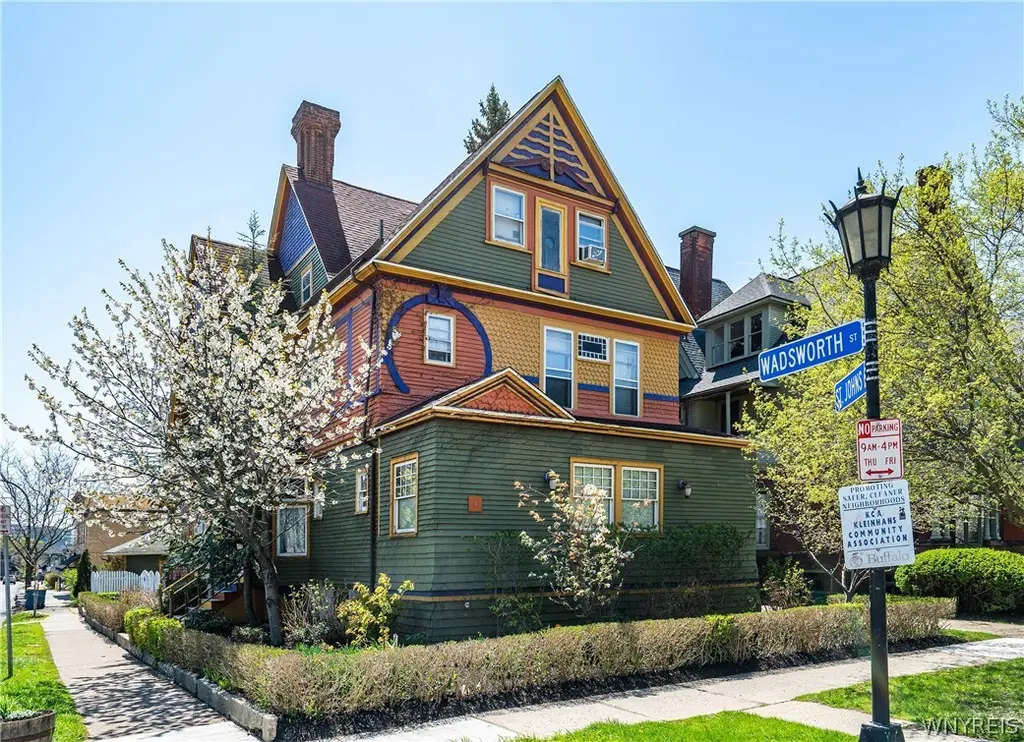
4 Saint Johns Pl · Buffalo, NY
Flood risk 1/10 · Minimal
- FEMA flood zone
- X (unshaded)
- Chance of flooding over 30 yrs
- 0.0%
- Est. flood insurance / yr
- $473 – $860
Fire risk 1/10 · Minimal
- Est. fire insurance / yr
- $691 – $1,283
Heat risk 3/10 · Minor
- Hot days now (above 91°F)
- 7 days/yr
- Hot days in 30 yrs
- 15 days/yr
Wind risk 1/10 · Minimal
- Chance of severe wind over 30 yrs
- —
Air-quality risk 4/10 · Minor
- Unhealthy air days now
- 4 days/yr
- Unhealthy air days in 30 yrs
- 9 days/yr
Risk factors via First Street. Map © Google.
Why this score? — see what drove the B+ grade
The composite is a weighted blend of 9 inputs, each scored 0–100. Each bar is that input's sub-score; the figure is the points it added to the 100-point composite (weight × sub-score).
- Cash flow +30.0/30.0
- ARV discount +15.0/15.0
- DSCR +10.0/10.0
- 1% rule +8.5/10.0
- Livability +3.9/5.0
- Condition / age +3.8/5.0
- Rent growth +3.6/5.0
- Schools +3.3/10.0
- Appreciation +0.0/10.0
$545,000
🖨 Deal sheet 📄 Offer letter ✓ Due diligence
Multi-family units
County records classify this as Multi-Family (5+ Unit). Listing-text estimate: 5 units. confirmed
5+ unit building — per-unit beds/baths from public records are typically unavailable; the breakdown below (if shown) is an estimate from the listing text.
Listing remarks MLS
Exceptional 5 unit opportunity on the desirable street of Saint Johns Place in the heart of Allentown! This well-maintained 5-unit property consists of one studio, three one bedroom apartments and a two bedroom owners unit on the top floor, offering a strong and flexible unit mix. Boasting an 1870 built date, the property still maintains many charming characteristics- a colorful and vibrant exterior, stained glass and natural woodwork, and high ceilings inside. Inside each unit, many updates have been done including newer kitchen cabinets, appliances-including dishwashers, updated bathrooms, and updated flooring. This property is investor ready showing a solid cap rate or the perfect place to have your tenants pay your mortgage while you occupy the top floor as an owner's suite. The two garage offers a rare and valuable amenity in this area—providing added convenience and rental appeal. Whether you’re looking to expand your portfolio or owner-occupy while generating income, this property presents a compelling opportunity with upside potential through rent growth and value-add improvements. All in one of Buffalo’s most vibrant and desirable neighborhoods!
Key facts
- 4,445 sq ft lot
- 2 parking spots
- Built 1870
Neighborhood map
What this means for you Summary
Snapshot
- This is a 4×1bd/1ba + 1×2bd/1ba units multifamily listed at $545k. Condition is rated good.
Deal economics
- At list price, monthly cash flow is $2k ($24k/yr) — positive. Per door: $406/mo.
- The deal already cash-flows at list — no discount required.
- Meets the 1% rule at list price ($7k rent vs $545k).
- Recommended offer: $529k (3.0% below list) — sets the bar for market timing.
- Cap rate 10.8% vs local median 8.0% in Buffalo — top-decile yield for the area; either an underpriced asset or a hidden risk that comps aren't pricing in. Stress-test before assuming the spread holds.
Location & tenants
- Location reads 77/100 on livability (#195 in NY, #3,011 nationally) — a middle-class / working-renter tenant base. Strengths: commute A+, housing A+, health & safety A+; Watch: crime F, employment D-.
- Buffalo City School District (urban): math 41% / reading 40% proficiency, ranked #535 of 590 in NY (top 91%) — families likely to look elsewhere, expect single-tenant / working-renter base with shorter leases; 75% free/reduced lunch — lower-income household profile, screen leases tightly.
- Market conditions: Rents rising fast (+4.3%/yr); 56 active listings in the ZIP; lower-income renter base — watch delinquency; 1,244 units permitted in Erie County in 2024 (563 in 5+ unit buildings).
- At $7,337/mo this rent would consume 217% of the median local household income ($41k/yr) (locally 1213% of renters already pay >50% of income on rent) — very limited rent-growth headroom before tenants either downsize or default.
Forward outlook
- Local home prices are declining (-3.0%/yr); year-one equity from $4k of loan paydown is wiped out by about $16k of value loss. Plan a longer hold.
- At projected returns (-3.0% appreciation + 4.3% rent growth), your $153k cash investment doubles in ~7 years — after that, you're playing with house money.
Negotiation context
- It's been on market 42 days — a 3% lower offer ($529k) is reasonable based on typical stale-listing flexibility.
- 4 sale attempts since 16y ago; this cycle's ask has dropped $30k (5%) from the opening price — seller is motivated, your offer sets the floor, not the list.
- Current owner paid $444k; 23% above their basis — modest negotiation headroom, anchor on the comps not their cost.
Risks & watch-outs
- Watch-outs: built in 1870 — expect roof / HVAC / electrical / plumbing capex.
Questions for the listing agent
- It's been on market 42 days. Have you received any prior offers? Is the seller open to a 3% concession, seller financing, or rate buy-down credit?
- Can we see the unit-by-unit rent roll, current vacancy, and any below-market leases? What's the average tenancy length?
- What capital expenditures (roof, boiler, parking lot, exteriors) have been made in the last 5 years, and what's planned in the next 2?
- Built in 1870 — when were the roof, HVAC, electrical panel, plumbing, and water heater last replaced?
- Is there a deadline driving the sale (1031 exchange, divorce, estate, relocation)? That informs how much negotiation room exists.
- Crime grade is F in this area — have there been break-ins, vandalism, or insurance claims at this property in the last 3 years? What carrier currently insures it and at what premium?
- What's the average days-on-market for RENTAL listings here right now (not sales)? A rising rental-DOM trend means longer vacancies and softer asking-rent achievability than the comps imply.
- What's the recent tenant-quality profile in this submarket — average credit score on applications, eviction rate, late-payment / NSF rate, and stable-employment percentage? A property-management company in the area should have these aggregated.
- How much new apartment / multifamily construction is in the pipeline within 1–3 miles? Heavy new supply (>2% of stock underway) typically softens rents 12–24 months out; light construction supports rent growth.
Investment metrics
- 1% rule
- 1.35% ✓
- Cap rate
- 10.76%
- Cash-on-cash
- 15.96%
- DSCR
- 1.71
- GRM
- 6.2
CMA / ARV
- ARV (median comp)
- $830,952
- List price
- $545,000
- Delta
- -34.41%
- Verdict
- UNDERPRICED
- Comps
- 20 within 1.0 mi
Projected returns pro-forma
-3.0% appreciation · 4.28% rent growth · sell at horizon
- IRR
- 8.3%
- Equity multiple
- 1.33×
- Total profit
- $50,649
- Equity at exit
- $81,261
- IRR
- 18.6%
- Equity multiple
- 2.65×
- Total profit
- $251,332
- Equity at exit
- $47,122
Cash invested: $152,600 (down + closing). Projections, not guarantees.
Landlord ↔ Tenant lean methodology
- Overall (STATE)
- 15 Strongly Tenant-Friendly
- State New York
- 15 Strongly Tenant-Friendly · D+10
- County
- — inherits STATE
- City
- — inherits STATE
ZIP-level market 14201
- Home prices YoY
- -19.1%
- Rents YoY
- 4.3%
- Active inventory
- 56
- Price-to-rent
- 31.3×
Monthly cashflow live
- Estimated rent
- $7,337 high interval (Pro) →
- Mortgage (P&I)
- −$2,858
- Tax est. 1.5%
- −$681 /mo · $8,175/yr
- Insurance
- −$227
- HOA
- −$0
- Vacancy / Maint / Mgmt
- −$1,541
- Net cashflow
- $2,030
Break-even live
5-unit breakdown (identical units grouped — click to expand)
| Units | Beds | Baths | Est. rent |
|---|---|---|---|
| 4× units | 1 | 1 | $5,796 |
| #1 | 1 | 1 | $1,449 |
| #2 | 1 | 1 | $1,449 |
| #3 | 1 | 1 | $1,449 |
| #4 | 1 | 1 | $1,449 |
| 1× unit | 2 | 1 | $1,541 |
| Total (5 units) | $7,337 | ||
UW: 25.0% down · 7.5% · 30yr · 1.5% tax · 5.0% vac · 8.0% maint · 8.0% mgmt
Financing live
Cash to close
- Down payment
- $136,250
- Closing costs
- $16,350
- Reserves months
- —
- Total cash needed
- —
Loan-product check · same deal, 3 products live
Conventional
25% down · 7.5% · 30yr
- Down + closing
- —
- Monthly P&I
- —
- Monthly cashflow
- —
- DSCR
- —
- Eligible?
- —
Personal DTI + credit; lowest rate.
DSCR
20% down · 8.5% · 30yr
- Down + closing
- —
- Monthly P&I
- —
- Monthly cashflow
- —
- DSCR
- —
- Eligible?
- —
No personal income docs; deal must DSCR.
Hard money
10% down · 12.0% · 12mo
- Down + closing
- —
- Monthly P&I
- —
- Monthly cashflow
- —
- DSCR
- —
- Eligible?
- —
Short-term bridge; refi at stabilization.
Listing history 21 events
-
2026-06-18days on market $545,000 Active 42 DOM
-
2026-06-17days on market $545,000 Active 41 DOM
-
2026-06-16days on market $545,000 Active 40 DOM
-
2026-06-15days on market $545,000 Active 39 DOM
-
2026-06-13days on market $545,000 Active 37 DOM
-
2026-06-13days on market $545,000 Active 36 DOM
-
2026-06-10days on market $545,000 Active 34 DOM
-
2026-06-09days on market $545,000 Active 33 DOM
-
2026-06-08days on market $545,000 Active 32 DOM
-
2026-06-07days on market $545,000 Active 31 DOM
-
2026-06-03days on market $545,000 Active 27 DOM
-
2026-06-02pricedays on market $545,000 Active 26 DOM
-
2026-06-01days on market $575,000 Active 25 DOM
-
2026-05-31days on market $575,000 Active 24 DOM
-
2026-05-07$575,000 Active 1190-char remark
Show marketing remark (1190 chars)
Exceptional 5 unit opportunity on the desirable street of Saint Johns Place in the heart of Allentown! This well-maintained 5-unit property consists of one studio, three one bedroom apartments and a two bedroom owners unit on the top floor, offering a strong and flexible unit mix. Boasting an 1870 built date, the property still maintains many charming characteristics- a colorful and vibrant exterior, stained glass and natural woodwork, and high ceilings inside. Inside each unit, many updates have been done including newer kitchen cabinets, appliances-including dishwashers, updated bathrooms, and updated flooring. This property is investor ready showing a solid cap rate or the perfect place to have your tenants pay your mortgage while you occupy the top floor as an owner's suite. The two garage offers a rare and valuable amenity in this area—providing added convenience and rental appeal. Whether you’re looking to expand your portfolio or owner-occupy while generating income, this property presents a compelling opportunity with upside potential through rent growth and value-add improvements. All in one of Buffalo’s most vibrant and desirable neighborhoods!
-
2016-04-20soldstatus $444,000 Closed Sale or Rented
-
2015-12-30historical Under Contract- Do Not Show
-
2015-06-05$479,000 Active
-
2014-09-18$489,000
-
2010-11-09soldstatus $75,000
-
2010-08-30$99,900
ⓘ Source: listings_history table (triggers on properties + properties_extension) + one-shot
backfill from property_details.listing_events for pre-trigger history.
Climate risk First Street
- Flood 1/10 Low FEMA zone X (unshaded) · 0% chance over 30 yrs
- Wildfire 1/10 Low
- Heat 3/10 Moderate 7 d/yr ≥91°F today · 15 d/yr by 30 yrs out
- Wind 1/10 Low
- Air quality 4/10 Moderate 4 unhealthy d/yr today · 9 by 30 yrs out
Nearby sold comps map
Loading sold comps map…
Walkable amenities ~0.75 mi
Loading nearby amenities…
Taxation est. · year 1
- Rental income
- $88,044
- − Mortgage interest
- −$30,528
- − Property taxes
- −$8,175
- − Insurance
- −$2,725
- − Repairs & maintenance
- −$7,044
- − Management
- −$7,044
- − Depreciation
- −$15,855
- Taxable income
- $16,674
- Est. tax owed @ 24.0%
- −$4,002
- After-tax cash flow
- $20,357/yr
For passive investors: Depreciation is non-cash, so a rental often shows a tax loss while cash-flowing — sheltering income. Rental losses are passive: they offset passive income freely, and up to $25,000/yr can offset ordinary (W-2) income if you actively participate and your MAGI is under $100k (phasing out to $0 by $150k); unused losses carry forward. On sale, claimed depreciation is recaptured at up to 25%, and gains may owe capital-gains tax (a 1031 exchange can defer both). Figures are a year-1 estimate at your 24.0% rate — not tax advice; consult a CPA.
Condition & rehab AI · 2 photos
This 5-unit property is investor-ready with updated interiors and a well-maintained exterior. Minor cosmetic improvements can further enhance its curb appeal and value.
Value-add opportunities
- Both Paint exterior — Enhances curb appeal and value
- Both Landscaping improvements — Enhances curb appeal and value
- Both Replace worn flooring — Improves aesthetics and functionality
Renovation cost estimate screening
Value-add ROI direction
- Both Paint exterior — Enhances curb appeal and value ↑
- Both Landscaping improvements — Enhances curb appeal and value ↑
- Both Replace worn flooring — Improves aesthetics and functionality ↑
ⓘ Cost ranges are severity-bucket heuristics (US national rule-of-thumb). Get contractor quotes + a written scope before underwriting a rehab budget.
Schools (NCES district)
- District
- Buffalo City School District
- NCES district ID
- 3605850
- Math proficiency
- 41% ▲ 11.00%
- Reading proficiency
- 40% ▲ 7.00%
- Median HH income
- $31,665
- Composite
- 33.17/100
- National rank
- #5544
- State rank
- #535 of 590 in NY
Livability — Buffalo
- Score
- 77/100
- State rank
- #195
- US rank
- #3011
Category grades
Schools grade is shown separately in the Schools card above.
Census & demographics
- Census place
- Buffalo, NY
- County
- Erie County · 714,559 people
- City population
- 440,021
- Metro
- Buffalo-Cheektowaga, NY
- Population (ZIP)
- 12,369
- Household income
- $40,512
- Rent vs Own
- Severe rent burden
- 1213.0
Population outlook (Erie County) Hauer SSP2
- Today (2025)
- 933,037 people
- By 2030
- 935,181 · +0.2%
- By 2040
- 928,531 · -0.5%
- By 2050
- 905,725 · -2.9%
- By 2075
- 834,037 · -10.6%
- By 2100
- 708,033 · -24.1%
Race, ethnicity, and origin ACS 2023
- Neighborhood character
- Diverse neighborhood (Simpson 0.66)
- Race & ethnicity
- White 42% Hispanic / Latino 36% Black 16% Two or more races 12% Asian 2% Native American 1%
- Hispanic origin (detail)
- Mexican 4% Puerto Rican 30% Dominican 1%
- Common ancestry
- Romanian 7% Subsaharan African 2% Slovak 1%
- Foreign-born
- 8% · Canada, China
- Languages at home
- 69% English-only · Spanish 24% Arabic 2% Other Indo-European 1%
Political lean MEDSL · Erie
- 2024 margin
- Lean D (+9.7) · D 54.8% · R 45.2%
- 2008→2024 swing
- -7.9pp toward R · 2008: 17.5pp · 2024: 9.7pp
- All cycles
- 2024: D+9.7 2020: D+14.7 2016: D+4.8 2012: D+15.6 2008: D+17.5
Not yet ingested
- Civics
- —
Market trends
- HPI YoY
- ▼ -68.73%
- Current HPI
- 290.2643
- Rent YoY
- ▲ 4.28%
- Metro
- Buffalo-Cheektowaga, NY
- State GDP YoY
- ▲ 2.60%
- F500 in state
- 92
Industry mix (Fortune 500 HQ in NY)
| Industry | F500 HQs | Revenue |
|---|---|---|
| Financial Services | 10 | $950B |
|
||
| Consumer Goods | 9 | $162B |
|
||
| Insurance | 4 | $225B |
|
||
| Telecommunications | 2 | $144B |
|
||
| Pharmaceuticals | 2 | $112B |
|
||
| Media / Entertainment | 2 | $69B |
|
||
Price history
+475.6% since first listed7 events — show timeline
- 2026-05-07 Listed $575,000 WNYREIS
- 2016-04-20 Sold (MLS) $444,000 WNYREIS
- 2015-12-30 Contingent — WNYREIS
- 2015-06-05 Listed $479,000 WNYREIS
- 2014-09-18 Listed $489,000 WNYREIS
- 2010-11-09 Sold (MLS) $75,000 WNYREIS
- 2010-08-30 Listed $99,900 WNYREIS
Cash-flow waterfall
monthlySold comps — $/sqft
last 12 mo · ≤1 miLoading sold comps…