 Duplex
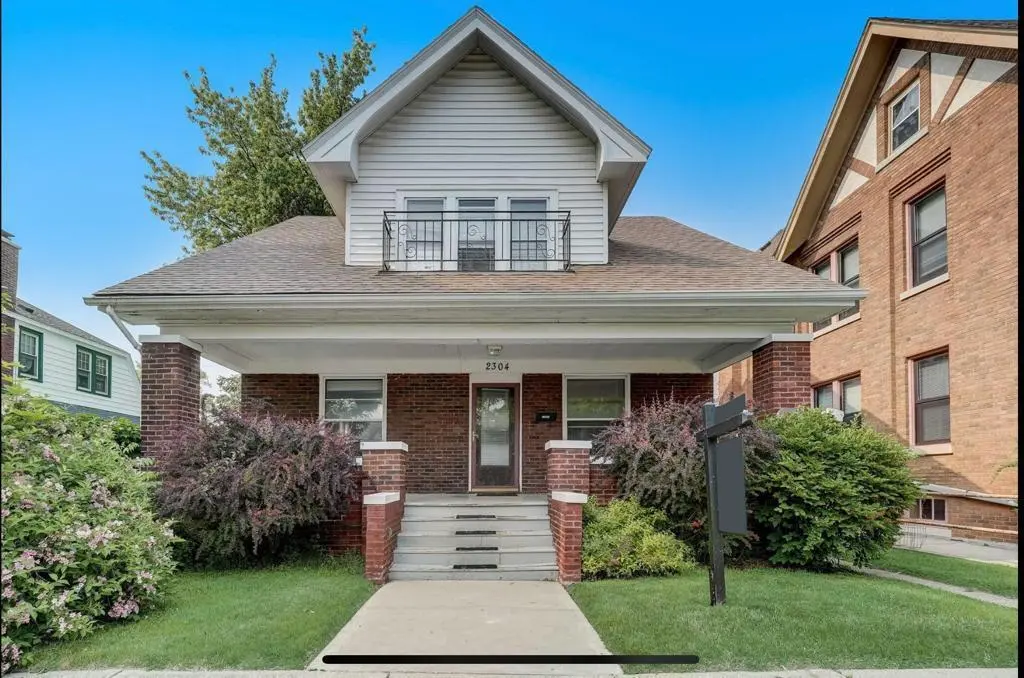
2304 Thor Ave · Racine, WI
Flood risk 1/10 · Minimal
- FEMA flood zone
- X (unshaded)
- Chance of flooding over 30 yrs
- 0.0%
- Est. flood insurance / yr
- $507 – $1,088
Fire risk 1/10 · Minimal
- Est. fire insurance / yr
- $636 – $1,182
Heat risk 2/10 · Minimal
- Hot days now (above 96°F)
- 7 days/yr
- Hot days in 30 yrs
- 13 days/yr
Wind risk 2/10 · Minimal
- Chance of severe wind over 30 yrs
- —
Air-quality risk 3/10 · Minor
- Unhealthy air days now
- 3 days/yr
- Unhealthy air days in 30 yrs
- 3 days/yr
Risk factors via First Street. Map © Google.
Why this score? — see what drove the C grade
The composite is a weighted blend of 9 inputs, each scored 0–100. Each bar is that input's sub-score; the figure is the points it added to the 100-point composite (weight × sub-score).
- Cash flow +27.4/30.0
- DSCR +9.6/10.0
- 1% rule +7.8/10.0
- Livability +4.0/5.0
- ARV discount +3.1/15.0
- Rent growth +2.5/5.0
- Condition / age +2.5/5.0
- Schools +1.5/10.0
- Appreciation +0.0/10.0
$214,900
🖨 Deal sheet (PDF) 📄 Offer letter ✓ Due diligence
Multi-family units
County records classify this as Multi-Family (2-4 Unit). Listing-text estimate: 2 units. confirmed
Listing remarks MLS
Beautiful duplex with lots of yard space and character!3 off street parking spacesUpper and lower units are rented out for a total of $2150 a month and are month to monthNew water heater installed 02/2026Room sizes estimated
Key facts
- Off street parking
- Water heater
- Yard space
Tags
Neighborhood map
What this means for you Summary
Snapshot
- This is a 2 × 3-bed/2.0-bath units multifamily listed at $215k.
Deal economics
- At list price, monthly cash flow is $629 ($8k/yr) — positive. Per door: $315/mo.
- The deal already cash-flows at list — no discount required.
- Meets the 1% rule at list price ($3k rent vs $215k).
- Recommended offer: $208k (3.0% below list) — sets the bar for market timing.
- Cap rate 9.8% vs local median 4.0% in Racine — top-decile yield for the area; either an underpriced asset or a hidden risk that comps aren't pricing in. Stress-test before assuming the spread holds.
Location & tenants
- Location reads 80/100 on livability (#58 in WI, #1,622 nationally) — a professional / high-income tenant draw. Strengths: commute A+, cost of living A+, housing A+; Watch: employment D, schools D-.
- Racine Unified School District (urban): math 12% / reading 20% proficiency, ranked #335 of 342 in WI (top 98%) — low school quality limits family demand, transient renter base, plan for 1-2y turnover.
- Market conditions: 45 active listings in the ZIP; 7 comparable units currently listed for rent nearby; rentals leasing fast (median 14d on market — plan ~1-2 weeks tenant-placement turnaround); 505 units permitted in Racine County in 2024 (287 in 5+ unit buildings).
- At $2,745/mo this rent would consume 48% of the median local household income ($69k/yr) (locally 430% of renters already pay >50% of income on rent) — very limited rent-growth headroom before tenants either downsize or default.
Forward outlook
- Local home prices are declining (-3.0%/yr); year-one equity from $1k of loan paydown is wiped out by about $6k of value loss. Plan a longer hold.
- Racine County population projected to shrink 7% by 2050 — rents likely to lag national; underwrite the cash flow, not the appreciation.
- At projected returns (-3.0% appreciation + 3.0% rent growth), your $60k cash investment doubles in ~9 years — after that, you're playing with house money.
Negotiation context
- It's been on market 41 days — a 3% lower offer ($208k) is reasonable based on typical stale-listing flexibility.
- 7 sale attempts since 14y ago; this cycle's ask has dropped $15k (7%) from the opening price — seller is motivated, your offer sets the floor, not the list.
Risks & watch-outs
- Watch-outs: built in 1920 — expect roof / HVAC / electrical / plumbing capex.
Questions for the listing agent
- It's been on market 41 days. Have you received any prior offers? Is the seller open to a 3% concession, seller financing, or rate buy-down credit?
- Can we see the unit-by-unit rent roll, current vacancy, and any below-market leases? What's the average tenancy length?
- What capital expenditures (roof, boiler, parking lot, exteriors) have been made in the last 5 years, and what's planned in the next 2?
- Built in 1920 — when were the roof, HVAC, electrical panel, plumbing, and water heater last replaced?
- Is there a deadline driving the sale (1031 exchange, divorce, estate, relocation)? That informs how much negotiation room exists.
- Schools are D-rated, which usually means shorter tenancies and higher turnover. Who's the typical renter profile here, and what's been the actual vacancy rate?
- What's the average days-on-market for RENTAL listings here right now (not sales)? A rising rental-DOM trend means longer vacancies and softer asking-rent achievability than the comps imply.
- What's the recent tenant-quality profile in this submarket — average credit score on applications, eviction rate, late-payment / NSF rate, and stable-employment percentage? A property-management company in the area should have these aggregated.
- How much new apartment / multifamily construction is in the pipeline within 1–3 miles? Heavy new supply (>2% of stock underway) typically softens rents 12–24 months out; light construction supports rent growth.
Investment metrics
- 1% rule
- 1.28% ✓
- Cap rate
- 9.81%
- Cash-on-cash
- 12.55%
- DSCR
- 1.56
- GRM
- 6.5
CMA / ARV
- ARV (median comp)
- $195,948
- List price
- $214,900
- Delta
- 9.67%
- Verdict
- FAIR
- Comps
- 20 within 1.0 mi
Show comp detail 10 sales within ~0.75 mi
| Address | Dist | Beds/Ba | Sqft | Sold | Price | $/sf | Match |
|---|---|---|---|---|---|---|---|
| 218 Island Ave | 0.41mi | 3/2.0 | 1,616 (-6%) | 2mo | $232,000 | $144 | 70 |
| 332 Luedtke Ave | 0.32mi | 4/2.0 (+1) | 1,760 (+3%) | 6mo | $175,000 | $99 | 70 |
| 609 Belmont Ave | 0.19mi | 3/2.0 | 1,743 (+2%) | 23mo | $185,000 | $106 | 69 |
| 2102 Carmel Ave | 0.11mi | 4/2.0 (+1) | 1,731 (+1%) | 24mo | $180,000 | $104 | 68 |
| 1905 Ehlert St | 0.37mi | 4/2.0 (+1) | 1,520 (-11%) | 1mo | $210,000 | $138 | 58 |
| 1333 Grove Ave | 0.68mi | 4/2.0 (+1) | 1,725 (+1%) | 17mo | $247,000 | $143 | 48 |
| 1108 Reschke Ave | 0.67mi | 4/2.0 (+1) | 1,616 (-6%) | 15mo | $160,000 | $99 | 42 |
| 1345 Deane Blvd | 0.60mi | 3/2.0 | 1,938 (+13%) | 12mo | $238,000 | $123 | 39 |
| 3725 Haven Ave | 0.74mi | 3/2.0 | 1,932 (+13%) | 12mo | $210,000 | $109 | 34 |
| 1626 12th St | 0.66mi | 4/2.0 (+1) | 1,950 (+14%) | 23mo | $35,000 | $18 | 21 |
Match score weights: distance 35% · size 25% · config 20% · recency 20%. Top-matched comps best support the ARV.
Projected returns pro-forma
-3.0% appreciation · 3.0% rent growth · sell at horizon
- IRR
- 2.3%
- Equity multiple
- 1.09×
- Total profit
- $5,329
- Equity at exit
- $32,042
- IRR
- 11.9%
- Equity multiple
- 1.94×
- Total profit
- $56,551
- Equity at exit
- $18,581
Cash invested: $60,172 (down + closing). Projections, not guarantees.
Landlord ↔ Tenant lean methodology
- Overall (STATE)
- 73 Landlord-Friendly
- State Wisconsin
- 73 Landlord-Friendly · R+2
- County
- — inherits STATE
- City
- — inherits STATE
ZIP-level market 53405
- Active inventory
- 45
- Price-to-rent
- 13.0×
Monthly cashflow live
- Estimated rent
- $2,745 high interval (Pro) →
- Mortgage (P&I)
- −$1,127
- Tax from tax record
- −$323 /mo · $3,874/yr
- Insurance
- −$90
- HOA
- −$0
- Vacancy / Maint / Mgmt
- −$576
- Net cashflow
- $629
Break-even live
Sensitivity live
| Price | -10% $751 | -5% $690 | +0% $629 | +5% $568 | +10% $508 |
|---|---|---|---|---|---|
| Rent | -10% $412 | -5% $521 | +0% $629 | +5% $738 | +10% $846 |
| Rate | -1.0pp $737 | -0.5pp $684 | base $629 | +0.5pp $574 | +1.0pp $517 |
2-unit breakdown (identical units grouped — click to expand)
| Units | Beds | Baths | Est. rent |
|---|---|---|---|
| 2× units | 3 | 2 | $2,744 |
| #1 | 3 | 2 | $1,372 |
| #2 | 3 | 2 | $1,372 |
| Total (2 units) | $2,745 | ||
UW: 25.0% down · 7.5% · 30yr · 1.5% tax · 5.0% vac · 8.0% maint · 8.0% mgmt
Financing live
Cash to close
- Down payment
- $53,725
- Closing costs
- $6,447
- Reserves months
- —
- Total cash needed
- —
Loan-product check · same deal, 3 products live
Conventional
25% down · 7.5% · 30yr
- Down + closing
- —
- Monthly P&I
- —
- Monthly cashflow
- —
- DSCR
- —
- Eligible?
- —
Personal DTI + credit; lowest rate.
DSCR
20% down · 8.5% · 30yr
- Down + closing
- —
- Monthly P&I
- —
- Monthly cashflow
- —
- DSCR
- —
- Eligible?
- —
No personal income docs; deal must DSCR.
Hard money
10% down · 12.0% · 12mo
- Down + closing
- —
- Monthly P&I
- —
- Monthly cashflow
- —
- DSCR
- —
- Eligible?
- —
Short-term bridge; refi at stabilization.
Rent comps 7 comps
| Address | Beds | Baths | Sqft | Rent | $/sqft | DOM | Units | Dist |
|---|---|---|---|---|---|---|---|---|
| 3224 Osborne Blvd Racine, WI | 3.0 | 2.0 | 1696 | $2,200 | $1.30 | 21d | 1 | 0.45mi |
| 1612 Winslow St Racine, WI | 3.0 | 1.0 | 1200 | $1,300 | $1.08 | 21d | 1 | 0.53mi |
| 945 N Memorial Dr Unit 1-2-3 Racine, WI | 3.0 | 1.0 | 1500 | $1,450 | $0.97 | 21d | 1 | 0.81mi |
| 2200 Northwestern Ave Racine, WI | 2.0 | 1.0–2.0 | 839 | $1,825 | $2.17 | 13d | 12 | 1.04mi |
| 2220 Northwestern Ave Racine, WI | 1.0–3.0 | 1.0–2.0 | 899 | $2,175 | $2.42 | 13d | 19 | 1.05mi |
| 2328 21st St Racine, WI | 3.0 | 1.0 | 1239 | $1,750 | $1.41 | 13d | 1 | 1.36mi |
| 1210 Erie St Racine, WI | 3.0 | 1.0 | 1350 | $1,150 | $0.85 | 13d | 1 | 1.42mi |
Listing history 27 events
-
2026-06-19days on market $214,900 Active 41 DOM
-
2026-06-18days on market $214,900 Active 40 DOM
-
2026-06-17days on market $214,900 Active 39 DOM
-
2026-06-16days on market $214,900 Active 38 DOM
-
2026-06-15pricedays on market $214,900 Active 37 DOM
-
2026-05-16price $219,900 224-char remark
Show marketing remark (224 chars)
Beautiful duplex with lots of yard space and character!3 off street parking spacesUpper and lower units are rented out for a total of $2150 a month and are month to monthNew water heater installed 02/2026Room sizes estimated
-
2026-05-06price $224,900 224-char remark
Show marketing remark (224 chars)
Beautiful duplex with lots of yard space and character!3 off street parking spacesUpper and lower units are rented out for a total of $2150 a month and are month to monthNew water heater installed 02/2026Room sizes estimated
-
2026-04-29status Active 224-char remark
Show marketing remark (224 chars)
Beautiful duplex with lots of yard space and character!3 off street parking spacesUpper and lower units are rented out for a total of $2150 a month and are month to monthNew water heater installed 02/2026Room sizes estimated
-
2026-03-09status Pending 224-char remark
Show marketing remark (224 chars)
Beautiful duplex with lots of yard space and character!3 off street parking spacesUpper and lower units are rented out for a total of $2150 a month and are month to monthNew water heater installed 02/2026Room sizes estimated
-
2026-03-01$229,900 Active 224-char remark
Show marketing remark (171 chars)
Beautiful duplex with lots of yard space and off street parking space for up to 3 cars. Both units currently rented and generating $2150 total in income. Come take a look!
-
2026-03-01historical 171-char remark
Show marketing remark (171 chars)
Beautiful duplex with lots of yard space and off street parking space for up to 3 cars. Both units currently rented and generating $2150 total in income. Come take a look!
-
2026-03-01$229,900 Active 171-char remark
Show marketing remark (171 chars)
Beautiful duplex with lots of yard space and off street parking space for up to 3 cars. Both units currently rented and generating $2150 total in income. Come take a look!
-
2023-07-24soldstatus $200,000
-
2023-07-21soldstatus $200,000 Sold
-
2023-06-20historical Contingent
-
2023-06-13$179,000 Active
-
2020-10-15soldstatus $125,000
-
2019-11-14soldstatus $110,000
-
2016-02-07historical
-
2015-08-10$110,000 Active
-
2012-10-09historical
-
2012-10-09$114,900
-
2012-10-09historical
-
2012-10-09$114,900
-
2010-05-10soldstatus $48,000
-
2010-05-10soldstatus $48,000
-
2010-05-06soldstatus $96,000
ⓘ Source: listings_history table (triggers on properties + properties_extension) + one-shot
backfill from property_details.listing_events for pre-trigger history.
Tax reassessment forecast WI · Partial reset (capped growth)
- Current annual tax
- $3,874 · $323/mo
- Projected year-2 tax
- $3,925 · $327/mo
- Expected delta
- +$51/yr (+$4/mo · 1.3%)
ⓘ Screening estimate from a state-policy table — verify with the county assessor before closing.
Climate risk First Street
- Flood 1/10 Low FEMA zone X (unshaded) · 0% chance over 30 yrs
- Wildfire 1/10 Low
- Heat 2/10 Low 7 d/yr ≥96°F today · 13 d/yr by 30 yrs out
- Wind 2/10 Low
- Air quality 3/10 Moderate 3 unhealthy d/yr today · 3 by 30 yrs out
Nearby sold comps map
Loading sold comps map…
Walkable amenities ~0.75 mi
Loading nearby amenities…
Taxation est. · year 1
- Rental income
- $32,940
- − Mortgage interest
- −$12,038
- − Property taxes
- −$3,874
- − Insurance
- −$1,074
- − Repairs & maintenance
- −$2,635
- − Management
- −$2,635
- − Depreciation
- −$6,252
- Taxable income
- $4,432
- Est. tax owed @ 24.0%
- −$1,064
- After-tax cash flow
- $6,487/yr
For passive investors: Depreciation is non-cash, so a rental often shows a tax loss while cash-flowing — sheltering income. Rental losses are passive: they offset passive income freely, and up to $25,000/yr can offset ordinary (W-2) income if you actively participate and your MAGI is under $100k (phasing out to $0 by $150k); unused losses carry forward. On sale, claimed depreciation is recaptured at up to 25%, and gains may owe capital-gains tax (a 1031 exchange can defer both). Figures are a year-1 estimate at your 24.0% rate — not tax advice; consult a CPA.
Schools (NCES district)
- District
- Racine Unified School District
- NCES district ID
- 5512360
- Math proficiency
- 12% ▼ -7.00%
- Reading proficiency
- 20% ▬ 0.00%
- Median HH income
- $50,716
- Composite
- 14.64/100
- National rank
- #9405
- State rank
- #335 of 342 in WI
Livability — Racine
- Score
- 80/100
- State rank
- #58
- US rank
- #1622
Category grades
Schools grade is shown separately in the Schools card above.
Census & demographics
- Census place
- Racine, WI
- County
- Racine County · 146,693 people
- City population
- 67,505
- Metro
- Racine, WI
- Population (ZIP)
- 26,793
- Household income
- $69,242
- Rent vs Own
- Severe rent burden
- 430.0
Population outlook (Racine County) Hauer SSP2
- Today (2025)
- 195,281 people
- By 2030
- 193,725 · -0.8%
- By 2040
- 188,159 · -3.6%
- By 2050
- 181,323 · -7.1%
- By 2075
- 174,342 · -10.7%
- By 2100
- 166,870 · -14.5%
Race, ethnicity, and origin ACS 2023
- Neighborhood character
- Diverse neighborhood (Simpson 0.56)
- Race & ethnicity
- White 63% Hispanic / Latino 17% Two or more races 15% Black 12% Asian 1%
- Hispanic origin (detail)
- Mexican 15% Puerto Rican 1%
- Common ancestry
- Romanian 7% Portuguese 4% Lithuanian 2%
- Foreign-born
- 4% · Canada
- Languages at home
- 91% English-only · Spanish 7% German/W. Germanic 1%
Political lean MEDSL · Racine
- 2024 margin
- Lean R (+6.2) · D 46.3% · R 52.5% · Other 1.2%
- 2008→2024 swing
- -13.6pp toward R · 2008: 7.4pp · 2024: -6.2pp
- All cycles
- 2024: R+6.2 2020: R+4.1 2016: R+4.4 2012: D+3.6 2008: D+7.4
Not yet ingested
- Civics
- —
Market trends
- HPI YoY
- ▼ -220.43%
- Current HPI
- 189.5192
- Rent YoY
- —
- Metro
- Racine, WI
- State GDP YoY
- ▲ 2.10%
- F500 in state
- 20
Industry mix (Fortune 500 HQ in WI)
| Industry | F500 HQs | Revenue |
|---|---|---|
| Industrial Machinery | 4 | $23B |
|
||
| Industrial Technology | 2 | $36B |
|
||
| Insurance | 1 | $36B |
|
||
| Professional Services | 1 | $19B |
|
||
| Utilities | 1 | $9B |
|
||
| Consumer Goods | 1 | $3B |
|
||
Price history
+129.1% since first listed22 events — show timeline
- 2026-05-16 Price Changed $219,900 METROMLS
- 2026-05-06 Price Changed $224,900 METROMLS
- 2026-04-29 Relisted — METROMLS
- 2026-03-09 Pending — METROMLS
- 2026-03-01 Listed $229,900 METROMLS
- 2026-03-01 Listing Removed — METROMLS
- 2026-03-01 Listed $229,900 METROMLS
- 2023-07-24 Sold (Public Records) $200,000 Public Records
- 2023-07-21 Sold (MLS) $200,000 METROMLS
- 2023-06-20 Contingent — METROMLS
- 2023-06-13 Listed $179,000 METROMLS
- 2020-10-15 Sold (Public Records) $125,000 Public Records
- 2019-11-14 Sold (Public Records) $110,000 Public Records
- 2016-02-07 Listing Removed — METROMLS
- 2015-08-10 Listed $110,000 METROMLS
- 2012-10-09 Listed $114,900 METROMLS
- 2012-10-09 Listing Removed — METROMLS
- 2012-10-09 Listed $114,900 METROMLS
- 2012-10-09 Listing Removed — METROMLS
- 2010-05-10 Sold (Public Records) $48,000 Public Records
- 2010-05-10 Sold (Public Records) $48,000 Public Records
- 2010-05-06 Sold (MLS) $96,000 METROMLS
Property tax history
+3.1%/yrLatest (2025): $3,874 · +12.7% YoY. Source: county tax records.
Cash-flow waterfall
monthlySold comps — $/sqft
last 12 mo · ≤1 miLoading sold comps…