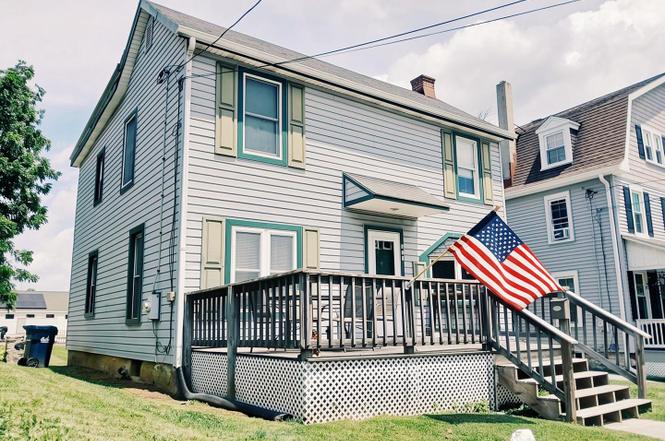
219 E South St · Kennett Square, PA
Flood risk 4/10 · Minor
- FEMA flood zone
- X (unshaded)
- Chance of flooding over 30 yrs
- 0.22%
- Est. flood insurance / yr
- $473 – $860
Fire risk 2/10 · Minimal
- Est. fire insurance / yr
- $511 – $949
Heat risk 7/10 · Major
- Hot days now (above 101°F)
- 7 days/yr
- Hot days in 30 yrs
- 16 days/yr
Wind risk 6/10 · Moderate
- Chance of severe wind over 30 yrs
- 27.0%
Air-quality risk 3/10 · Minor
- Unhealthy air days now
- 2 days/yr
- Unhealthy air days in 30 yrs
- 3 days/yr
Risk factors via First Street. Map © Google.
Why this score? — see what drove the C+ grade
The composite is a weighted blend of 9 inputs, each scored 0–100. Each bar is that input's sub-score; the figure is the points it added to the 100-point composite (weight × sub-score).
- Cash flow +19.1/30.0
- ARV discount +15.0/15.0
- DSCR +6.0/10.0
- 1% rule +5.0/10.0
- Schools +4.6/10.0
- Livability +4.0/5.0
- Rent growth +3.9/5.0
- Condition / age +2.5/5.0
- Appreciation +0.0/10.0
$325,000
🖨 Deal sheet 📄 Offer letter ✓ Due diligence
Listing remarks
Don't miss this fantastic opportunity in a highly desirable Kennett Square location. This 4-bedroom, 1-bathroom home is full of potential and ready for its next chapter. While the interior may benefit from updating, the property has been lovingly maintained by the same owner for over 50 years, reflecting a strong history of care and pride of ownership. Conveniently located directly across from the local high school, this home offers exceptional accessibility within an established community. The expansive rear backyard provides abundant space for outdoor recreation, gardening, entertaining, or future improvements. Although the property does not currently have a driveway, convenient rear acce
Key facts
- 6,540 sq ft lot
- Built 1910
Tags
Property features AI
Exterior
- Parking: Other parking
- Utilities: Public water; Public sewer; Oil hot water
- Home design: Detached home; Above-grade finished living space of 1,568 (per assessor)
- Construction: Mixed construction materials; Concrete perimeter foundation
- Exterior features: Deck(s); Screened outdoor living area; Detached structure
Interior
- Bedrooms: Four bedrooms on the first upper level
- Bathrooms: One full bathroom
- Heating & cooling: Hot water heating (oil-fired); Window air conditioning units
- Interior features: Wood-burning fireplace; Partial basement
Neighborhood map
What this means for you Summary
Snapshot
- This is a 4-bed/1.0-bath single-family listed at $325k.
Deal economics
- At list price, monthly cash flow is $346 ($4k/yr) — positive.
- The deal already cash-flows at list — no discount required.
- To meet the 1% rule (rent ≥ 1% of price), the offer needs to be $325k (0.0% below list).
- Recommended offer: $325k (0.0% below list) — sets the bar for 1% rule.
- Cap rate 7.6% vs local median 2.6% in Kennett Square — top-decile yield for the area; either an underpriced asset or a hidden risk that comps aren't pricing in. Stress-test before assuming the spread holds.
Location & tenants
- Location reads 80/100 on livability (#202 in PA, #1,781 nationally) — a professional / high-income tenant draw. Strengths: housing A+, crime A-, amenities A-; Watch: commute D+.
- Kennett Consolidated SD (suburban): math 39% / reading 58% proficiency, ranked #135 of 539 in PA (top 25%) — families likely to look elsewhere, expect single-tenant / working-renter base with shorter leases.
- Market conditions: Rents rising fast (+5.8%/yr); 162 active listings in the ZIP; 7 comparable units currently listed for rent nearby; rentals at typical pace (median 22d on market — plan ~3-4 weeks tenant-placement turnaround); high-income renter base; 1,513 units permitted in Chester County in 2024 (354 in 5+ unit buildings).
- This rent runs 32% of the median local income ($124k/yr) — at the standard rent-burdened threshold; future hikes will face affordability resistance.
Forward outlook
- Local home prices are declining (-3.0%/yr); year-one equity from $2k of loan paydown is wiped out by about $10k of value loss. Plan a longer hold.
- Chester County population projected at +6% by 2050 — modest demand growth; plan on rents tracking national, not racing it.
Negotiation context
- Only 1 days on market — expect competitive offers; lowballing is unlikely to land.
Risks & watch-outs
- Watch-outs: built in 1910 — expect roof / HVAC / electrical / plumbing capex.
- Climate carrying-cost: major wind risk, 27% chance of damaging wind over 30y; extreme-heat days projected 7→16/yr by 2055 (HVAC capex compounding) — expect insurance premiums to compound above CPI over the hold.
Questions for the listing agent
- Built in 1910 — when were the roof, HVAC, electrical panel, plumbing, and water heater last replaced?
- Is there a deadline driving the sale (1031 exchange, divorce, estate, relocation)? That informs how much negotiation room exists.
- Schools are B-rated — typically a magnet for longer-tenancy family renters. What's the average tenant stay here, and is there a school-zone premium baked into asking?
- What's the average days-on-market for RENTAL listings here right now (not sales)? A rising rental-DOM trend means longer vacancies and softer asking-rent achievability than the comps imply.
- What's the recent tenant-quality profile in this submarket — average credit score on applications, eviction rate, late-payment / NSF rate, and stable-employment percentage? A property-management company in the area should have these aggregated.
- How much new for-sale + rental construction is in the pipeline within 1–3 miles? Heavy new supply typically softens prices + rents 12–24 months out; constrained supply supports both.
Investment metrics
- 1% rule
- 1.00% ✗
- Cap rate
- 7.57%
- Cash-on-cash
- 4.56%
- DSCR
- 1.20
- GRM
- 8.3
CMA / ARV
- ARV (on-the-fly)
- $456,288
- Comps found
- 12
Show comp detail 12 sales within ~0.75 mi
| Address | Dist | Beds/Ba | Sqft | Sold | Price | $/sf | Match |
|---|---|---|---|---|---|---|---|
| 426 S Walnut St | 0.33mi | 4/2.0 | 1,641 (+5%) | 5mo | $500,000 | $305 | 68 |
| 714 Meredith St | 0.34mi | 3/1.5 (-1) | 1,536 (-2%) | 11mo | $465,000 | $303 | 64 |
| 402 Ridge Ave | 0.42mi | 4/1.5 | 1,617 (+3%) | 14mo | $430,000 | $266 | 62 |
| 406 E South St | 0.16mi | 3/2.0 (-1) | 1,432 (-9%) | 13mo | $450,000 | $314 | 58 |
| 122 W Cypress St | 0.41mi | 3/1.0 (-1) | 1,680 (+7%) | 8mo | $477,000 | $284 | 58 |
| 711 Lafayette St | 0.36mi | 4/2.0 | 1,519 (-3%) | 20mo | $430,000 | $283 | 57 |
| 706 Center St | 0.27mi | 3/1.5 (-1) | 1,416 (-10%) | 12mo | $275,000 | $194 | 54 |
| 831 Taylor St | 0.28mi | 3/1.0 (-1) | 1,344 (-14%) | 9mo | $475,000 | $353 | 50 |
| 535 Kenview Ave | 0.69mi | 4/2.0 | 1,738 (+11%) | 1mo | $455,000 | $262 | 45 |
| 501 Magnolia St | 0.53mi | 4/1.5 | 1,662 (+6%) | 23mo | $501,000 | $301 | 44 |
| 616 Ridge Ave | 0.67mi | 4/1.5 | 1,648 (+5%) | 24mo | $461,000 | $280 | 38 |
| 629 Cope Rd | 0.72mi | 3/2.0 (-1) | 1,632 (+4%) | 23mo | $475,000 | $291 | 32 |
Match score weights: distance 35% · size 25% · config 20% · recency 20%. Top-matched comps best support the ARV.
Projected returns pro-forma
-3.0% appreciation · 5.79% rent growth · sell at horizon
- IRR
- -6.1%
- Equity multiple
- 0.77×
- Total profit
- $-21,221
- Equity at exit
- $48,459
- IRR
- 6.6%
- Equity multiple
- 1.56×
- Total profit
- $50,770
- Equity at exit
- $28,100
Cash invested: $91,000 (down + closing). Projections, not guarantees.
Landlord ↔ Tenant lean methodology
- Overall (STATE)
- 62 Landlord-Friendly
- State Pennsylvania
- 62 Landlord-Friendly · EVEN
- County
- — inherits STATE
- City
- — inherits STATE
ZIP-level market 19348
- Home prices YoY
- -29.1%
- Rents YoY
- 5.8%
- Active inventory
- 162
- Price-to-rent
- 8.3×
Monthly cashflow live
- Estimated rent
- $3,249 high interval (Pro) →
- Mortgage (P&I)
- −$1,704
- Tax from tax record
- −$381 /mo · $4,575/yr
- Insurance
- −$135
- HOA
- −$0
- Vacancy / Maint / Mgmt
- −$682
- Net cashflow
- $346
Break-even live
UW: 25.0% down · 7.5% · 30yr · 1.5% tax · 5.0% vac · 8.0% maint · 8.0% mgmt
Financing live
Cash to close
- Down payment
- $81,250
- Closing costs
- $9,750
- Reserves months
- —
- Total cash needed
- —
Loan-product check · same deal, 3 products live
Conventional
25% down · 7.5% · 30yr
- Down + closing
- —
- Monthly P&I
- —
- Monthly cashflow
- —
- DSCR
- —
- Eligible?
- —
Personal DTI + credit; lowest rate.
DSCR
20% down · 8.5% · 30yr
- Down + closing
- —
- Monthly P&I
- —
- Monthly cashflow
- —
- DSCR
- —
- Eligible?
- —
No personal income docs; deal must DSCR.
Hard money
10% down · 12.0% · 12mo
- Down + closing
- —
- Monthly P&I
- —
- Monthly cashflow
- —
- DSCR
- —
- Eligible?
- —
Short-term bridge; refi at stabilization.
Rent comps 7 comps
| Address | Beds | Baths | Sqft | Rent | $/sqft | DOM | Units | Dist |
|---|---|---|---|---|---|---|---|---|
| 200 Marshall St Kennett Square, PA | 3.0 | 2.0 | 1755 | $2,600 | $1.48 | 17d | 1 | 0.34mi |
| 316 Meredith St Kennett Square, PA | 4.0 | 2.5 | 1794 | $3,495 | $1.95 | 22d | 1 | 0.37mi |
| 316 Meredith St Kennett Square, PA | 4.0 | 2.5 | 1794 | $3,495 | $1.95 | 24d | 1 | 0.37mi |
| 106 S Walnut St Kennett Square, PA | 3.0 | 2.0 | 1260 | $2,650 | $2.10 | 44d | 1 | 0.55mi |
| 626 D St Kennett Square, PA | 3.0 | 3.5 | 2052 | $3,100 | $1.51 | 10d | 1 | 0.63mi |
| 634 D St Kennett Square, PA | 3.0 | 3.5 | 2016 | $3,100 | $1.54 | 3d | 1 | 0.65mi |
| 41 Ways Ln Kennett Square, PA | 4.0 | 2.5 | 2200 | $3,450 | $1.57 | 22d | 1 | 0.90mi |
Listing history 3 events
-
2026-06-18status $325,000 Active 1 DOM
-
2026-06-17remarks 699-char remark
-
2026-06-17$325,000 Coming Soon 1 DOM
ⓘ Source: listings_history table (triggers on properties + properties_extension) + one-shot
backfill from property_details.listing_events for pre-trigger history.
Tax reassessment forecast PA · Partial reset (capped growth)
- Current annual tax
- $4,575 · $381/mo
- Projected year-2 tax
- $4,855 · $405/mo
- Expected delta
- +$280/yr (+$23/mo · 6.1%)
ⓘ Screening estimate from a state-policy table — verify with the county assessor before closing.
Climate risk First Street
- Flood 4/10 Moderate FEMA zone X (unshaded) · 22% chance over 30 yrs
- Wildfire 2/10 Low
- Heat 7/10 Severe 7 d/yr ≥101°F today · 16 d/yr by 30 yrs out
- Wind 6/10 Major 27% chance of damaging wind over 30 yrs
- Air quality 3/10 Moderate 2 unhealthy d/yr today · 3 by 30 yrs out
Nearby sold comps map
Loading sold comps map…
Walkable amenities ~0.75 mi
Loading nearby amenities…
Taxation est. · year 1
- Rental income
- $38,992
- − Mortgage interest
- −$18,205
- − Property taxes
- −$4,575
- − Insurance
- −$1,625
- − Repairs & maintenance
- −$3,119
- − Management
- −$3,119
- − Depreciation
- −$9,455
- Taxable loss
- −$1,107
- Est. tax savings @ 24.0%
- +$266
- After-tax cash flow
- $4,417/yr
For passive investors: Depreciation is non-cash, so a rental often shows a tax loss while cash-flowing — sheltering income. Rental losses are passive: they offset passive income freely, and up to $25,000/yr can offset ordinary (W-2) income if you actively participate and your MAGI is under $100k (phasing out to $0 by $150k); unused losses carry forward. On sale, claimed depreciation is recaptured at up to 25%, and gains may owe capital-gains tax (a 1031 exchange can defer both). Figures are a year-1 estimate at your 24.0% rate — not tax advice; consult a CPA.
Schools (NCES district)
- District
- Kennett Consolidated SD
- NCES district ID
- 4212690
- Math proficiency
- 39% ▼ -15.00%
- Reading proficiency
- 58% ▼ -13.00%
- Median HH income
- $94,146
- Composite
- 45.69/100
- National rank
- #2576
- State rank
- #135 of 539 in PA
Livability — Kennett Square
- Score
- 80/100
- State rank
- #202
- US rank
- #1781
Category grades
Schools grade is shown separately in the Schools card above.
Census & demographics
- Census place
- Kennett Square, PA
- County
- Chester County · 432,350 people
- City population
- 23,621
- Metro
- Philadelphia-Camden-Wilmington, PA-NJ-DE-MD
- Population (ZIP)
- 23,621
- Household income
- $123,526
- Rent vs Own
- Severe rent burden
- 455.0
Population outlook (Chester County) Hauer SSP2
- Today (2025)
- 546,756 people
- By 2030
- 559,441 · +2.3%
- By 2040
- 576,377 · +5.4%
- By 2050
- 580,602 · +6.2%
- By 2075
- 581,575 · +6.4%
- By 2100
- 540,922 · -1.1%
Race, ethnicity, and origin ACS 2023
- Neighborhood character
- Predominantly White (74%)
- Race & ethnicity
- White 74% Hispanic / Latino 18% Two or more races 11% Asian 2% Black 2%
- Hispanic origin (detail)
- Mexican 13% Puerto Rican 1%
- Common ancestry
- Romanian 4% Lithuanian 2% Slovak 2%
- Foreign-born
- 13% · Canada, China, South Korea
- Languages at home
- 82% English-only · Spanish 15%
Political lean MEDSL · Chester
- 2024 margin
- D (+14.5) · D 56.7% · R 42.2% · Other 1.0%
- 2008→2024 swing
- +5.2pp toward D · 2008: 9.2pp · 2024: 14.5pp
- All cycles
- 2024: D+14.5 2020: D+17.0 2016: D+9.2 2012: R+0.4 2008: D+9.2
Not yet ingested
- Civics
- —
Market trends
- HPI YoY
- ▼ -111.65%
- Current HPI
- 272.3393
- Rent YoY
- ▲ 5.79%
- Metro
- Philadelphia-Camden-Wilmington, PA-NJ-DE-MD
- State GDP YoY
- ▲ 1.68%
- F500 in state
- 34
Industry mix (Fortune 500 HQ in PA)
| Industry | F500 HQs | Revenue |
|---|---|---|
| Healthcare | 2 | $309B |
|
||
| Insurance | 2 | $27B |
|
||
| Telecommunications / Media | 1 | $124B |
|
||
| Industrial Distribution | 1 | $22B |
|
||
| Financial Services | 1 | $20B |
|
||
| Chemicals / Materials | 1 | $18B |
|
||
Price history
1 event — show timeline
- 2026-06-17 Coming Soon $325,000 BRIGHT MLS
Property tax history
+3.1%/yrLatest (2026): $4,575 · +3.4% YoY. Source: county tax records.
Cash-flow waterfall
monthlySold comps — $/sqft
last 12 mo · ≤1 miLoading sold comps…