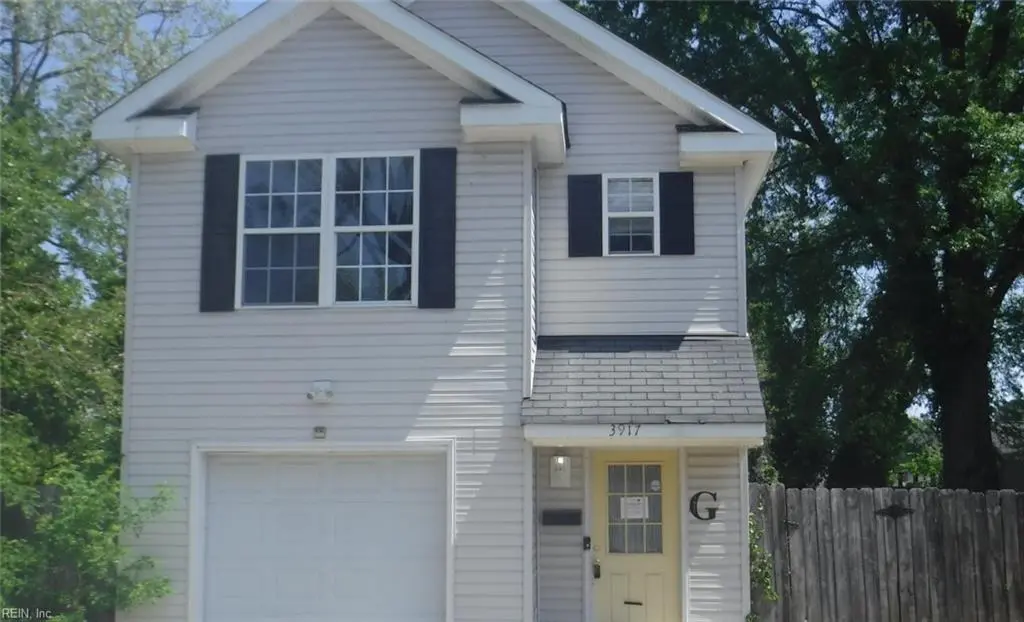
3917 Deep Creek Blvd · Portsmouth, VA
Flood risk 3/10 · Minor
- FEMA flood zone
- X (unshaded)
- Chance of flooding over 30 yrs
- 0.12%
- Est. flood insurance / yr
- $507 – $1,088
Fire risk 1/10 · Minimal
- Est. fire insurance / yr
- $666 – $1,236
Heat risk 9/10 · Severe
- Hot days now (above 106°F)
- 7 days/yr
- Hot days in 30 yrs
- 16 days/yr
Wind risk 8/10 · Major
- Chance of severe wind over 30 yrs
- 80.0%
Air-quality risk 5/10 · Moderate
- Unhealthy air days now
- 6 days/yr
- Unhealthy air days in 30 yrs
- 7 days/yr
Risk factors via First Street. Map © Google.
Why this score? — see what drove the B+ grade
The composite is a weighted blend of 9 inputs, each scored 0–100. Each bar is that input's sub-score; the figure is the points it added to the 100-point composite (weight × sub-score).
- Cash flow +24.2/30.0
- ARV discount +15.0/15.0
- Appreciation +10.0/10.0
- DSCR +7.8/10.0
- 1% rule +6.3/10.0
- Schools +3.9/10.0
- Livability +3.7/5.0
- Rent growth +3.5/5.0
- Condition / age +2.5/5.0
$209,000
🖨 Deal sheet (PDF) 📄 Offer letter ✓ Due diligence
Listing remarks
INVESTORS-Come see this charming 3 bedroom 2.5 bath vinyl sided Colonial waiting for you to update and revitalize-located near shopping and main roads. The eat-in kitchen is open to large family room. The primary bedroom is well proportioned with carpeting-the remaining bedrooms are also good sized-bathrooms feature tub/shower combinations-the integral garage is there for extra storage. SOLD AS-IS, with no repairs by Seller. This property may qualify for Seller Financing (Vendee). If Property was built prior to 1978, Lead Based Paint Potentially Exists.
Key facts
- Large family room
- Integral garage
- Eat-in kitchen
Tags
Property features AI
Finance
- Other: Lot approximately 0.173 acres (dimensions 110 x 68.5); City view; Neighborhood: VIRGINIA PLACE
- HOA & community: No HOA
Exterior
- Parking: Attached 1-car garage; Driveway parking spaces
- Utilities: City/County water; City/County sewer; Electric water heater
- Home design: Detached colonial-style home; 2 stories; Simple ownership
- Construction: Asphalt shingle roof; Slab foundation
- Exterior features: Vinyl siding; Back yard fenced
Interior
- Bedrooms: One bedroom has an ensuite
- Flooring: Carpet; Concrete; Laminate; Vinyl
- Bathrooms: 2 full bathrooms and 1 half bathroom
- Interior features: Carpet, concrete, laminate, and vinyl flooring
Neighborhood map
What this means for you Summary
Snapshot
- This is a 5-bed/2.5-bath single-family listed at $209k.
Deal economics
- At list price, monthly cash flow is $416 ($5k/yr) — positive.
- The deal already cash-flows at list — no discount required.
- Meets the 1% rule at list price ($2k rent vs $209k).
- Recommended offer: $206k (1.5% below list) — sets the bar for market timing.
- Cap rate 8.7% vs local median 4.6% in Portsmouth — top-decile yield for the area; either an underpriced asset or a hidden risk that comps aren't pricing in. Stress-test before assuming the spread holds.
Location & tenants
- Location reads 73/100 on livability (#172 in VA) — a middle-class / working-renter tenant base. Strengths: amenities A+, cost of living A+, housing A+; Watch: employment C-, crime F, commute F.
- Portsmouth City Public School District (urban): math 34% / reading 58% proficiency, ranked #107 of 131 in VA (top 82%) — families likely to look elsewhere, expect single-tenant / working-renter base with shorter leases.
- Zoned schools: Douglass Park Elementary (math 12% / reading 37%, grade F, #1,051 of 1,108 statewide, top 96%, 550 students, 98% FRL); I.C. Norcom High (math 39% / reading 58%, grade D, #301 of 319 statewide, top 95%, 1,043 students, 100% FRL) — zoned schools average 99% FRL vs 60% district-wide (39 pts higher); higher-poverty schools than district average — tighter screening recommended.
- Market conditions: Rents rising (+4.0%/yr); 64 active listings in the ZIP; 3 comparable units currently listed for rent nearby; rentals leasing fast (median 9d on market — plan ~1-2 weeks tenant-placement turnaround); 300 units permitted in Portsmouth city in 2024 (112 in 5+ unit buildings).
- At $2,362/mo this rent would consume 58% of the median local household income ($49k/yr) (locally 534% of renters already pay >50% of income on rent) — very limited rent-growth headroom before tenants either downsize or default.
Forward outlook
- In year one you build about $22k of equity ($1k loan paydown + $21k appreciation (10.0% local appreciation)).
- At projected returns (10.0% appreciation + 4.0% rent growth), your $59k cash investment doubles in ~3 years — after that, you're playing with house money.
- By year 2, paydown + projected appreciation supports a ~$36k cash-out refi (75% LTV) — recoverable capital for the next deal without selling this one.
Negotiation context
- It's been on market 15 days — a 2% lower offer ($206k) is reasonable based on typical stale-listing flexibility.
- 4 sale attempts since 5y ago with the ask held roughly flat each time — persistent listings suggest the price (not the market) is what's stuck; bring a comps-based counter.
Risks & watch-outs
- Climate carrying-cost: severe wind risk, 80% chance of damaging wind over 30y; extreme-heat days projected 7→16/yr by 2055 (HVAC capex compounding) — expect insurance premiums to compound above CPI over the hold.
Questions for the listing agent
- Is there a deadline driving the sale (1031 exchange, divorce, estate, relocation)? That informs how much negotiation room exists.
- Schools are B-rated — typically a magnet for longer-tenancy family renters. What's the average tenant stay here, and is there a school-zone premium baked into asking?
- Crime grade is F in this area — have there been break-ins, vandalism, or insurance claims at this property in the last 3 years? What carrier currently insures it and at what premium?
- What's the average days-on-market for RENTAL listings here right now (not sales)? A rising rental-DOM trend means longer vacancies and softer asking-rent achievability than the comps imply.
- What's the recent tenant-quality profile in this submarket — average credit score on applications, eviction rate, late-payment / NSF rate, and stable-employment percentage? A property-management company in the area should have these aggregated.
- How much new for-sale + rental construction is in the pipeline within 1–3 miles? Heavy new supply typically softens prices + rents 12–24 months out; constrained supply supports both.
Investment metrics
- 1% rule
- 1.13% ✓
- Cap rate
- 8.68%
- Cash-on-cash
- 8.53%
- DSCR
- 1.38
- GRM
- 7.4
CMA / ARV
- ARV (on-the-fly)
- $266,584
- Comps found
- 7
Show comp detail 7 sales within ~0.75 mi
| Address | Dist | Beds/Ba | Sqft | Sold | Price | $/sf | Match |
|---|---|---|---|---|---|---|---|
| 207 Fairview Cir N | 0.30mi | 4/1.5 (-1) | 1,371 (-3%) | 3mo | $270,000 | $197 | 69 |
| 19 Burtis St | 0.56mi | 4/2.0 (-1) | 1,400 (-1%) | 1mo | $85,000 | $61 | 63 |
| 31 Decatur St | 0.65mi | 4/2.0 (-1) | 1,400 (-1%) | 3mo | $265,000 | $189 | 58 |
| 4300 Deep Creek Blvd | 0.21mi | 4/1.0 (-1) | 1,300 (-8%) | 9mo | $230,000 | $177 | 58 |
| 22 Fairview Cir | 0.31mi | 4/1.0 (-1) | 1,552 (+9%) | 4mo | $150,000 | $97 | 56 |
| 4309 George Washington Hwy | 0.50mi | 4/3.0 (-1) | 1,543 (+9%) | 12mo | $290,000 | $188 | 45 |
| 25 Aylwin Rd | 0.56mi | 4/1.5 (-1) | 1,233 (-13%) | 9mo | $250,000 | $203 | 36 |
Match score weights: distance 35% · size 25% · config 20% · recency 20%. Top-matched comps best support the ARV.
Projected returns pro-forma
10.0% appreciation · 3.97% rent growth · sell at horizon
- IRR
- 30.9%
- Equity multiple
- 3.44×
- Total profit
- $142,676
- Equity at exit
- $188,284
- IRR
- 27.1%
- Equity multiple
- 7.91×
- Total profit
- $404,323
- Equity at exit
- $406,041
Cash invested: $58,520 (down + closing). Projections, not guarantees.
Landlord ↔ Tenant lean methodology
- Overall (STATE)
- 55 Moderately Landlord-Leaning
- State Virginia
- 55 Moderately Landlord-Leaning · D+2
- County
- — inherits STATE
- City
- — inherits STATE
ZIP-level market 23702
- Home prices YoY
- 5.2%
- Rents YoY
- 4.0%
- Active inventory
- 64
- Price-to-rent
- 7.4×
Monthly cashflow live
- Estimated rent
- $2,362 medium interval (Pro) →
- Mortgage (P&I)
- −$1,096
- Tax from tax record
- −$267 /mo · $3,203/yr
- Insurance
- −$87
- HOA
- −$0
- Vacancy / Maint / Mgmt
- −$496
- Net cashflow
- $416
Break-even live
Sensitivity live
| Price | -10% $534 | -5% $475 | +0% $416 | +5% $357 | +10% $297 |
|---|---|---|---|---|---|
| Rent | -10% $229 | -5% $323 | +0% $416 | +5% $509 | +10% $602 |
| Rate | -1.0pp $521 | -0.5pp $469 | base $416 | +0.5pp $362 | +1.0pp $307 |
UW: 25.0% down · 7.5% · 30yr · 1.5% tax · 5.0% vac · 8.0% maint · 8.0% mgmt
Financing live
Cash to close
- Down payment
- $52,250
- Closing costs
- $6,270
- Reserves months
- —
- Total cash needed
- —
Loan-product check · same deal, 3 products live
Conventional
25% down · 7.5% · 30yr
- Down + closing
- —
- Monthly P&I
- —
- Monthly cashflow
- —
- DSCR
- —
- Eligible?
- —
Personal DTI + credit; lowest rate.
DSCR
20% down · 8.5% · 30yr
- Down + closing
- —
- Monthly P&I
- —
- Monthly cashflow
- —
- DSCR
- —
- Eligible?
- —
No personal income docs; deal must DSCR.
Hard money
10% down · 12.0% · 12mo
- Down + closing
- —
- Monthly P&I
- —
- Monthly cashflow
- —
- DSCR
- —
- Eligible?
- —
Short-term bridge; refi at stabilization.
Rent comps 3 comps
| Address | Beds | Baths | Sqft | Rent | $/sqft | DOM | Units | Dist |
|---|---|---|---|---|---|---|---|---|
| 35 Fairview Cir S Portsmouth, VA | 4.0 | 1.5 | 1462 | $2,100 | $1.44 | 13d | 1 | 0.33mi |
| 22 Radford St Portsmouth, VA | 4.0 | 3.0 | 1651 | $2,550 | $1.54 | 4d | 1 | 1.10mi |
| 2215 Atlanta Ave Portsmouth, VA | 4.0 | 1.0 | 1628 | $2,150 | $1.32 | 8d | 1 | 1.31mi |
Listing history 9 events
-
2026-06-18days on market $209,000 Active 15 DOM
-
2026-06-17days on market $209,000 Active 14 DOM
-
2026-06-16days on market $209,000 Active 13 DOM
-
2026-06-15days on market $209,000 Active 12 DOM
-
2026-06-13days on market $209,000 Active 10 DOM
-
2026-06-09days on market $209,000 Active 6 DOM
-
2026-06-08days on market $209,000 Active 5 DOM
-
2026-06-07remarks 559-char remark
-
2026-06-07$209,000 Active 4 DOM
ⓘ Source: listings_history table (triggers on properties + properties_extension) + one-shot
backfill from property_details.listing_events for pre-trigger history.
Tax reassessment forecast VA · Resets to sale price
- Current annual tax
- $3,203 · $267/mo
- Projected year-2 tax
- $3,203 · $267/mo
- Expected delta
- $0/yr ($0/mo · 0.0%)
ⓘ Screening estimate from a state-policy table — verify with the county assessor before closing.
Climate risk First Street
- Flood 3/10 Moderate FEMA zone X (unshaded) · 12% chance over 30 yrs
- Wildfire 1/10 Low
- Heat 9/10 Extreme 7 d/yr ≥106°F today · 16 d/yr by 30 yrs out
- Wind 8/10 Severe 80% chance of damaging wind over 30 yrs
- Air quality 5/10 Major 6 unhealthy d/yr today · 7 by 30 yrs out
Nearby sold comps map
Loading sold comps map…
Walkable amenities ~0.75 mi
Loading nearby amenities…
Taxation est. · year 1
- Rental income
- $28,341
- − Mortgage interest
- −$11,707
- − Property taxes
- −$3,203
- − Insurance
- −$1,045
- − Repairs & maintenance
- −$2,267
- − Management
- −$2,267
- − Depreciation
- −$6,080
- Taxable income
- $1,772
- Est. tax owed @ 24.0%
- −$425
- After-tax cash flow
- $4,564/yr
For passive investors: Depreciation is non-cash, so a rental often shows a tax loss while cash-flowing — sheltering income. Rental losses are passive: they offset passive income freely, and up to $25,000/yr can offset ordinary (W-2) income if you actively participate and your MAGI is under $100k (phasing out to $0 by $150k); unused losses carry forward. On sale, claimed depreciation is recaptured at up to 25%, and gains may owe capital-gains tax (a 1031 exchange can defer both). Figures are a year-1 estimate at your 24.0% rate — not tax advice; consult a CPA.
Schools (NCES district)
- District
- Portsmouth City Public School District
- NCES district ID
- 5103000
- Math proficiency
- 34% ▼ -40.00%
- Reading proficiency
- 58% ▼ -12.00%
- Median HH income
- $46,152
- Composite
- 39.01/100
- National rank
- #4071
- State rank
- #107 of 131 in VA
Livability — Portsmouth
- Score
- 73/100
- State rank
- #172
- US rank
- #5381
Category grades
Schools grade is shown separately in the Schools card above.
Census & demographics
- Census place
- Portsmouth, VA
- County
- Portsmouth City · 96,366 people
- City population
- 96,366
- Metro
- Virginia Beach-Norfolk-Newport News, VA-NC
- Population (ZIP)
- 12,485
- Household income
- $48,835
- Rent vs Own
- Severe rent burden
- 534.0
Population outlook (Portsmouth County) Hauer SSP2
- Today (2025)
- 96,730 people
- By 2030
- 96,760 · +0.0%
- By 2040
- 96,573 · -0.2%
- By 2050
- 95,606 · -1.2%
- By 2075
- 93,579 · -3.3%
- By 2100
- 83,756 · -13.4%
Race, ethnicity, and origin ACS 2023
- Neighborhood character
- Diverse neighborhood (Simpson 0.62)
- Race & ethnicity
- Black 50% White 35% Two or more races 9% Hispanic / Latino 8%
- Hispanic origin (detail)
- Mexican 2% Puerto Rican 3%
- Common ancestry
- Lithuanian 1% Italian 1% Slovak 1%
- Foreign-born
- 4% · Canada, South Korea
- Languages at home
- 95% English-only · Spanish 4%
Political lean MEDSL · Portsmouth
- 2024 margin
- Solid D (+38.6) · D 68.6% · R 30.0% · Other 1.4%
- 2008→2024 swing
- -0.7pp no change · 2008: 39.3pp · 2024: 38.6pp
- All cycles
- 2024: D+38.6 2020: D+40.8 2016: D+36.5 2012: D+39.6 2008: D+39.3
Not yet ingested
- Civics
- —
Market trends
- HPI YoY
- ▲ 16.70%
- Current HPI
- 340.0817
- Rent YoY
- ▲ 3.97%
- Metro
- Virginia Beach-Norfolk-Newport News, VA-NC
- State GDP YoY
- ▲ 2.40%
- F500 in state
- 50
Industry mix (Fortune 500 HQ in VA)
| Industry | F500 HQs | Revenue |
|---|---|---|
| Aerospace / Defense | 4 | $236B |
|
||
| Technology / Defense | 3 | $32B |
|
||
| Financial Services | 2 | $176B |
|
||
| Utilities | 2 | $27B |
|
||
| Insurance | 2 | $25B |
|
||
| Technology | 2 | $15B |
|
||
Price history
-1.4% since first listed13 events — show timeline
- 2026-06-03 Listed $209,000 REINMLS
- 2025-07-25 Listing Removed — REINMLS
- 2025-07-18 Contingent — REINMLS
- 2025-07-10 Pending — REINMLS
- 2025-07-02 Price Changed $250,000 REINMLS
- 2025-05-28 Price Changed $290,000 REINMLS
- 2025-05-02 Listed $320,000 REINMLS
- 2021-08-17 Sold (Public Records) $239,900 Public Records
- 2021-06-18 Pending — REINMLS
- 2021-06-18 Relisted — REINMLS
- 2021-06-10 Contingent — REINMLS
- 2021-05-11 Listed $239,900 REINMLS
- 2006-03-29 Sold (Public Records) $212,000 Public Records
Property tax history
+2.5%/yrLatest (2025): $3,203 · +2.0% YoY. Source: county tax records.
Cash-flow waterfall
monthlySold comps — $/sqft
last 12 mo · ≤1 miLoading sold comps…