 🏷️ Likely Rental
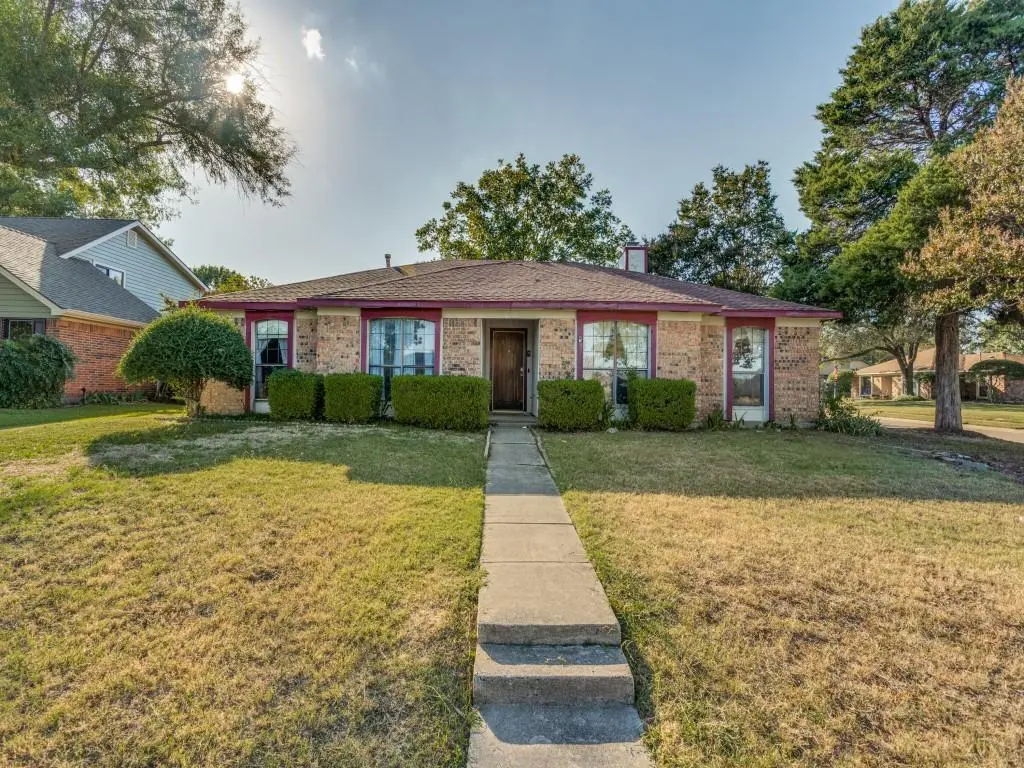
1807 Eldora Ct · Richardson, TX
Flood risk 1/10 · Minimal
- FEMA flood zone
- X (unshaded)
- Chance of flooding over 30 yrs
- 0.0%
- Est. flood insurance / yr
- $507 – $1,088
Fire risk 1/10 · Minimal
- Est. fire insurance / yr
- $1,222 – $2,270
Heat risk 7/10 · Major
- Hot days now (above 109°F)
- 7 days/yr
- Hot days in 30 yrs
- 23 days/yr
Wind risk 6/10 · Moderate
- Chance of severe wind over 30 yrs
- 27.0%
Air-quality risk 3/10 · Minor
- Unhealthy air days now
- 3 days/yr
- Unhealthy air days in 30 yrs
- 4 days/yr
Risk factors via First Street. Map © Google.
Why this score? — see what drove the D- grade
The composite is a weighted blend of 9 inputs, each scored 0–100. Each bar is that input's sub-score; the figure is the points it added to the 100-point composite (weight × sub-score).
- ARV discount +15.0/15.0
- Cash flow +7.2/30.0
- Livability +4.2/5.0
- Schools +3.7/10.0
- 1% rule +3.3/10.0
- Rent growth +2.5/5.0
- Condition / age +2.5/5.0
- DSCR +1.4/10.0
- Appreciation +0.0/10.0
$300,000
🖨 Deal sheet (PDF) 📄 Offer letter ✓ Due diligence
Listing remarks MLS
UPDATE ON PROBATE: Seller is in process of completing requirements from Judge. Offers will be collected until such time as court date can be requested. We have multiple cash offers for at least full price, no option period. Offers with financing or below full price will not be considered. Let’s start with the good news: this is a 4-bedroom home on a corner lot in a great neighborhood with Richardson schools, close to trails, parks, and Central Expressway. Recent sales in the area top $400k, and rentals are pushing $3,000 per month. So what’s the best feature of this house? The crazy-low price. Now the not-so-good news: this property is a full renovation project—from the roof to under the foundation. Major repairs needed include a total plumbing replacement (estimate available for $27,500), a new roof, possible foundation work, HVAC replacement, and a complete cosmetic overhaul of floors, fixtures, kitchen, and bathrooms. The large yard is ready for a new fence too. Buyers should also know that patience is required—contracts are subject to probate court approval, which could take 6–12 weeks or more. All offers will be presented, but full price or higher cash offers and offers with no option period are strongly preferred. No Seller’s Disclosure is available, as this is an estate property. As of Jan 15, we have in excess of 20 offers. Bring your best and highest right away—initial offers should be your strongest. Not all offers will receive a response. If your offer is competitive you will be contacted. If not, not. AGENTS: See Private remarks for language required by Seller's probate attorney. This one isn’t for the faint of heart—but for the right buyer, it’s a golden opportunity to create serious value in a desirable location.
Key facts
- Large backyard
- Richardson isd
- 0.24 acre lot
Tags
Neighborhood map
What this means for you Summary
Snapshot
- This is a 3-bed/2.0-bath single-family listed at $300k.
Deal economics
- At list price, monthly cash flow is $-417 ($-5k/yr) — negative.
- To cash-flow at today's rent, offer at most $226k (24.5% below list).
- To meet the 1% rule (rent ≥ 1% of price), the offer needs to be $250k (16.6% below list).
- Recommended offer: $226k (24.5% below list) — sets the bar for cash-flow.
- Cap rate 4.6% vs local median 2.7% in Richardson — top-decile yield for the area; either an underpriced asset or a hidden risk that comps aren't pricing in. Stress-test before assuming the spread holds.
Location & tenants
- Location reads 85/100 on livability (#5 in TX, #551 nationally) — a professional / high-income tenant draw. Strengths: commute A+, employment A+, housing A+; Watch: cost of living D+.
- Richardson ISD (urban): math 40% / reading 44% proficiency, ranked #316 of 826 in TX (top 38%) — families likely to look elsewhere, expect single-tenant / working-renter base with shorter leases.
- Market conditions: Rents flat; 152 active listings in the ZIP; 33 comparable units currently listed for rent nearby; rentals at typical pace (median 15d on market — plan ~3-4 weeks tenant-placement turnaround); solid renter incomes; 12,577 units permitted in Dallas County in 2024 (6,829 in 5+ unit buildings).
- This rent runs 32% of the median local income ($93k/yr) — at the standard rent-burdened threshold; future hikes will face affordability resistance.
Forward outlook
- Local home prices are declining (-3.0%/yr); year-one equity from $2k of loan paydown is wiped out by about $9k of value loss. Plan a longer hold.
- Dallas County population projected at +35% by 2050 — long-run rental-demand tailwind backs the buy-and-hold thesis.
Negotiation context
- It's been on market 271 days — a 12% lower offer ($264k) is reasonable based on typical stale-listing flexibility.
- 3 sale attempts since 4y ago with the ask held roughly flat each time — persistent listings suggest the price (not the market) is what's stuck; bring a comps-based counter.
Risks & watch-outs
- Watch-outs: property tax is 2.8% of price.
- Climate carrying-cost: major wind risk, 27% chance of damaging wind over 30y; extreme-heat days projected 7→23/yr by 2055 (HVAC capex compounding) — expect insurance premiums to compound above CPI over the hold.
Questions for the listing agent
- What do current leases actually rent for vs. the listed asking? Can we see a recent rent roll and the last 12 months of T-12 income?
- It's been on market 271 days. Have you received any prior offers? Is the seller open to a 25% concession, seller financing, or rate buy-down credit?
- Built in 1978 — when were the roof, HVAC, electrical panel, plumbing, and water heater last replaced?
- Property tax is high relative to price — has the assessment been appealed recently, and will the sale trigger a re-assessment?
- Why hasn't it sold? Are there any deal-killer items the seller is aware of (foundation, flood, title, zoning, code violations)?
- Is there a deadline driving the sale (1031 exchange, divorce, estate, relocation)? That informs how much negotiation room exists.
- Schools are A-rated — typically a magnet for longer-tenancy family renters. What's the average tenant stay here, and is there a school-zone premium baked into asking?
- The area grade is low — what's the realistic commute time and amenity access for the typical tenant pool here? Any planned neighborhood developments (good or bad) we should know about?
- What's the average days-on-market for RENTAL listings here right now (not sales)? A rising rental-DOM trend means longer vacancies and softer asking-rent achievability than the comps imply.
- What's the recent tenant-quality profile in this submarket — average credit score on applications, eviction rate, late-payment / NSF rate, and stable-employment percentage? A property-management company in the area should have these aggregated.
- How much new for-sale + rental construction is in the pipeline within 1–3 miles? Heavy new supply typically softens prices + rents 12–24 months out; constrained supply supports both.
Investment metrics
- 1% rule
- 0.83% ✗
- Cap rate
- 4.63%
- Cash-on-cash
- -5.95%
- DSCR
- 0.74
- GRM
- 10.0
CMA / ARV
- ARV (median comp)
- $399,771
- List price
- $300,000
- Delta
- -24.96%
- Verdict
- UNDERPRICED
- Comps
- 20 within 1.0 mi
Show comp detail 12 sales within ~0.75 mi
| Address | Dist | Beds/Ba | Sqft | Sold | Price | $/sf | Match |
|---|---|---|---|---|---|---|---|
| 1706 Damian Way | 0.14mi | 3/2.0 | 1,910 (+1%) | 2mo | $379,990 | $199 | 91 |
| 1722 Barclay Dr | 0.24mi | 3/2.0 | 1,873 (-1%) | 4mo | $365,000 | $195 | 84 |
| 1604 Carol Stream Dr | 0.16mi | 3/2.0 | 1,742 (-8%) | 2mo | $339,000 | $195 | 77 |
| 1910 Forestdale Dr | 0.35mi | 3/2.0 | 1,833 (-4%) | 3mo | $340,000 | $185 | 75 |
| 1700 Damian Way | 0.12mi | 3/2.0 | 1,629 (-14%) | 1mo | $379,900 | $233 | 70 |
| 44 Merrie Cir | 0.45mi | 4/2.0 (+1) | 1,822 (-4%) | 0mo | $364,999 | $200 | 67 |
| 1625 Aurora Dr | 0.30mi | 3/2.5 | 2,152 (+13%) | 2mo | $360,000 | $167 | 61 |
| 2109 Portsmouth Dr | 0.59mi | 3/2.0 | 2,053 (+8%) | 2mo | $550,000 | $268 | 58 |
| 1613 Sara Ln | 0.66mi | 3/2.5 | 2,032 (+7%) | 1mo | $432,999 | $213 | 55 |
| 1616 Sara Ln | 0.69mi | 3/2.0 | 1,756 (-8%) | 4mo | $405,000 | $231 | 52 |
| 1822 Clemson Dr | 0.69mi | 3/2.0 | 2,071 (+9%) | 4mo | $434,900 | $210 | 50 |
| 1301 N Yale Blvd | 0.66mi | 4/2.5 (+1) | 2,178 (+15%) | 4mo | $385,000 | $177 | 34 |
Match score weights: distance 35% · size 25% · config 20% · recency 20%. Top-matched comps best support the ARV.
Projected returns pro-forma
-3.0% appreciation · 0.19% rent growth · sell at horizon
- IRR
- -30.2%
- Equity multiple
- 0.03×
- Total profit
- $-81,799
- Equity at exit
- $44,731
- IRR
- -54.1%
- Equity multiple
- -0.56×
- Total profit
- $-131,148
- Equity at exit
- $25,939
Cash invested: $84,000 (down + closing). Projections, not guarantees.
Landlord ↔ Tenant lean methodology
- Overall (STATE)
- 87 Strongly Landlord-Friendly
- State Texas
- 87 Strongly Landlord-Friendly · R+5
- County
- — inherits STATE
- City
- — inherits STATE
ZIP-level market 75081
- Rents YoY
- 0.2%
- Active inventory
- 152
- Price-to-rent
- 10.0×
Monthly cashflow live
- Estimated rent
- $2,503 high interval (Pro) →
- Mortgage (P&I)
- −$1,573
- Tax from tax record
- −$696 /mo · $8,350/yr
- Insurance
- −$125
- HOA
- −$0
- Vacancy / Maint / Mgmt
- −$526
- Net cashflow
- $-417
Break-even live
Sensitivity live
| Price | -10% $-247 | -5% $-332 | +0% $-417 | +5% $-502 | +10% $-586 |
|---|---|---|---|---|---|
| Rent | -10% $-614 | -5% $-516 | +0% $-417 | +5% $-318 | +10% $-219 |
| Rate | -1.0pp $-266 | -0.5pp $-340 | base $-417 | +0.5pp $-494 | +1.0pp $-573 |
UW: 25.0% down · 7.5% · 30yr · 1.5% tax · 5.0% vac · 8.0% maint · 8.0% mgmt
Financing live
Cash to close
- Down payment
- $75,000
- Closing costs
- $9,000
- Reserves months
- —
- Total cash needed
- —
Loan-product check · same deal, 3 products live
Conventional
25% down · 7.5% · 30yr
- Down + closing
- —
- Monthly P&I
- —
- Monthly cashflow
- —
- DSCR
- —
- Eligible?
- —
Personal DTI + credit; lowest rate.
DSCR
20% down · 8.5% · 30yr
- Down + closing
- —
- Monthly P&I
- —
- Monthly cashflow
- —
- DSCR
- —
- Eligible?
- —
No personal income docs; deal must DSCR.
Hard money
10% down · 12.0% · 12mo
- Down + closing
- —
- Monthly P&I
- —
- Monthly cashflow
- —
- DSCR
- —
- Eligible?
- —
Short-term bridge; refi at stabilization.
Rent comps 33 comps
| Address | Beds | Baths | Sqft | Rent | $/sqft | DOM | Units | Dist |
|---|---|---|---|---|---|---|---|---|
| 1704 Carol Stream Dr Richardson, TX | 3.0 | 2.0 | 1718 | $2,300 | $1.34 | 20d | 1 | 0.19mi |
| 1607 Heather Glen Ct Richardson, TX | 4.0 | 2.0 | 1614 | $2,500 | $1.55 | 14d | 1 | 0.43mi |
| 1513 Purdue Cir Richardson, TX | 4.0 | 2.0 | 1981 | $2,600 | $1.31 | 8d | 1 | 0.46mi |
| 1710 Woodoak Dr Richardson, TX | 3.0 | 2.0 | 2233 | $3,800 | $1.70 | 44d | 1 | 0.64mi |
| 2105 E Collins Blvd Richardson, TX | 3.0 | 2.0 | 1594 | $2,500 | $1.57 | 44d | 1 | 0.64mi |
| 1301 Grant Dr Richardson, TX | 3.0 | 2.5 | 2356 | $2,545 | $1.08 | 25d | 1 | 0.68mi |
| 1905 Colgate Dr Richardson, TX | 3.0 | 2.0 | 2021 | $2,600 | $1.29 | 44d | 1 | 0.78mi |
| 3434 Crossbow Ln Garland, TX | 3.0 | 2.0 | 1669 | $2,150 | $1.29 | 5d | 1 | 0.83mi |
| 1801 Hanover Dr Richardson, TX | 4.0 | 2.5 | 2447 | $3,280 | $1.34 | 44d | 1 | 0.89mi |
| 5521 Jester Dr Garland, TX | 4.0 | 2.0 | 1646 | $2,500 | $1.52 | 2d | 1 | 0.95mi |
| 900 Westminster Dr Richardson, TX | 3.0 | 2.0 | 2091 | $2,950 | $1.41 | 8d | 1 | 1.01mi |
| 3309 Ivanhoe Ln Garland, TX | 4.0 | 2.5 | 2233 | $2,495 | $1.12 | 44d | 1 | 1.03mi |
| 5830 Jester Dr Garland, TX | 3.0 | 2.5 | 1953 | $8,900 | $4.56 | 44d | 1 | 1.04mi |
| 5830 Jester Dr Unit 1239935P Garland, TX | 3.0 | 2.5 | 1948 | $11,090 | $5.69 | 22d | 1 | 1.04mi |
| 1050 Galatyn Pkwy Richardson, TX | 1.0–3.0 | 1.0–2.0 | 1034 | $2,942 | $2.84 | 0d | 37 | 1.07mi |
| 1507 Auburn Dr Richardson, TX | 4.0 | 2.0 | 2213 | $2,700 | $1.22 | 19d | 1 | 1.08mi |
| 3234 Castle Rock Ln Garland, TX | 3.0 | 2.0 | 1644 | $2,500 | $1.52 | 6d | 1 | 1.11mi |
| 714 N Plano Rd Richardson, TX | 3.0 | 3.5 | 2019 | $2,795 | $1.38 | 21d | 1 | 1.16mi |
| 1810 Tulane Dr Richardson, TX | 4.0 | 2.5 | 2211 | $2,750 | $1.24 | 44d | 1 | 1.16mi |
| 2301 Performance Dr Richardson, TX | 1.0–3.0 | 1.0–2.5 | 1280 | $2,400 | $1.88 | 0d | 22 | 1.20mi |
| 2323 Plaza Blvd Richardson, TX | 3.0 | 1.0–2.0 | 1001 | $3,383 | $3.38 | 0d | 36 | 1.21mi |
| 1801 N Greenville Ave Richardson, TX | 2.0 | 1.0–2.0 | 969 | $2,072 | $2.14 | 0d | 41 | 1.22mi |
| 2930 Churchill Way Garland, TX | 3.0 | 2.0 | 1361 | $2,250 | $1.65 | 0d | 1 | 1.23mi |
| 509 Shadow Bend Dr Richardson, TX | 4.0 | 4.0 | 2213 | $3,500 | $1.58 | 44d | 1 | 1.25mi |
| 5818 Townshire Rd Garland, TX | 3.0 | 2.0 | 1550 | $2,300 | $1.48 | 8d | 1 | 1.27mi |
| 2305 Plaza Blvd Richardson, TX | 1.0–3.0 | 1.0–2.0 | 1005 | $2,606 | $2.59 | 0d | 45 | 1.28mi |
| 1735 N Greenville Ave Richardson, TX | 3.0 | 1.0–2.0 | 960 | $2,939 | $3.06 | 0d | 164 | 1.30mi |
| 1735 N Greenville Ave Richardson, TX | 3.0 | 1.0–2.0 | 1079 | $3,250 | $3.01 | 44d | 211 | 1.30mi |
| 1705 N Greenville Ave Richardson, TX | 1.0–2.0 | 1.0–2.0 | 1102 | $2,446 | $2.22 | 0d | 25 | 1.37mi |
| 3401 High Plateau Dr Garland, TX | 3.0 | 2.0 | 1903 | $2,500 | $1.31 | 44d | 1 | 1.40mi |
| 2710 Routh Creek Pkwy Richardson, TX | 1.0–2.0 | 1.0–2.0 | 1006 | $2,489 | $2.47 | 44d | 43 | 1.41mi |
| 2710 Routh Creek Pkwy Richardson, TX | 1.0–3.0 | 1.0–2.0 | 1094 | $2,841 | $2.60 | 0d | 40 | 1.41mi |
| 2718 Holy Cross Ln Garland, TX | 3.0 | 2.0 | 1534 | $2,270 | $1.48 | 13d | 1 | 1.43mi |
Listing history 4 events
-
2025-08-28$300,000 Active 1842-char remark
Show marketing remark (1842 chars)
UPDATE ON PROBATE: Seller is in process of completing requirements from Judge. Offers will be collected until such time as court date can be requested. We have multiple cash offers for at least full price, no option period. Offers with financing or below full price will not be considered. Let’s start with the good news: this is a 4-bedroom home on a corner lot in a great neighborhood with Richardson schools, close to trails, parks, and Central Expressway. Recent sales in the area top $400k, and rentals are pushing $3,000 per month. So what’s the best feature of this house? The crazy-low price. Now the not-so-good news: this property is a full renovation project—from the roof to under the foundation. Major repairs needed include a total plumbing replacement (estimate available for $27,500), a new roof, possible foundation work, HVAC replacement, and a complete cosmetic overhaul of floors, fixtures, kitchen, and bathrooms. The large yard is ready for a new fence too. Buyers should also know that patience is required—contracts are subject to probate court approval, which could take 6–12 weeks or more. All offers will be presented, but full price or higher cash offers and offers with no option period are strongly preferred. No Seller’s Disclosure is available, as this is an estate property. As of Jan 15, we have in excess of 20 offers. Bring your best and highest right away—initial offers should be your strongest. Not all offers will receive a response. If your offer is competitive you will be contacted. If not, not. AGENTS: See Private remarks for language required by Seller's probate attorney. This one isn’t for the faint of heart—but for the right buyer, it’s a golden opportunity to create serious value in a desirable location.
-
2022-10-21status Active
-
2022-10-18historical Active Option Contract
-
2022-10-12$300,000 Active
ⓘ Source: listings_history table (triggers on properties + properties_extension) + one-shot
backfill from property_details.listing_events for pre-trigger history.
Tax reassessment forecast TX · Resets to sale price
- Current annual tax
- $8,350 · $696/mo
- Projected year-2 tax
- $8,350 · $696/mo
- Expected delta
- $0/yr ($0/mo · 0.0%)
ⓘ Screening estimate from a state-policy table — verify with the county assessor before closing.
Climate risk First Street
- Flood 1/10 Low FEMA zone X (unshaded) · 0% chance over 30 yrs
- Wildfire 1/10 Low
- Heat 7/10 Severe 7 d/yr ≥109°F today · 23 d/yr by 30 yrs out
- Wind 6/10 Major 27% chance of damaging wind over 30 yrs
- Air quality 3/10 Moderate 3 unhealthy d/yr today · 4 by 30 yrs out
Nearby sold comps map
Loading sold comps map…
Walkable amenities ~0.75 mi
Loading nearby amenities…
Taxation est. · year 1
- Rental income
- $30,036
- − Mortgage interest
- −$16,805
- − Property taxes
- −$8,350
- − Insurance
- −$1,500
- − Repairs & maintenance
- −$2,403
- − Management
- −$2,403
- − Depreciation
- −$8,727
- Taxable loss
- −$10,151
- Est. tax savings @ 24.0%
- +$2,436
- After-tax cash flow
- $-2,564/yr
For passive investors: Depreciation is non-cash, so a rental often shows a tax loss while cash-flowing — sheltering income. Rental losses are passive: they offset passive income freely, and up to $25,000/yr can offset ordinary (W-2) income if you actively participate and your MAGI is under $100k (phasing out to $0 by $150k); unused losses carry forward. On sale, claimed depreciation is recaptured at up to 25%, and gains may owe capital-gains tax (a 1031 exchange can defer both). Figures are a year-1 estimate at your 24.0% rate — not tax advice; consult a CPA.
Schools (NCES district)
- District
- Richardson ISD
- NCES district ID
- 4837020
- Math proficiency
- 40% ▼ -14.00%
- Reading proficiency
- 44% ▼ -6.00%
- Median HH income
- $54,609
- Composite
- 36.58/100
- National rank
- #4633
- State rank
- #316 of 826 in TX
Livability — Richardson
- Score
- 85/100
- State rank
- #5
- US rank
- #551
Category grades
Schools grade is shown separately in the Schools card above.
Census & demographics
- Census place
- Richardson, TX
- County
- Dallas County · 2,612,404 people
- City population
- 118,731
- Metro
- Dallas-Fort Worth-Arlington, TX
- Population (ZIP)
- 36,544
- Household income
- $93,165
- Rent vs Own
- Severe rent burden
- 1347.0
Population outlook (Dallas County) Hauer SSP2
- Today (2025)
- 2,979,839 people
- By 2030
- 3,191,823 · +7.1%
- By 2040
- 3,619,611 · +21.5%
- By 2050
- 4,026,915 · +35.1%
- By 2075
- 4,957,073 · +66.4%
- By 2100
- 5,508,725 · +84.9%
Race, ethnicity, and origin ACS 2023
- Neighborhood character
- Diverse neighborhood (Simpson 0.70)
- Race & ethnicity
- White 46% Black 21% Hispanic / Latino 18% Asian 11% Two or more races 8%
- Hispanic origin (detail)
- Mexican 15%
- Common ancestry
- Arab 2% Lithuanian 2% Slovak 2%
- Foreign-born
- 28% · Canada, China, Vietnam
- Languages at home
- 61% English-only · Spanish 15% Other Indo-European 5% Arabic 4%
Political lean MEDSL · Dallas
- 2024 margin
- Strong D (+22.2) · D 60.2% · R 38.0% · Other 1.8%
- 2008→2024 swing
- +6.9pp toward D · 2008: 15.3pp · 2024: 22.2pp
- All cycles
- 2024: D+22.2 2020: D+31.6 2016: D+26.2 2012: D+15.4 2008: D+15.3
Not yet ingested
- Civics
- —
Market trends
- HPI YoY
- ▼ -290.20%
- Current HPI
- 305.9843
- Rent YoY
- ▲ 0.19%
- Metro
- Dallas-Fort Worth-Arlington, TX
- State GDP YoY
- ▲ 3.95%
- F500 in state
- 110
Industry mix (Fortune 500 HQ in TX)
| Industry | F500 HQs | Revenue |
|---|---|---|
| Energy | 16 | $1,198B |
|
||
| Technology | 5 | $198B |
|
||
| Engineering / Construction | 4 | $72B |
|
||
| Energy Services | 3 | $60B |
|
||
| Utilities | 3 | $41B |
|
||
| Healthcare | 2 | $330B |
|
||
Price history
+0.0% since first listed4 events — show timeline
- 2025-08-28 Listed $300,000 NTREIS
- 2022-10-21 Relisted — NTREIS
- 2022-10-18 Contingent — NTREIS
- 2022-10-12 Listed $300,000 NTREIS
Property tax history
+5.6%/yrLatest (2025): $8,350 · +0.0% YoY. Source: county tax records.
Cash-flow waterfall
monthlySold comps — $/sqft
last 12 mo · ≤1 miLoading sold comps…