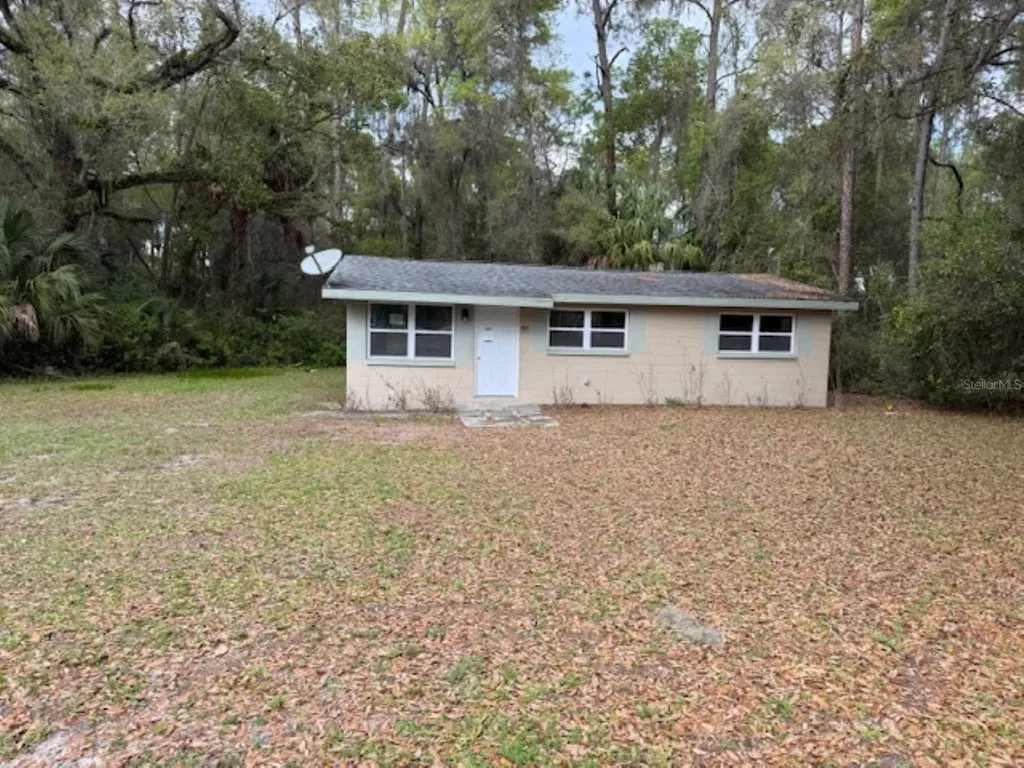
1565 W Lockport Ln · Dunnellon, FL
Flood risk 1/10 · Minimal
- FEMA flood zone
- X (unshaded)
- Chance of flooding over 30 yrs
- 0.0%
- Est. flood insurance / yr
- $507 – $1,088
Fire risk 4/10 · Minor
- Est. fire insurance / yr
- $947 – $1,759
Heat risk 9/10 · Severe
- Hot days now (above 106°F)
- 7 days/yr
- Hot days in 30 yrs
- 23 days/yr
Wind risk 9/10 · Severe
- Chance of severe wind over 30 yrs
- 99.0%
Air-quality risk 2/10 · Minimal
- Unhealthy air days now
- 0 days/yr
- Unhealthy air days in 30 yrs
- 1 days/yr
Risk factors via First Street. Map © Google.
Why this score? — see what drove the B+ grade
The composite is a weighted blend of 9 inputs, each scored 0–100. Each bar is that input's sub-score; the figure is the points it added to the 100-point composite (weight × sub-score).
- Cash flow +30.0/30.0
- ARV discount +15.0/15.0
- 1% rule +10.0/10.0
- DSCR +10.0/10.0
- Schools +4.1/10.0
- Livability +3.5/5.0
- Rent growth +2.5/5.0
- Condition / age +2.5/5.0
- Appreciation +0.1/10.0
$93,112
🖨 Deal sheet (PDF) 📄 Offer letter ✓ Due diligence
Listing remarks
If you are a nature enthusiast and enjoy boating, hiking and outdoor activities, look no further! This charming 2 Bd/ 1 Ba home with an abundance of light is your perfect retreat. After spending the day at Rainbow Sprngs State park or on the Withlacoochee River, you can return to your cozy home to relax and continue to enjoy nature in your own yard surrounded by beauitul trees. You can't beat Dunnellon for endless opportunities to enjoy nature. Never fear if Golf is your passion, it has premier golf courses as well. The home needs some TLC, but you won't believe the price! Hurry, this one will go fast. REPORTED: ". .an unsolved murder that occurred in this home in 2000.. ". Sel
Key facts
- Premier golf courses
- Withlacoochee river
- 5,000 sq ft lot
Tags
Neighborhood map
What this means for you Summary
Snapshot
- This is a 2-bed/1.0-bath single-family listed at $93k.
Deal economics
- At list price, monthly cash flow is $489 ($6k/yr) — positive.
- The deal already cash-flows at list — no discount required.
- Meets the 1% rule at list price ($1k rent vs $93k).
- Recommended offer: $92k (1.5% below list) — sets the bar for market timing.
Location & tenants
- Location reads 70/100 on livability (#443 in FL) — a middle-class / working-renter tenant base. Strengths: crime A+, cost of living A+, health & safety A+; Watch: amenities F, commute F, employment F.
- Citrus (rural): math 49% / reading 50% proficiency, ranked #44 of 73 in FL (top 60%) — families likely to look elsewhere, expect single-tenant / working-renter base with shorter leases.
- Zoned schools: Central Ridge Elementary School (math 41% / reading 44%, grade F, #1,383 of 2,144 statewide, top 65%, 723 students, 64% FRL); Citrus Springs Middle School (math 55% / reading 54%, grade B-, #183 of 571 statewide, top 34%, 821 students, 59% FRL); Citrus High School (math 34% / reading 51%, grade F, #264 of 667 statewide, top 41%, 1,503 students, 54% FRL) — zoned schools at 59% FRL track the district average.
- Market conditions: 1247 active listings in the ZIP; 2,443 units permitted in Citrus County in 2024 (0 in 5+ unit buildings).
Forward outlook
- Local home prices are declining (-3.0%/yr); year-one equity from $644 of loan paydown is wiped out by about $3k of value loss. Plan a longer hold.
- Citrus County population projected to shrink 10% by 2050 — rents likely to lag national; underwrite the cash flow, not the appreciation.
- At projected returns (-3.0% appreciation + 3.0% rent growth), your $26k cash investment doubles in ~6 years — after that, you're playing with house money.
Negotiation context
- It's been on market 27 days — a 2% lower offer ($92k) is reasonable based on typical stale-listing flexibility.
- 4 sale attempts since 15y ago with the ask held roughly flat each time — persistent listings suggest the price (not the market) is what's stuck; bring a comps-based counter.
Risks & watch-outs
- Watch-outs: built in 1959 — expect roof / HVAC / electrical / plumbing capex.
- Climate carrying-cost: severe wind risk, 99% chance of damaging wind over 30y; extreme-heat days projected 7→23/yr by 2055 (HVAC capex compounding) — expect insurance premiums to compound above CPI over the hold.
Questions for the listing agent
- Built in 1959 — when were the roof, HVAC, electrical panel, plumbing, and water heater last replaced?
- Is there a deadline driving the sale (1031 exchange, divorce, estate, relocation)? That informs how much negotiation room exists.
- Schools are D-rated, which usually means shorter tenancies and higher turnover. Who's the typical renter profile here, and what's been the actual vacancy rate?
- What's the average days-on-market for RENTAL listings here right now (not sales)? A rising rental-DOM trend means longer vacancies and softer asking-rent achievability than the comps imply.
- What's the recent tenant-quality profile in this submarket — average credit score on applications, eviction rate, late-payment / NSF rate, and stable-employment percentage? A property-management company in the area should have these aggregated.
- How much new for-sale + rental construction is in the pipeline within 1–3 miles? Heavy new supply typically softens prices + rents 12–24 months out; constrained supply supports both.
Investment metrics
- 1% rule
- 1.57% ✓
- Cap rate
- 12.60%
- Cash-on-cash
- 22.51%
- DSCR
- 2.00
- GRM
- 5.3
CMA / ARV
- ARV (on-the-fly)
- $146,880
- Comps found
- 1
Show comp detail 1 sale within ~0.75 mi
| Address | Dist | Beds/Ba | Sqft | Sold | Price | $/sf | Match |
|---|---|---|---|---|---|---|---|
| 1758 W J Williams Ln | 0.30mi | 2/1.0 | 912 (+6%) | 12mo | $155,000 | $170 | 67 |
Match score weights: distance 35% · size 25% · config 20% · recency 20%. Top-matched comps best support the ARV.
Projected returns pro-forma
-3.0% appreciation · 3.0% rent growth · sell at horizon
- IRR
- 15.4%
- Equity multiple
- 1.62×
- Total profit
- $16,096
- Equity at exit
- $13,883
- IRR
- 24.1%
- Equity multiple
- 3.08×
- Total profit
- $54,270
- Equity at exit
- $8,051
Cash invested: $26,071 (down + closing). Projections, not guarantees.
Landlord ↔ Tenant lean methodology
- Overall (STATE)
- 87 Strongly Landlord-Friendly
- State Florida
- 87 Strongly Landlord-Friendly · R+3
- County
- — inherits STATE
- City
- — inherits STATE
ZIP-level market 34434
- Home prices YoY
- -2.9%
- Active inventory
- 1247
- Price-to-rent
- 5.3×
Monthly cashflow live
- Estimated rent
- $1,461 medium interval (Pro) →
- Mortgage (P&I)
- −$488
- Tax from tax record
- −$138 /mo · $1,660/yr
- Insurance
- −$39
- HOA
- −$0
- Lot rent
- −$0
- Vacancy / Maint / Mgmt
- −$307
- Net cashflow
- $489
Break-even live
Sensitivity live
| Price | -10% $542 | -5% $515 | +0% $489 | +5% $463 | +10% $436 |
|---|---|---|---|---|---|
| Rent | -10% $374 | -5% $431 | +0% $489 | +5% $547 | +10% $605 |
| Rate | -1.0pp $536 | -0.5pp $513 | base $489 | +0.5pp $465 | +1.0pp $440 |
UW: 25.0% down · 7.5% · 30yr · 1.5% tax · 5.0% vac · 8.0% maint · 8.0% mgmt
Financing live
Cash to close
- Down payment
- $23,278
- Closing costs
- $2,793
- Reserves months
- —
- Total cash needed
- —
Loan-product check · same deal, 3 products live
Conventional
25% down · 7.5% · 30yr
- Down + closing
- —
- Monthly P&I
- —
- Monthly cashflow
- —
- DSCR
- —
- Eligible?
- —
Personal DTI + credit; lowest rate.
DSCR
20% down · 8.5% · 30yr
- Down + closing
- —
- Monthly P&I
- —
- Monthly cashflow
- —
- DSCR
- —
- Eligible?
- —
No personal income docs; deal must DSCR.
Hard money
10% down · 12.0% · 12mo
- Down + closing
- —
- Monthly P&I
- —
- Monthly cashflow
- —
- DSCR
- —
- Eligible?
- —
Short-term bridge; refi at stabilization.
Listing history 9 events
-
2026-04-23status Pending
-
2026-04-13status Active
-
2026-04-02status Pending
-
2026-03-16$93,112 Active
-
2024-07-31status Pending
-
2024-04-27$169,000 Active
-
2020-04-13soldstatus $92,500
-
2012-02-13historical
-
2011-08-13$20,000
ⓘ Source: listings_history table (triggers on properties + properties_extension) + one-shot
backfill from property_details.listing_events for pre-trigger history.
Tax reassessment forecast FL · Resets to sale price
- Current annual tax
- $1,660 · $138/mo
- Projected year-2 tax
- $1,660 · $138/mo
- Expected delta
- $0/yr ($0/mo · 0.0%)
ⓘ Screening estimate from a state-policy table — verify with the county assessor before closing.
Climate risk First Street
- Flood 1/10 Low FEMA zone X (unshaded) · 0% chance over 30 yrs
- Wildfire 4/10 Moderate
- Heat 9/10 Extreme 7 d/yr ≥106°F today · 23 d/yr by 30 yrs out
- Wind 9/10 Extreme 99% chance of damaging wind over 30 yrs
- Air quality 2/10 Low 0 unhealthy d/yr today · 1 by 30 yrs out
Nearby sold comps map
Loading sold comps map…
Walkable amenities ~0.75 mi
Loading nearby amenities…
Taxation est. · year 1
- Rental income
- $17,537
- − Mortgage interest
- −$5,216
- − Property taxes
- −$1,660
- − Insurance
- −$466
- − Repairs & maintenance
- −$1,403
- − Management
- −$1,403
- − Depreciation
- −$2,709
- Taxable income
- $4,681
- Est. tax owed @ 24.0%
- −$1,123
- After-tax cash flow
- $4,745/yr
For passive investors: Depreciation is non-cash, so a rental often shows a tax loss while cash-flowing — sheltering income. Rental losses are passive: they offset passive income freely, and up to $25,000/yr can offset ordinary (W-2) income if you actively participate and your MAGI is under $100k (phasing out to $0 by $150k); unused losses carry forward. On sale, claimed depreciation is recaptured at up to 25%, and gains may owe capital-gains tax (a 1031 exchange can defer both). Figures are a year-1 estimate at your 24.0% rate — not tax advice; consult a CPA.
Schools (NCES district)
- District
- Citrus
- NCES district ID
- 1200270
- Math proficiency
- 49% ▼ -10.00%
- Reading proficiency
- 50% ▼ -6.00%
- Median HH income
- $38,618
- Composite
- 41.28/100
- National rank
- #3519
- State rank
- #44 of 73 in FL
Livability — Dunnellon
- Score
- 70/100
- State rank
- #443
- US rank
- #7922
Category grades
Schools grade is shown separately in the Schools card above.
Census & demographics
- County
- Citrus County · 111,314 people
- City population
- 20,859
- Metro
- Homosassa Springs, FL
- Population (ZIP)
- 11,074
- Household income
- $68,939
- Rent vs Own
- Severe rent burden
- 171.0
Population outlook (Citrus County) Hauer SSP2
- Today (2025)
- 138,622 people
- By 2030
- 136,886 · -1.3%
- By 2040
- 132,009 · -4.8%
- By 2050
- 125,196 · -9.7%
- By 2075
- 108,570 · -21.7%
- By 2100
- 84,454 · -39.1%
Race, ethnicity, and origin ACS 2023
- Neighborhood character
- Predominantly White (78%)
- Race & ethnicity
- White 78% Two or more races 11% Hispanic / Latino 9% Black 6%
- Hispanic origin (detail)
- Mexican 3% Puerto Rican 4%
- Common ancestry
- Iranian 3% Romanian 2% Slovak 2%
- Foreign-born
- 4% · Canada
- Languages at home
- 93% English-only · Spanish 5% German/W. Germanic 1% Other Indo-European 1%
Political lean MEDSL · Citrus
- 2024 margin
- Solid R (+45.9) · D 26.8% · R 72.6%
- 2008→2024 swing
- -29.8pp toward R · 2008: -16.1pp · 2024: -45.9pp
- All cycles
- 2024: R+45.9 2020: R+41.0 2016: R+39.7 2012: R+21.9 2008: R+16.1
Not yet ingested
- Civics
- —
Market trends
- HPI YoY
- ▼ -9.70%
- Current HPI
- 328.2164
- Rent YoY
- —
- Metro
- Homosassa Springs, FL
- State GDP YoY
- ▲ 3.28%
- F500 in state
- 36
Industry mix (Fortune 500 HQ in FL)
| Industry | F500 HQs | Revenue |
|---|---|---|
| Industrial Technology | 2 | $29B |
|
||
| Insurance | 2 | $17B |
|
||
| Retail | 1 | $60B |
|
||
| Technology Distribution | 1 | $58B |
|
||
| Homebuilding | 1 | $35B |
|
||
| Technology Manufacturing | 1 | $35B |
|
||
Price history
+365.6% since first listed9 events — show timeline
- 2026-04-23 Pending — Stellar MLS as Distributed by MLS Grid
- 2026-04-13 Relisted — Stellar MLS as Distributed by MLS Grid
- 2026-04-02 Pending — Stellar MLS as Distributed by MLS Grid
- 2026-03-16 Listed $93,112 Stellar MLS as Distributed by MLS Grid
- 2024-07-31 Pending — DGLMLS
- 2024-04-27 Listed $169,000 DGLMLS
- 2020-04-13 Sold (Public Records) $92,500 Public Records
- 2012-02-13 Listing Removed — Stellar MLS as Distributed by MLS Grid
- 2011-08-13 Listed $20,000 Stellar MLS as Distributed by MLS Grid
Property tax history
+14.0%/yrLatest (2025): $1,660 · +5.4% YoY. Source: county tax records.
Cash-flow waterfall
monthlySold comps — $/sqft
last 12 mo · ≤1 miLoading sold comps…