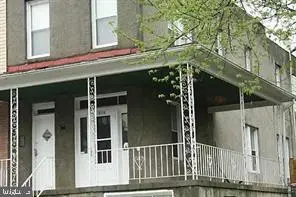
1808 Desoto Rd · Baltimore, MD
Flood risk 1/10 · Minimal
- FEMA flood zone
- X (unshaded)
- Chance of flooding over 30 yrs
- 0.0%
- Est. flood insurance / yr
- $473 – $860
Fire risk 1/10 · Minimal
- Est. fire insurance / yr
- $755 – $1,403
Heat risk 7/10 · Major
- Hot days now (above 103°F)
- 7 days/yr
- Hot days in 30 yrs
- 15 days/yr
Wind risk 6/10 · Moderate
- Chance of severe wind over 30 yrs
- 27.0%
Air-quality risk 3/10 · Minor
- Unhealthy air days now
- 3 days/yr
- Unhealthy air days in 30 yrs
- 4 days/yr
Risk factors via First Street. Map © Google.
Why this score? — see what drove the B grade
The composite is a weighted blend of 9 inputs, each scored 0–100. Each bar is that input's sub-score; the figure is the points it added to the 100-point composite (weight × sub-score).
- Cash flow +30.0/30.0
- ARV discount +15.0/15.0
- 1% rule +10.0/10.0
- DSCR +10.0/10.0
- Livability +3.8/5.0
- Condition / age +2.5/5.0
- Rent growth +2.2/5.0
- Schools +1.0/10.0
- Appreciation +0.0/10.0
$89,900
🖨 Deal sheet (PDF) 📄 Offer letter ✓ Due diligence
Listing remarks
Investor delight, bring your screw gun to gain entry into your next project. This amazing semi detached property awaits your style, design concept and critique for a chance to be someone dream home.
Key facts
- Built 1920
- Listed 13 days
Property features AI
Finance
- Other: Total below-grade area: 1,052; Above-grade finished area: 1,512; Income/expense note: Annual ground rent
- Financial info: Ground rent $120 paid semi-annually; Below average property condition
Exterior
- Parking: On-street parking
- Utilities: Public water; Public sewer
- Home design: Semi-detached property; Flat rubber roof; Ground rent ownership interest (ground rent exists)
- Construction: Brick, block, and stucco construction; Permanent foundation; Structure type: semi-detached
- Exterior features: Full basement; Below-grade area present (unfinished space)
Interior
- Bedrooms: Three bedrooms on the first upper level
- Flooring: Carpet; Laminate plank
- Bathrooms: Two full bathrooms (one on main level, one on first upper level)
- Heating & cooling: Radiator heating; Cooling: other/unspecified; 100 Amp electrical service (120/240V)
- Interior features: 9'+ ceilings; Drywall walls and ceilings
Neighborhood map
What this means for you Summary
Snapshot
- This is a 3-bed/2.0-bath townhouse listed at $90k.
Deal economics
- At list price, monthly cash flow is $902 ($11k/yr) — positive.
- The deal already cash-flows at list — no discount required.
- Meets the 1% rule at list price ($2k rent vs $90k).
- Cap rate 18.3% vs local median 6.0% in Baltimore — top-decile yield for the area; either an underpriced asset or a hidden risk that comps aren't pricing in. Stress-test before assuming the spread holds.
Location & tenants
- Location reads 76/100 on livability (#90 in MD, #3,396 nationally) — a middle-class / working-renter tenant base. Strengths: amenities A+, commute A+, housing A+; Watch: schools D, crime F.
- Baltimore City Public Schools (urban): math 7% / reading 16% proficiency, ranked #24 of 24 in MD (top 100%) — low school quality limits family demand, transient renter base, plan for 1-2y turnover; 79% free/reduced lunch — lower-income household profile, screen leases tightly.
- Market conditions: Rents soft (-1.0%/yr); 362 active listings in the ZIP; 21 comparable units currently listed for rent nearby; rentals lingering (median 44d on market — plan ~5-8 weeks vacancy on turnover, expect pricing pressure); 52% of comp listings sitting > 30 days — soft ceiling on asking rent; solid renter incomes; 1,273 units permitted in Baltimore city in 2024 (1,104 in 5+ unit buildings).
Forward outlook
- Local home prices are declining (-3.0%/yr); year-one equity from $622 of loan paydown is wiped out by about $3k of value loss. Plan a longer hold.
- Baltimore County population projected to shrink 4% by 2050 — rents likely to lag national; underwrite the cash flow, not the appreciation.
- At projected returns (-3.0% appreciation + 0.0% rent growth), your $25k cash investment doubles in ~3 years — after that, you're playing with house money.
Negotiation context
- Only 13 days on market — expect competitive offers; lowballing is unlikely to land.
- 3 sale attempts since 23y ago with the ask held roughly flat each time — persistent listings suggest the price (not the market) is what's stuck; bring a comps-based counter.
- Current owner paid $65k; 38% above their basis — modest negotiation headroom, anchor on the comps not their cost.
Risks & watch-outs
- Watch-outs: built in 1920 — expect roof / HVAC / electrical / plumbing capex.
- Climate carrying-cost: major wind risk, 27% chance of damaging wind over 30y; extreme-heat days projected 7→15/yr by 2055 (HVAC capex compounding) — expect insurance premiums to compound above CPI over the hold.
Questions for the listing agent
- Built in 1920 — when were the roof, HVAC, electrical panel, plumbing, and water heater last replaced?
- Is there a deadline driving the sale (1031 exchange, divorce, estate, relocation)? That informs how much negotiation room exists.
- Schools are D-rated, which usually means shorter tenancies and higher turnover. Who's the typical renter profile here, and what's been the actual vacancy rate?
- Crime grade is F in this area — have there been break-ins, vandalism, or insurance claims at this property in the last 3 years? What carrier currently insures it and at what premium?
- What's the average days-on-market for RENTAL listings here right now (not sales)? A rising rental-DOM trend means longer vacancies and softer asking-rent achievability than the comps imply.
- What's the recent tenant-quality profile in this submarket — average credit score on applications, eviction rate, late-payment / NSF rate, and stable-employment percentage? A property-management company in the area should have these aggregated.
- How much new for-sale + rental construction is in the pipeline within 1–3 miles? Heavy new supply typically softens prices + rents 12–24 months out; constrained supply supports both.
Investment metrics
- 1% rule
- 2.06% ✓
- Cap rate
- 18.34%
- Cash-on-cash
- 43.02%
- DSCR
- 2.91
- GRM
- 4.0
CMA / ARV
- ARV (on-the-fly)
- $160,272
- Comps found
- 12
Show comp detail 12 sales within ~0.75 mi
| Address | Dist | Beds/Ba | Sqft | Sold | Price | $/sf | Match |
|---|---|---|---|---|---|---|---|
| 2507 Washington Blvd | 0.21mi | 3/1.5 | 1,589 (+5%) | 6mo | $86,500 | $54 | 75 |
| 2030 Griffis Ave | 0.35mi | 3/2.5 | 1,538 (+2%) | 6mo | $155,000 | $101 | 74 |
| 2832 Washington Blvd | 0.20mi | 3/1.5 | 1,344 (-11%) | 1mo | $65,000 | $48 | 69 |
| 1954 Sponson St | 0.19mi | 4/3.0 (+1) | 1,474 (-2%) | 11mo | $350,000 | $237 | 69 |
| 2807 Washington Blvd | 0.12mi | 3/1.0 | 1,387 (-8%) | 13mo | $125,750 | $91 | 66 |
| 1930 Grinnalds Ave | 0.28mi | 3/2.0 | 1,650 (+9%) | 12mo | $150,000 | $91 | 62 |
| 1619 Parkman Ave | 0.37mi | 3/2.0 | 1,620 (+7%) | 12mo | $215,000 | $133 | 61 |
| 1025 Desoto Rd | 0.71mi | 2/2.0 (-1) | 1,520 (+0%) | 10mo | $180,000 | $118 | 53 |
| 1931 Grinnalds Ave | 0.30mi | 3/1.5 | 1,320 (-13%) | 12mo | $140,000 | $106 | 53 |
| 1913 Harman Ave | 0.25mi | 2/1.0 (-1) | 1,288 (-15%) | 4mo | $105,000 | $82 | 52 |
| 2400 Ridgely St | 0.65mi | 3/2.5 | 1,440 (-5%) | 10mo | $243,000 | $169 | 52 |
| 2105 Maisel St | 0.62mi | 3/1.0 | 1,456 (-4%) | 11mo | $180,000 | $124 | 52 |
Match score weights: distance 35% · size 25% · config 20% · recency 20%. Top-matched comps best support the ARV.
Projected returns pro-forma
-3.0% appreciation · 0.0% rent growth · sell at horizon
- IRR
- 36.5%
- Equity multiple
- 2.49×
- Total profit
- $37,478
- Equity at exit
- $13,404
- IRR
- 41.7%
- Equity multiple
- 4.40×
- Total profit
- $85,648
- Equity at exit
- $7,773
Cash invested: $25,172 (down + closing). Projections, not guarantees.
Landlord ↔ Tenant lean methodology
- Overall (CITY)
- 12 Strongly Tenant-Friendly
- State Maryland
- 27 Tenant-Leaning · D+14
- County
- — inherits STATE
- City Baltimore
- 12 Strongly Tenant-Friendly · D+58
ZIP-level market 21230
- Rents YoY
- -1.0%
- Active inventory
- 362
- Price-to-rent
- 4.0×
Monthly cashflow live
- Estimated rent
- $1,851 high interval (Pro) →
- Mortgage (P&I)
- −$471
- Tax from tax record
- −$51 /mo · $608/yr
- Insurance
- −$37
- HOA
- −$0
- Vacancy / Maint / Mgmt
- −$389
- Net cashflow
- $902
Break-even live
Sensitivity live
| Price | -10% $953 | -5% $928 | +0% $902 | +5% $877 | +10% $852 |
|---|---|---|---|---|---|
| Rent | -10% $756 | -5% $829 | +0% $902 | +5% $976 | +10% $1,049 |
| Rate | -1.0pp $948 | -0.5pp $925 | base $902 | +0.5pp $879 | +1.0pp $855 |
UW: 25.0% down · 7.5% · 30yr · 1.5% tax · 5.0% vac · 8.0% maint · 8.0% mgmt
Financing live
Cash to close
- Down payment
- $22,475
- Closing costs
- $2,697
- Reserves months
- —
- Total cash needed
- —
Loan-product check · same deal, 3 products live
Conventional
25% down · 7.5% · 30yr
- Down + closing
- —
- Monthly P&I
- —
- Monthly cashflow
- —
- DSCR
- —
- Eligible?
- —
Personal DTI + credit; lowest rate.
DSCR
20% down · 8.5% · 30yr
- Down + closing
- —
- Monthly P&I
- —
- Monthly cashflow
- —
- DSCR
- —
- Eligible?
- —
No personal income docs; deal must DSCR.
Hard money
10% down · 12.0% · 12mo
- Down + closing
- —
- Monthly P&I
- —
- Monthly cashflow
- —
- DSCR
- —
- Eligible?
- —
Short-term bridge; refi at stabilization.
Rent comps 21 comps
| Address | Beds | Baths | Sqft | Rent | $/sqft | DOM | Units | Dist |
|---|---|---|---|---|---|---|---|---|
| 1633 Sexton St Baltimore, MD | 4.0 | 3.0 | 1748 | $1,999 | $1.14 | 44d | 1 | 0.31mi |
| 2056 Griffis Ave Baltimore, MD | 3.0 | 1.5 | 1230 | $1,495 | $1.22 | 22d | 1 | 0.35mi |
| 941 Brunswick St Baltimore, MD | 3.0 | 1.5 | 1558 | $1,600 | $1.03 | 44d | 1 | 0.83mi |
| 941 Brunswick St Baltimore, MD | 3.0 | 1.5 | 1516 | $1,650 | $1.09 | 18d | 1 | 0.83mi |
| 3207 Bryant Ave Halethorpe, MD | 3.0 | 2.0 | 1808 | $2,350 | $1.30 | 44d | 1 | 0.89mi |
| 2737 Wilkens Ave Baltimore, MD | 3.0 | 1.5 | 1232 | $1,650 | $1.34 | 5d | 1 | 0.90mi |
| 2738 Wilkens Ave Baltimore, MD | 3.0 | 1.0 | 1183 | $1,500 | $1.27 | 44d | 1 | 0.93mi |
| 2671 Saint Benedict St Baltimore, MD | 2.0 | 1.0 | 1144 | $1,325 | $1.16 | 44d | 1 | 0.96mi |
| 2514 Wilkens Ave Baltimore, MD | 4.0 | 1.0 | 1344 | $1,800 | $1.34 | 44d | 1 | 1.01mi |
| 2514 Wilkens Ave Baltimore, MD | 4.0 | 1.0 | 1344 | $1,800 | $1.34 | 11d | 1 | 1.01mi |
| 2509 Christian St Baltimore, MD | 4.0 | 2.0 | 1248 | $1,699 | $1.36 | 4d | 1 | 1.02mi |
| 2657 Lehman St Unit 1 Baltimore, MD | 2.0 | 1.0 | 1056 | $1,000 | $0.95 | 44d | 1 | 1.06mi |
| 476 S Bentalou St Baltimore, MD | 2.0 | 1.5 | 1630 | $1,300 | $0.80 | 44d | 1 | 1.15mi |
| 514 S Payson St Unit 2 Baltimore, MD | 3.0 | 2.0 | 1264 | $1,750 | $1.38 | 44d | 1 | 1.17mi |
| 2540 Frederick Ave Baltimore, MD | 3.0 | 1.0 | 1075 | $1,400 | $1.30 | 24d | 1 | 1.24mi |
| 3130 Stafford St Baltimore, MD | 3.0 | 1.0 | 1200 | $1,500 | $1.25 | 20d | 1 | 1.26mi |
| 307 S Smallwood St Baltimore, MD | 2.0 | 2.5 | 1400 | $1,350 | $0.96 | 44d | 1 | 1.32mi |
| 110 S Catherine St Unit 1 Baltimore, MD | 2.0 | 1.0 | 1330 | $1,500 | $1.13 | 44d | 1 | 1.40mi |
| 3704 Coolidge Ave Baltimore, MD | 2.0 | 1.0 | 1262 | $2,000 | $1.58 | 20d | 1 | 1.41mi |
| 1303 James St Baltimore, MD | 2.0 | 1.5 | 1160 | $1,350 | $1.16 | 24d | 1 | 1.48mi |
| 2537 Hollins St Baltimore, MD | 3.0 | 2.0 | 1200 | $1,450 | $1.21 | 24d | 1 | 1.49mi |
Listing history 9 events
-
2026-06-18days on market $89,900 Active 13 DOM
-
2026-06-17days on market $89,900 Active 12 DOM
-
2026-06-16days on market $89,900 Active 11 DOM
-
2026-06-15days on market $89,900 Active 10 DOM
-
2026-06-13days on market $89,900 Active 8 DOM
-
2026-06-09days on market $89,900 Active 4 DOM
-
2026-06-08days on market $89,900 Active 3 DOM
-
2026-06-07remarks 198-char remark
-
2026-06-07$89,900 Active 2 DOM
ⓘ Source: listings_history table (triggers on properties + properties_extension) + one-shot
backfill from property_details.listing_events for pre-trigger history.
Tax reassessment forecast MD · Partial reset (capped growth)
- Current annual tax
- $608 · $51/mo
- Projected year-2 tax
- $794 · $66/mo
- Expected delta
- +$186/yr (+$15/mo · 30.5%)
ⓘ Screening estimate from a state-policy table — verify with the county assessor before closing.
Climate risk First Street
- Flood 1/10 Low FEMA zone X (unshaded) · 0% chance over 30 yrs
- Wildfire 1/10 Low
- Heat 7/10 Severe 7 d/yr ≥103°F today · 15 d/yr by 30 yrs out
- Wind 6/10 Major 27% chance of damaging wind over 30 yrs
- Air quality 3/10 Moderate 3 unhealthy d/yr today · 4 by 30 yrs out
Nearby sold comps map
Loading sold comps map…
Walkable amenities ~0.75 mi
Loading nearby amenities…
Taxation est. · year 1
- Rental income
- $22,209
- − Mortgage interest
- −$5,036
- − Property taxes
- −$608
- − Insurance
- −$450
- − Repairs & maintenance
- −$1,777
- − Management
- −$1,777
- − Depreciation
- −$2,615
- Taxable income
- $9,946
- Est. tax owed @ 24.0%
- −$2,387
- After-tax cash flow
- $8,443/yr
For passive investors: Depreciation is non-cash, so a rental often shows a tax loss while cash-flowing — sheltering income. Rental losses are passive: they offset passive income freely, and up to $25,000/yr can offset ordinary (W-2) income if you actively participate and your MAGI is under $100k (phasing out to $0 by $150k); unused losses carry forward. On sale, claimed depreciation is recaptured at up to 25%, and gains may owe capital-gains tax (a 1031 exchange can defer both). Figures are a year-1 estimate at your 24.0% rate — not tax advice; consult a CPA.
Schools (NCES district)
- District
- Baltimore City Public Schools
- NCES district ID
- 2400090
- Math proficiency
- 7% ▼ -9.00%
- Reading proficiency
- 16% ▼ -5.00%
- Median HH income
- $42,108
- Composite
- 10.08/100
- National rank
- #9805
- State rank
- #24 of 24 in MD
Livability — Baltimore
- Score
- 76/100
- State rank
- #90
- US rank
- #3396
Category grades
Schools grade is shown separately in the Schools card above.
Census & demographics
- Census place
- Baltimore, MD
- County
- Baltimore City · 558,601 people
- City population
- 588,727
- Metro
- Baltimore-Columbia-Towson, MD
- Population (ZIP)
- 32,977
- Household income
- $91,842
- Rent vs Own
- Severe rent burden
- 1463.0
Population outlook (Baltimore County) Hauer SSP2
- Today (2025)
- 624,249 people
- By 2030
- 621,541 · -0.4%
- By 2040
- 609,756 · -2.3%
- By 2050
- 597,249 · -4.3%
- By 2075
- 552,236 · -11.5%
- By 2100
- 513,934 · -17.7%
Race, ethnicity, and origin ACS 2023
- Neighborhood character
- Diverse neighborhood (Simpson 0.63)
- Race & ethnicity
- White 55% Black 23% Hispanic / Latino 13% Two or more races 6% Asian 4%
- Hispanic origin (detail)
- Mexican 1% Puerto Rican 1%
- Common ancestry
- Romanian 5% Lithuanian 2% Italian 2%
- Foreign-born
- 10% · Canada, China
- Languages at home
- 85% English-only · Spanish 9% Other Indo-European 1% Other Asian/Pacific 1%
Political lean MEDSL · Baltimore
- 2024 margin
- Solid D (+73.0) · D 85.2% · R 12.2% · Other 2.6%
- 2008→2024 swing
- -2.5pp toward R · 2008: 75.5pp · 2024: 73.0pp
- All cycles
- 2024: D+73.0 2020: D+76.6 2016: D+74.6 2012: D+76.4 2008: D+75.5
Not yet ingested
- Civics
- —
Market trends
- HPI YoY
- ▼ -311.43%
- Current HPI
- 284.338
- Rent YoY
- ▼ -1.00%
- Metro
- Baltimore-Columbia-Towson, MD
- State GDP YoY
- ▲ 2.97%
- F500 in state
- 12
Industry mix (Fortune 500 HQ in MD)
| Industry | F500 HQs | Revenue |
|---|---|---|
| Aerospace / Defense | 1 | $71B |
|
||
| Utilities | 1 | $25B |
|
||
| Hotels | 1 | $24B |
|
||
| Consumer Goods | 1 | $7B |
|
||
| Real Estate | 1 | $6B |
|
||
| Chemicals | 1 | $2B |
|
||
Price history
+133.5% since first listed7 events — show timeline
- 2026-06-05 Listed $89,900 BRIGHT MLS
- 2008-04-27 Delisted — MRIS
- 2008-04-18 Listed — MRIS
- 2004-08-12 Sold (Public Records) $65,000 Public Records
- 2004-06-03 Delisted — MRIS
- 2003-09-05 Listed — MRIS
- 1987-03-16 Sold (Public Records) $38,500 Public Records
Property tax history
-7.8%/yrLatest (2025): $608 · -73.2% YoY. Source: county tax records.
Cash-flow waterfall
monthlySold comps — $/sqft
last 12 mo · ≤1 miLoading sold comps…