1228 Meadowbrook Dr · Kokomo, IN
Flood risk 4/10 · Minor
- FEMA flood zone
- X (unshaded)
- Chance of flooding over 30 yrs
- 0.24%
- Est. flood insurance / yr
- $507 – $1,088
Fire risk 1/10 · Minimal
- Est. fire insurance / yr
- $717 – $1,331
Heat risk 3/10 · Minor
- Hot days now (above 102°F)
- 7 days/yr
- Hot days in 30 yrs
- 17 days/yr
Wind risk 2/10 · Minimal
- Chance of severe wind over 30 yrs
- —
Air-quality risk 3/10 · Minor
- Unhealthy air days now
- 2 days/yr
- Unhealthy air days in 30 yrs
- 3 days/yr
Risk factors via First Street. Map © Google.
Why this score? — see what drove the D+ grade
The composite is a weighted blend of 9 inputs, each scored 0–100. Each bar is that input's sub-score; the figure is the points it added to the 100-point composite (weight × sub-score).
- ARV discount +15.0/15.0
- Cash flow +14.7/30.0
- DSCR +4.5/10.0
- 1% rule +3.4/10.0
- Livability +3.4/5.0
- Rent growth +3.0/5.0
- Condition / age +2.5/5.0
- Schools +2.1/10.0
- Appreciation +0.0/10.0
$154,900
🖨 Deal sheet 📄 Offer letter ✓ Due diligence
Listing remarks
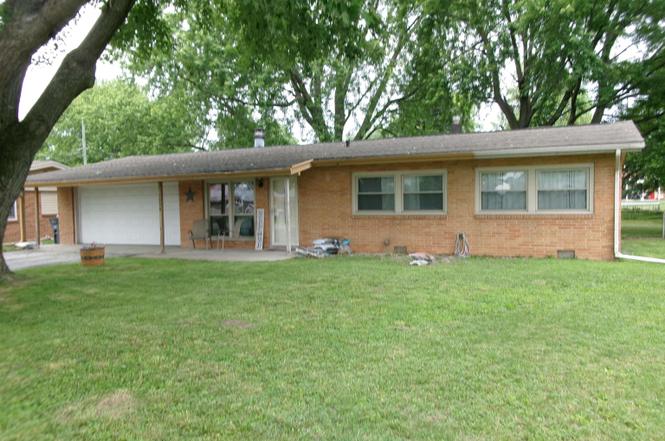
This all brick home with three bedrooms, and lots of of room for a great new family. Nice size back yard with mature trees and is fenced in . Living room with gas fireplace, nice size family room just off kitchen and dining area, separate office room area. This home is priced to sell. Paved drive and close to shopping and restaurants. Not on a major road.
Key facts
- Back yard
- Gas fireplace
- Brick home
Tags
Property features AI
Finance
- Other: Subdivision: Cedar Crest / Cedarcrest
Exterior
- Parking: Attached garage with garage door opener; 2-car garage
- Utilities: Public water; Public sewer
- Home design: Single-family residence; Site-built home; One-story
- Construction: Brick construction
- Exterior features: Irregular-shaped lot; Lot dimensions approximately 139 x 74; Lot area about 0.23 acres
Interior
- Kitchen: No kitchen appliance details provided
- Bedrooms: Master bedroom located downstairs
- Bathrooms: One full bathroom; One half bathroom; Two bathrooms on the main level
- Heating & cooling: Central air conditioning; Natural gas forced-air heating
- Interior features: Master suite on the main level; Living room fireplace
- Laundry & utility: Washer hookup on the main level; Electric dryer hookup on the main level
Neighborhood map
What this means for you Summary
Snapshot
- This is a 3-bed/1.5-bath single-family listed at $155k.
Deal economics
- At list price, monthly cash flow is $40 ($475/yr) — positive.
- The deal already cash-flows at list — no discount required.
- To meet the 1% rule (rent ≥ 1% of price), the offer needs to be $130k (16.0% below list).
- Recommended offer: $130k (16.0% below list) — sets the bar for 1% rule.
- Cap rate 6.6% vs local median 5.2% in Kokomo — meaningfully above typical; check what's discounted (condition, days-on-market, listing class) to confirm the premium yield is real.
Location & tenants
- Location reads 68/100 on livability (#227 in IN) — a middle-class / working-renter tenant base. Strengths: cost of living A+, housing A+, health & safety A; Watch: crime D, amenities F, commute F.
- Kokomo School Corporation (urban): math 22% / reading 30% proficiency, ranked #264 of 301 in IN (top 88%) — low school quality limits family demand, transient renter base, plan for 1-2y turnover; 62% free/reduced lunch — lower-income household profile, screen leases tightly.
- Zoned schools: Elwood Haynes Elementary School (math 22% / reading 17%, grade F, #814 of 994 statewide, top 83%, 611 students, 88% FRL); Maple Crest Middle School (math 10% / reading 16%, grade F, #304 of 330 statewide, top 94%, 372 students, 77% FRL); Kokomo High School (math 19% / reading 48%, grade F, #289 of 369 statewide, top 78%, 1,519 students, 58% FRL).
- Market conditions: Rents rising (+1.8%/yr); 232 active listings in the ZIP; 1 comparable units currently listed for rent nearby; 194 units permitted in Howard County in 2024 (0 in 5+ unit buildings).
Forward outlook
- Local home prices are declining (-3.0%/yr); year-one equity from $1k of loan paydown is wiped out by about $5k of value loss. Plan a longer hold.
- Howard County population projected at -11% by 2050 — secular population decline; favor cash flow + early exit over multi-decade hold.
Negotiation context
- It's been on market 129 days — a 12% lower offer ($136k) is reasonable based on typical stale-listing flexibility.
- 5 sale attempts since 12y ago; this cycle's ask has dropped $15k (9%) from the opening price — seller is motivated, your offer sets the floor, not the list.
- Current owner paid $115k; 35% above their basis — modest negotiation headroom, anchor on the comps not their cost.
Risks & watch-outs
- Watch-outs: built in 1957 — expect roof / HVAC / electrical / plumbing capex.
Questions for the listing agent
- It's been on market 129 days. Have you received any prior offers? Is the seller open to a 16% concession, seller financing, or rate buy-down credit?
- Built in 1957 — when were the roof, HVAC, electrical panel, plumbing, and water heater last replaced?
- Why hasn't it sold? Are there any deal-killer items the seller is aware of (foundation, flood, title, zoning, code violations)?
- Is there a deadline driving the sale (1031 exchange, divorce, estate, relocation)? That informs how much negotiation room exists.
- Schools are F-rated, which usually means shorter tenancies and higher turnover. Who's the typical renter profile here, and what's been the actual vacancy rate?
- Crime grade is D in this area — have there been break-ins, vandalism, or insurance claims at this property in the last 3 years? What carrier currently insures it and at what premium?
- The area grade is low — what's the realistic commute time and amenity access for the typical tenant pool here? Any planned neighborhood developments (good or bad) we should know about?
- What's the average days-on-market for RENTAL listings here right now (not sales)? A rising rental-DOM trend means longer vacancies and softer asking-rent achievability than the comps imply.
- What's the recent tenant-quality profile in this submarket — average credit score on applications, eviction rate, late-payment / NSF rate, and stable-employment percentage? A property-management company in the area should have these aggregated.
- How much new for-sale + rental construction is in the pipeline within 1–3 miles? Heavy new supply typically softens prices + rents 12–24 months out; constrained supply supports both.
Investment metrics
- 1% rule
- 0.84% ✗
- Cap rate
- 6.60%
- Cash-on-cash
- 1.09%
- DSCR
- 1.05
- GRM
- 9.9
CMA / ARV
- ARV (on-the-fly)
- $186,480
- Comps found
- 12
Show comp detail 12 sales within ~0.75 mi
| Address | Dist | Beds/Ba | Sqft | Sold | Price | $/sf | Match |
|---|---|---|---|---|---|---|---|
| 1900 Olds Ct | 0.06mi | 3/2.5 | 1,576 (+6%) | 5mo | $182,500 | $116 | 78 |
| 1501 E Cadillac Dr | 0.32mi | 3/2.0 | 1,525 (+3%) | 6mo | $190,000 | $125 | 73 |
| 1516 Belvedere Dr | 0.26mi | 3/1.0 | 1,384 (-6%) | 4mo | $175,000 | $126 | 72 |
| 1400 Belvedere Dr | 0.15mi | 3/2.0 | 1,313 (-11%) | 5mo | $213,000 | $162 | 68 |
| 1801 Pontiac Dr | 0.43mi | 3/2.0 | 1,409 (-5%) | 5mo | $175,000 | $124 | 66 |
| 2131 Olds Dr | 0.23mi | 3/2.0 | 1,656 (+12%) | 2mo | $200,000 | $121 | 66 |
| 1505 S Goyer Rd | 0.39mi | 3/2.0 | 1,356 (-8%) | 0mo | $165,000 | $122 | 65 |
| 1721 E Dodge St | 0.36mi | 3/2.0 | 1,300 (-12%) | 2mo | $179,900 | $138 | 60 |
| 1830 S Goyer Rd | 0.60mi | 3/2.0 | 1,547 (+4%) | 6mo | $190,000 | $123 | 58 |
| 1921 Saratoga Ave | 0.31mi | 3/2.0 | 1,278 (-14%) | 4mo | $180,000 | $141 | 57 |
| 1237 S Cooper St | 0.38mi | 3/2.0 | 1,300 (-12%) | 5mo | $179,900 | $138 | 56 |
| 2489 Fiona Dr | 0.58mi | 3/2.0 | 1,667 (+13%) | 2mo | $334,000 | $200 | 48 |
Match score weights: distance 35% · size 25% · config 20% · recency 20%. Top-matched comps best support the ARV.
Projected returns pro-forma
-3.0% appreciation · 1.8% rent growth · sell at horizon
- IRR
- -15.8%
- Equity multiple
- 0.44×
- Total profit
- $-24,166
- Equity at exit
- $23,096
- IRR
- -9.5%
- Equity multiple
- 0.44×
- Total profit
- $-24,145
- Equity at exit
- $13,393
Cash invested: $43,372 (down + closing). Projections, not guarantees.
Landlord ↔ Tenant lean methodology
- Overall (STATE)
- 90 Strongly Landlord-Friendly
- State Indiana
- 90 Strongly Landlord-Friendly · R+11
- County
- — inherits STATE
- City
- — inherits STATE
ZIP-level market 46902
- Home prices YoY
- -20.7%
- Rents YoY
- 1.8%
- Active inventory
- 232
- Price-to-rent
- 9.9×
Monthly cashflow live
- Estimated rent
- $1,302 medium interval (Pro) →
- Mortgage (P&I)
- −$812
- Tax from tax record
- −$112 /mo · $1,345/yr
- Insurance
- −$65
- HOA
- −$0
- Vacancy / Maint / Mgmt
- −$273
- Net cashflow
- $40
Break-even live
UW: 25.0% down · 7.5% · 30yr · 1.5% tax · 5.0% vac · 8.0% maint · 8.0% mgmt
Financing live
Cash to close
- Down payment
- $38,725
- Closing costs
- $4,647
- Reserves months
- —
- Total cash needed
- —
Loan-product check · same deal, 3 products live
Conventional
25% down · 7.5% · 30yr
- Down + closing
- —
- Monthly P&I
- —
- Monthly cashflow
- —
- DSCR
- —
- Eligible?
- —
Personal DTI + credit; lowest rate.
DSCR
20% down · 8.5% · 30yr
- Down + closing
- —
- Monthly P&I
- —
- Monthly cashflow
- —
- DSCR
- —
- Eligible?
- —
No personal income docs; deal must DSCR.
Hard money
10% down · 12.0% · 12mo
- Down + closing
- —
- Monthly P&I
- —
- Monthly cashflow
- —
- DSCR
- —
- Eligible?
- —
Short-term bridge; refi at stabilization.
Rent comps 1 comps
| Address | Beds | Baths | Sqft | Rent | $/sqft | DOM | Units | Dist |
|---|---|---|---|---|---|---|---|---|
| 1901 S Goyer Rd Kokomo, IN | 1.0–2.0 | 1.0–1.5 | 875 | $1,049 | $1.20 | 43d | 4 | 0.60mi |
Listing history 22 events
-
2026-06-19days on market $154,900 Active 129 DOM
-
2026-06-18days on market $154,900 Active 128 DOM
-
2026-06-17days on market $154,900 Active 127 DOM
-
2026-06-16days on market $154,900 Active 126 DOM
-
2026-06-15days on market $154,900 Active 125 DOM
-
2026-06-14days on market $154,900 Active 123 DOM
-
2026-06-13days on market $154,900 Active 122 DOM
-
2026-06-08days on market $154,900 Active 121 DOM
-
2026-06-07days on market $154,900 Active 120 DOM
-
2026-06-02days on market $154,900 Active 115 DOM
-
2026-06-01remarks 358-char remark
-
2026-06-01days on market $154,900 Active 114 DOM
-
2026-05-31days on market $154,900 Active 113 DOM
-
2026-05-30days on market $154,900 Active 112 DOM
-
2026-05-18price $154,900
-
2026-02-07$169,900 Active
-
2020-11-19soldstatus $115,000
-
2020-07-27$122,500
-
2017-12-20soldstatus $89,900
-
2017-09-11$89,900
-
2016-04-04$89,900
-
2014-09-12$89,900
ⓘ Source: listings_history table (triggers on properties + properties_extension) + one-shot
backfill from property_details.listing_events for pre-trigger history.
Tax reassessment forecast IN · Partial reset (capped growth)
- Current annual tax
- $1,345 · $112/mo
- Projected year-2 tax
- $1,345 · $112/mo
- Expected delta
- $0/yr ($0/mo · 0.0%)
ⓘ Screening estimate from a state-policy table — verify with the county assessor before closing.
Climate risk First Street
- Flood 4/10 Moderate FEMA zone X (unshaded) · 24% chance over 30 yrs
- Wildfire 1/10 Low
- Heat 3/10 Moderate 7 d/yr ≥102°F today · 17 d/yr by 30 yrs out
- Wind 2/10 Low
- Air quality 3/10 Moderate 2 unhealthy d/yr today · 3 by 30 yrs out
Nearby sold comps map
Loading sold comps map…
Walkable amenities ~0.75 mi
Loading nearby amenities…
Taxation est. · year 1
- Rental income
- $15,623
- − Mortgage interest
- −$8,677
- − Property taxes
- −$1,345
- − Insurance
- −$774
- − Repairs & maintenance
- −$1,250
- − Management
- −$1,250
- − Depreciation
- −$4,506
- Taxable loss
- −$2,180
- Est. tax savings @ 24.0%
- +$523
- After-tax cash flow
- $998/yr
For passive investors: Depreciation is non-cash, so a rental often shows a tax loss while cash-flowing — sheltering income. Rental losses are passive: they offset passive income freely, and up to $25,000/yr can offset ordinary (W-2) income if you actively participate and your MAGI is under $100k (phasing out to $0 by $150k); unused losses carry forward. On sale, claimed depreciation is recaptured at up to 25%, and gains may owe capital-gains tax (a 1031 exchange can defer both). Figures are a year-1 estimate at your 24.0% rate — not tax advice; consult a CPA.
Schools (NCES district)
- District
- Kokomo School Corporation
- NCES district ID
- 1805370
- Math proficiency
- 22% ▼ -8.00%
- Reading proficiency
- 30% ▼ -5.00%
- Median HH income
- $35,804
- Composite
- 21.5/100
- National rank
- #8325
- State rank
- #264 of 301 in IN
Livability — Kokomo
- Score
- 68/100
- State rank
- #227
- US rank
- #9912
Category grades
Schools grade is shown separately in the Schools card above.
Census & demographics
- Census place
- Kokomo, IN
- County
- Howard County · 75,099 people
- City population
- 75,099
- Metro
- Kokomo, IN
- Population (ZIP)
- 37,017
- Household income
- $62,126
- Rent vs Own
- Severe rent burden
- 1262.0
Population outlook (Howard County) Hauer SSP2
- Today (2025)
- 81,522 people
- By 2030
- 80,104 · -1.7%
- By 2040
- 76,708 · -5.9%
- By 2050
- 72,880 · -10.6%
- By 2075
- 64,016 · -21.5%
- By 2100
- 51,705 · -36.6%
Race, ethnicity, and origin ACS 2023
- Neighborhood character
- Predominantly White (81%)
- Race & ethnicity
- White 81% Black 9% Two or more races 5% Hispanic / Latino 4% Asian 3%
- Common ancestry
- Italian 2% Lithuanian 1% Slovak 1%
- Foreign-born
- 3% · Canada, Vietnam, China
- Languages at home
- 96% English-only · Vietnamese 1% Other Asian/Pacific 1% Spanish 1%
Political lean MEDSL · Howard
- 2024 margin
- Solid R (+35.3) · D 31.4% · R 66.7% · Other 1.8%
- 2008→2024 swing
- -29.1pp toward R · 2008: -6.2pp · 2024: -35.3pp
- All cycles
- 2024: R+35.3 2020: R+32.4 2016: R+33.9 2012: R+14.3 2008: R+6.2
Not yet ingested
- Civics
- —
Market trends
- HPI YoY
- ▼ -61.76%
- Current HPI
- 236.8237
- Rent YoY
- ▲ 1.80%
- Metro
- Kokomo, IN
- State GDP YoY
- ▲ 2.90%
- F500 in state
- 18
Industry mix (Fortune 500 HQ in IN)
| Industry | F500 HQs | Revenue |
|---|---|---|
| Industrial Machinery | 2 | $37B |
|
||
| Healthcare | 1 | $177B |
|
||
| Pharmaceuticals | 1 | $45B |
|
||
| Metals / Steel | 1 | $18B |
|
||
| Agriculture | 1 | $17B |
|
||
| Packaging | 1 | $12B |
|
||
Price history
+72.3% since first listed8 events — show timeline
- 2026-05-18 Price Changed $154,900 IRMLS
- 2026-02-07 Listed $169,900 IRMLS
- 2020-11-19 Sold (MLS) $115,000 IRMLS
- 2020-07-27 Listed $122,500 IRMLS
- 2017-12-20 Sold (MLS) $89,900 IRMLS
- 2017-09-11 Listed $89,900 IRMLS
- 2016-04-04 Listed $89,900 IRMLS
- 2014-09-12 Listed $89,900 IRMLS
Property tax history
+11.9%/yrLatest (2024): $1,345 · +11.4% YoY. Source: county tax records.
Cash-flow waterfall
monthlySold comps — $/sqft
last 12 mo · ≤1 miLoading sold comps…