 🌊 Lakefront
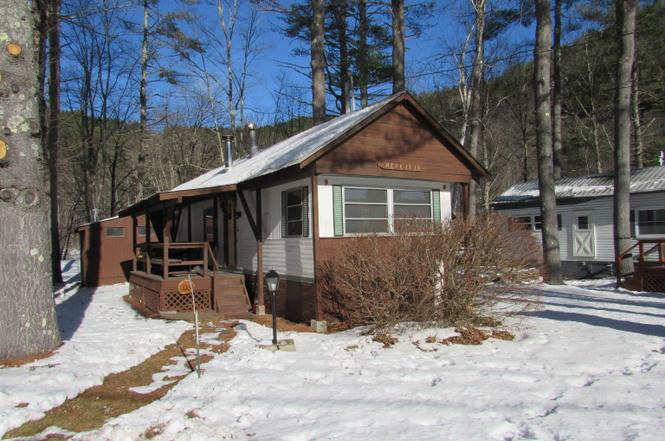
2036 VT RT 30 · Jamaica, VT
Flood risk 8/10 · Major
- FEMA flood zone
- X (shaded)
- Chance of flooding over 30 yrs
- 0.99%
- Est. flood insurance / yr
- $507 – $1,088
Fire risk 1/10 · Minimal
- Est. fire insurance / yr
- $480 – $892
Heat risk 2/10 · Minimal
- Hot days now (above 90°F)
- 8 days/yr
- Hot days in 30 yrs
- 18 days/yr
Wind risk 3/10 · Minor
- Chance of severe wind over 30 yrs
- 7.0%
Air-quality risk 2/10 · Minimal
- Unhealthy air days now
- 0 days/yr
- Unhealthy air days in 30 yrs
- 1 days/yr
Risk factors via First Street. Map © Google.
Why this score? — see what drove the B+ grade
The composite is a weighted blend of 9 inputs, each scored 0–100. Each bar is that input's sub-score; the figure is the points it added to the 100-point composite (weight × sub-score).
- Cash flow +30.0/30.0
- ARV discount +15.0/15.0
- 1% rule +10.0/10.0
- DSCR +10.0/10.0
- Schools +5.0/10.0
- Rent growth +2.5/5.0
- Livability +2.5/5.0
- Condition / age +2.5/5.0
- Appreciation +0.0/10.0
$57,000
🖨 Deal sheet (PDF) 📄 Offer letter ✓ Due diligence
Listing remarks
A cozy base for days spent enjoying Vermont country life warmed by a cozy wood stove and enjoying countless meals prepared together in the upgraded cherry and tile kitchen. Property has direct access to the West River. a nice deck to sit on in the back and a nice sitting platform overlooking river. Two bedroom one bath mobile home. Six months occupancy per year. New tenants must be approved by the park.
Key facts
- Deck
- Built 1975
- Listed 185 days
Tags
Property features AI
Finance
- HOA & community: Mobile park approved (French Bridge Chateau LLC DBA West River Mobile Ho)
Exterior
- Parking: Dirt driveway
- Utilities: Private water; Private sewer; Circuit breaker electrical service; High-speed internet available; Cable available; Telephone service available
- Home design: Single wide mobile home; Entry on main level
- Construction: Built in 1975; Aluminum siding; Metal and shingle roof
- Exterior features: Country setting; Deed restricted; Located in a leased/mobile park; Level lot; Major road frontage; River and stream frontage; Dirt driveway; Private and publicly accessible road frontage; privately maintained
Interior
- Bathrooms: One full bathroom
- Heating & cooling: Electric heat
- Interior features: Six total rooms; Seasonal occupancy
Neighborhood map
What this means for you Summary
Snapshot
- This is a 2-bed/1.5-bath manufactured listed at $57k.
Deal economics
- At list price, monthly cash flow is $399 ($5k/yr) — positive.
- The deal already cash-flows at list — no discount required.
- Meets the 1% rule at list price ($1k rent vs $57k).
- Recommended offer: $50k (12.0% below list) — sets the bar for market timing.
Location & tenants
- Location reads: area grade B — affects rentability + tenant quality, not the cash-flow math above.
- Zoned schools: Leland & Gray Union Middle & High School (math 22% / reading 42%, grade F, #29 of 48 statewide, top 68%, 257 students, 16% FRL).
- Market conditions: 39 active listings in the ZIP; 188 units permitted in Windham County in 2024 (0 in 5+ unit buildings).
Forward outlook
- Local home prices are declining (-3.0%/yr); year-one equity from $394 of loan paydown is wiped out by about $2k of value loss. Plan a longer hold.
- Windham County population projected at -26% by 2050 — secular population decline; favor cash flow + early exit over multi-decade hold.
- At projected returns (-3.0% appreciation + 3.0% rent growth), your $16k cash investment doubles in ~4 years — after that, you're playing with house money.
Negotiation context
- It's been on market 185 days — a 12% lower offer ($50k) is reasonable based on typical stale-listing flexibility.
Risks & watch-outs
- Watch-outs: flood insurance adds $66/mo.
- Climate carrying-cost: severe flood risk — expect insurance premiums to compound above CPI over the hold.
Questions for the listing agent
- It's been on market 185 days. Have you received any prior offers? Is the seller open to a 12% concession, seller financing, or rate buy-down credit?
- Built in 1975 — when were the roof, HVAC, electrical panel, plumbing, and water heater last replaced?
- What's the actual annual flood-insurance premium (NFIP or private), and is the property in a SFHA with mandatory coverage?
- Why hasn't it sold? Are there any deal-killer items the seller is aware of (foundation, flood, title, zoning, code violations)?
- Is there a deadline driving the sale (1031 exchange, divorce, estate, relocation)? That informs how much negotiation room exists.
- This sits on a lake — are riparian / water-frontage rights deeded with the parcel? Any dock permits, shoreline easements, or HOA water-use restrictions?
- What's the documented flood / surge / shoreline-erosion history here (FEMA AND non-FEMA — e.g., storm surge, creek backup, septic-field saturation)?
- Any water-quality or seasonal algae-bloom issues that affect tenant satisfaction or short-term-rental demand?
- What's the average days-on-market for RENTAL listings here right now (not sales)? A rising rental-DOM trend means longer vacancies and softer asking-rent achievability than the comps imply.
- What's the recent tenant-quality profile in this submarket — average credit score on applications, eviction rate, late-payment / NSF rate, and stable-employment percentage? A property-management company in the area should have these aggregated.
- How much new for-sale + rental construction is in the pipeline within 1–3 miles? Heavy new supply typically softens prices + rents 12–24 months out; constrained supply supports both.
Investment metrics
- 1% rule
- 1.81% ✓
- Cap rate
- 16.10%
- Cash-on-cash
- 35.02%
- DSCR
- 2.56
- GRM
- 4.6
CMA / ARV
- ARV (on-the-fly)
- $69,984
- Comps found
- 1
Show comp detail 1 sale within ~0.75 mi
| Address | Dist | Beds/Ba | Sqft | Sold | Price | $/sf | Match |
|---|---|---|---|---|---|---|---|
| 2000 Route 30 | 0.03mi | 2/1.0 | 624 (-13%) | 9mo | $45,000 | $72 | 67 |
Match score weights: distance 35% · size 25% · config 20% · recency 20%. Top-matched comps best support the ARV.
Projected returns pro-forma
-3.0% appreciation · 3.0% rent growth · sell at horizon
- IRR
- 24.6%
- Equity multiple
- 2.02×
- Total profit
- $16,220
- Equity at exit
- $8,499
- IRR
- 32.4%
- Equity multiple
- 3.94×
- Total profit
- $46,983
- Equity at exit
- $4,928
Cash invested: $15,960 (down + closing). Projections, not guarantees.
Landlord ↔ Tenant lean methodology
- Overall (STATE)
- 41 Moderately Tenant-Leaning
- State Vermont
- 41 Moderately Tenant-Leaning · D+15
- County
- — inherits STATE
- City
- — inherits STATE
ZIP-level market 05343
- Active inventory
- 39
- Price-to-rent
- 4.6×
Monthly cashflow live
- Estimated rent
- $1,031 medium interval (Pro) →
- Mortgage (P&I)
- −$299
- Tax from tax record
- −$26 /mo · $310/yr
- Insurance
- −$24
- Flood insurance flood zone
- −$66 /mo · $798/yr
- HOA
- −$0
- Vacancy / Maint / Mgmt
- −$216
- Net cashflow
- $399
Break-even live
Sensitivity live
| Price | -10% $432 | -5% $415 | +0% $399 | +5% $383 | +10% $367 |
|---|---|---|---|---|---|
| Rent | -10% $318 | -5% $359 | +0% $399 | +5% $440 | +10% $481 |
| Rate | -1.0pp $428 | -0.5pp $414 | base $399 | +0.5pp $384 | +1.0pp $369 |
UW: 25.0% down · 7.5% · 30yr · 1.5% tax · 5.0% vac · 8.0% maint · 8.0% mgmt
Financing live
Cash to close
- Down payment
- $14,250
- Closing costs
- $1,710
- Reserves months
- —
- Total cash needed
- —
Loan-product check · same deal, 3 products live
Conventional
25% down · 7.5% · 30yr
- Down + closing
- —
- Monthly P&I
- —
- Monthly cashflow
- —
- DSCR
- —
- Eligible?
- —
Personal DTI + credit; lowest rate.
DSCR
20% down · 8.5% · 30yr
- Down + closing
- —
- Monthly P&I
- —
- Monthly cashflow
- —
- DSCR
- —
- Eligible?
- —
No personal income docs; deal must DSCR.
Hard money
10% down · 12.0% · 12mo
- Down + closing
- —
- Monthly P&I
- —
- Monthly cashflow
- —
- DSCR
- —
- Eligible?
- —
Short-term bridge; refi at stabilization.
Listing history 19 events
-
2026-06-21days on market $57,000 Active 185 DOM
-
2026-06-18days on market $57,000 Active 182 DOM
-
2026-06-17days on market $57,000 Active 181 DOM
-
2026-06-16days on market $57,000 Active 180 DOM
-
2026-06-15days on market $57,000 Active 179 DOM
-
2026-06-14days on market $57,000 Active 177 DOM
-
2026-06-13days on market $57,000 Active 176 DOM
-
2026-06-10days on market $57,000 Active 174 DOM
-
2026-06-09days on market $57,000 Active 173 DOM
-
2026-06-08days on market $57,000 Active 172 DOM
-
2026-06-07days on market $57,000 Active 171 DOM
-
2026-06-05days on market $57,000 Active 168 DOM
-
2026-06-03days on market $57,000 Active 167 DOM
-
2026-06-02days on market $57,000 Active 166 DOM
-
2026-06-01days on market $57,000 Active 165 DOM
-
2026-05-31days on market $57,000 Active 164 DOM
-
2026-05-31days on market $57,000 Active 163 DOM
-
2026-01-07price $57,000
-
2025-12-17$63,000 Active
ⓘ Source: listings_history table (triggers on properties + properties_extension) + one-shot
backfill from property_details.listing_events for pre-trigger history.
Tax reassessment forecast VT · Partial reset (capped growth)
- Current annual tax
- $310 · $26/mo
- Projected year-2 tax
- $696 · $58/mo
- Expected delta
- +$387/yr (+$32/mo · 124.9%)
ⓘ Screening estimate from a state-policy table — verify with the county assessor before closing.
Climate risk First Street
- Flood 8/10 Severe FEMA zone X (shaded) · 99% chance over 30 yrs
- Wildfire 1/10 Low
- Heat 2/10 Low 8 d/yr ≥90°F today · 18 d/yr by 30 yrs out
- Wind 3/10 Moderate 7% chance of damaging wind over 30 yrs
- Air quality 2/10 Low 0 unhealthy d/yr today · 1 by 30 yrs out
Nearby sold comps map
Loading sold comps map…
Walkable amenities ~0.75 mi
Loading nearby amenities…
Taxation est. · year 1
- Rental income
- $12,367
- − Mortgage interest
- −$3,193
- − Property taxes
- −$310
- − Insurance
- −$1,082
- − Repairs & maintenance
- −$989
- − Management
- −$989
- − Depreciation
- −$1,658
- Taxable income
- $4,145
- Est. tax owed @ 24.0%
- −$995
- After-tax cash flow
- $3,796/yr
For passive investors: Depreciation is non-cash, so a rental often shows a tax loss while cash-flowing — sheltering income. Rental losses are passive: they offset passive income freely, and up to $25,000/yr can offset ordinary (W-2) income if you actively participate and your MAGI is under $100k (phasing out to $0 by $150k); unused losses carry forward. On sale, claimed depreciation is recaptured at up to 25%, and gains may owe capital-gains tax (a 1031 exchange can defer both). Figures are a year-1 estimate at your 24.0% rate — not tax advice; consult a CPA.
Schools (NCES district)
No district data.
Livability — Jamaica
No livability data for this city. (Only ~50 U.S. cities are tracked.)
Census & demographics
- Population (ZIP)
- 1,003
Population outlook (Windham County) Hauer SSP2
- Today (2025)
- 40,432 people
- By 2030
- 38,472 · -4.8%
- By 2040
- 33,954 · -16.0%
- By 2050
- 29,774 · -26.4%
- By 2075
- 22,351 · -44.7%
- By 2100
- 15,961 · -60.5%
Race, ethnicity, and origin ACS 2023
- Neighborhood character
- Predominantly White (99%)
- Race & ethnicity
- White 99%
- Common ancestry
- Romanian 11% Lithuanian 9% Slovak 6%
- Foreign-born
- 1% · Canada
Political lean MEDSL · Windham
- 2024 margin
- Solid D (+42.7) · D 69.6% · R 26.9% · Other 3.5%
- 2008→2024 swing
- -5.4pp toward R · 2008: 48.1pp · 2024: 42.7pp
- All cycles
- 2024: D+42.7 2020: D+47.3 2016: D+42.0 2012: D+49.2 2008: D+48.1
Not yet ingested
- Civics
- —
Market trends
- HPI YoY
- ▼ -114.93%
- Current HPI
- 170.5724
- Rent YoY
- —
- Metro
- —
- State GDP YoY
- —
- F500 in state
- 0
Price history
-9.5% since first listed2 events — show timeline
- 2026-01-07 Price Changed $57,000 PrimeMLS
- 2025-12-17 Listed $63,000 PrimeMLS
Property tax history
+2.2%/yrLatest (2024): $310 · +11.5% YoY. Source: county tax records.
Cash-flow waterfall
monthlySold comps — $/sqft
last 12 mo · ≤1 miLoading sold comps…