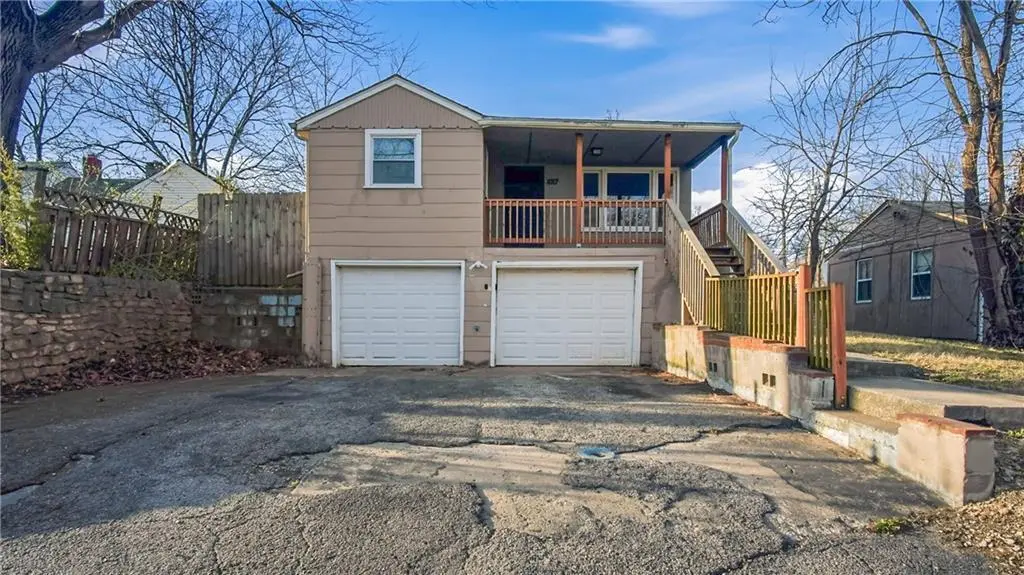
1017 E Smith Ave · Independence, MO
Flood risk 1/10 · Minimal
- FEMA flood zone
- X (unshaded)
- Chance of flooding over 30 yrs
- 0.0%
- Est. flood insurance / yr
- $473 – $860
Fire risk 1/10 · Minimal
- Est. fire insurance / yr
- $1,054 – $1,958
Heat risk 4/10 · Minor
- Hot days now (above 106°F)
- 7 days/yr
- Hot days in 30 yrs
- 17 days/yr
Wind risk 2/10 · Minimal
- Chance of severe wind over 30 yrs
- —
Air-quality risk 3/10 · Minor
- Unhealthy air days now
- 3 days/yr
- Unhealthy air days in 30 yrs
- 3 days/yr
Risk factors via First Street. Map © Google.
Why this score? — see what drove the C grade
The composite is a weighted blend of 9 inputs, each scored 0–100. Each bar is that input's sub-score; the figure is the points it added to the 100-point composite (weight × sub-score).
- Cash flow +19.4/30.0
- ARV discount +14.5/15.0
- DSCR +6.1/10.0
- 1% rule +4.5/10.0
- Livability +4.1/5.0
- Rent growth +3.4/5.0
- Schools +2.7/10.0
- Condition / age +2.5/5.0
- Appreciation +0.0/10.0
$143,900
🖨 Deal sheet 📄 Offer letter ✓ Due diligence
Listing remarks MLS
Spacious home featuring 4 bedrooms, 2 bathrooms, and a garage with a functional layout and plenty of room to spread out. The main living areas offer comfortable space for both everyday living and entertaining, while the kitchen provides ample cabinet and counter space. The primary bedroom includes an en-suite bathroom, and additional bedrooms offer flexibility for guests, office, or hobbies. Enjoy the backyard with space to relax or entertain. Great opportunity with plenty of potential!
Key facts
- 7,011 sq ft lot
- 2 garage spots
- Built 1950
Neighborhood map
What this means for you Summary
Snapshot
- This is a 3-bed/1.0-bath single-family listed at $144k.
Deal economics
- At list price, monthly cash flow is $161 ($2k/yr) — positive.
- The deal already cash-flows at list — no discount required.
- To meet the 1% rule (rent ≥ 1% of price), the offer needs to be $136k (5.2% below list).
- Recommended offer: $135k (6.0% below list) — sets the bar for market timing.
- Cap rate 7.6% vs local median 5.0% in Independence — top-decile yield for the area; either an underpriced asset or a hidden risk that comps aren't pricing in. Stress-test before assuming the spread holds.
Location & tenants
- Location reads 82/100 on livability (#10 in MO, #1,296 nationally) — a professional / high-income tenant draw. Strengths: amenities A+, commute A+, cost of living A+; Watch: schools C-, employment D+, crime F.
- Independence 30 (suburban): math 26% / reading 38% proficiency, ranked #252 of 324 in MO (top 78%) — families likely to look elsewhere, expect single-tenant / working-renter base with shorter leases.
- Market conditions: Rents rising (+3.8%/yr); 125 active listings in the ZIP; 13 comparable units currently listed for rent nearby; rentals at typical pace (median 24d on market — plan ~3-4 weeks tenant-placement turnaround); 46% of comp listings sitting > 30 days — soft ceiling on asking rent; 4,002 units permitted in Jackson County in 2024 (2,271 in 5+ unit buildings).
- This rent runs 34% of the median local income ($49k/yr) — at the standard rent-burdened threshold; future hikes will face affordability resistance.
Forward outlook
- Local home prices are declining (-3.0%/yr); year-one equity from $995 of loan paydown is wiped out by about $4k of value loss. Plan a longer hold.
- Jackson County population projected at +4% by 2050 — modest demand growth; plan on rents tracking national, not racing it.
Negotiation context
- It's been on market 85 days — a 6% lower offer ($135k) is reasonable based on typical stale-listing flexibility.
- 3 sale attempts since 5y ago; this cycle's ask has dropped $70k (33%) from the opening price — seller is motivated, your offer sets the floor, not the list.
Risks & watch-outs
- Watch-outs: built in 1950 — expect roof / HVAC / electrical / plumbing capex.
Questions for the listing agent
- It's been on market 85 days. Have you received any prior offers? Is the seller open to a 6% concession, seller financing, or rate buy-down credit?
- Built in 1950 — when were the roof, HVAC, electrical panel, plumbing, and water heater last replaced?
- Why hasn't it sold? Are there any deal-killer items the seller is aware of (foundation, flood, title, zoning, code violations)?
- Is there a deadline driving the sale (1031 exchange, divorce, estate, relocation)? That informs how much negotiation room exists.
- Crime grade is F in this area — have there been break-ins, vandalism, or insurance claims at this property in the last 3 years? What carrier currently insures it and at what premium?
- What's the average days-on-market for RENTAL listings here right now (not sales)? A rising rental-DOM trend means longer vacancies and softer asking-rent achievability than the comps imply.
- What's the recent tenant-quality profile in this submarket — average credit score on applications, eviction rate, late-payment / NSF rate, and stable-employment percentage? A property-management company in the area should have these aggregated.
- How much new for-sale + rental construction is in the pipeline within 1–3 miles? Heavy new supply typically softens prices + rents 12–24 months out; constrained supply supports both.
Investment metrics
- 1% rule
- 0.95% ✗
- Cap rate
- 7.64%
- Cash-on-cash
- 4.80%
- DSCR
- 1.21
- GRM
- 8.8
CMA / ARV
- ARV (median comp)
- $170,479
- List price
- $143,900
- Delta
- -15.59%
- Verdict
- UNDERPRICED
- Comps
- 20 within 1.0 mi
Show comp detail 12 sales within ~0.75 mi
| Address | Dist | Beds/Ba | Sqft | Sold | Price | $/sf | Match |
|---|---|---|---|---|---|---|---|
| 1034 E Lexington Ave | 0.05mi | 3/2.0 | 1,306 (+0%) | 10mo | $175,000 | $134 | 85 |
| 103 N Wilson Ave | 0.05mi | 3/1.5 | 1,132 (-13%) | 0mo | $120,000 | $106 | 73 |
| 620 E Walnut St | 0.33mi | 3/1.0 | 1,266 (-3%) | 10mo | $175,000 | $138 | 72 |
| 217 S Hunter St | 0.17mi | 3/1.0 | 1,120 (-14%) | 0mo | $170,000 | $152 | 68 |
| 606 N Rogers St | 0.32mi | 2/1.0 (-1) | 1,194 (-8%) | 2mo | $150,000 | $126 | 64 |
| 1702 E T C Lea Rd | 0.56mi | 2/1.5 (-1) | 1,297 (-0%) | 7mo | $158,000 | $122 | 61 |
| 912 E Frederick St | 0.53mi | 3/2.0 | 1,218 (-6%) | 1mo | $145,000 | $119 | 59 |
| 613 E Lexington Ave | 0.30mi | 2/2.0 (-1) | 1,433 (+10%) | 4mo | $175,000 | $122 | 58 |
| 814 S Saville Ave | 0.68mi | 4/1.0 (+1) | 1,357 (+4%) | 6mo | $165,000 | $122 | 51 |
| 822 S Raymond St | 0.68mi | 3/1.0 | 1,190 (-9%) | 6mo | $158,000 | $133 | 48 |
| 809 S Mills St | 0.64mi | 3/1.5 | 1,200 (-8%) | 11mo | $205,000 | $171 | 46 |
| 625 N Lakeview Ave | 0.50mi | 4/2.0 (+1) | 1,440 (+10%) | 8mo | $165,000 | $115 | 44 |
Match score weights: distance 35% · size 25% · config 20% · recency 20%. Top-matched comps best support the ARV.
Projected returns pro-forma
-3.0% appreciation · 3.79% rent growth · sell at horizon
- IRR
- -8.0%
- Equity multiple
- 0.70×
- Total profit
- $-11,991
- Equity at exit
- $21,456
- IRR
- 2.4%
- Equity multiple
- 1.18×
- Total profit
- $7,216
- Equity at exit
- $12,442
Cash invested: $40,292 (down + closing). Projections, not guarantees.
Landlord ↔ Tenant lean methodology
- Overall (STATE)
- 81 Strongly Landlord-Friendly
- State Missouri
- 81 Strongly Landlord-Friendly · R+10
- County
- — inherits STATE
- City
- — inherits STATE
ZIP-level market 64050
- Home prices YoY
- -15.5%
- Rents YoY
- 3.8%
- Active inventory
- 125
- Price-to-rent
- 8.8×
Monthly cashflow live
- Estimated rent
- $1,364 high interval (Pro) →
- Mortgage (P&I)
- −$755
- Tax from tax record
- −$102 /mo · $1,221/yr
- Insurance
- −$60
- HOA
- −$0
- Vacancy / Maint / Mgmt
- −$286
- Net cashflow
- $161
Break-even live
UW: 25.0% down · 7.5% · 30yr · 1.5% tax · 5.0% vac · 8.0% maint · 8.0% mgmt
Financing live
Cash to close
- Down payment
- $35,975
- Closing costs
- $4,317
- Reserves months
- —
- Total cash needed
- —
Loan-product check · same deal, 3 products live
Conventional
25% down · 7.5% · 30yr
- Down + closing
- —
- Monthly P&I
- —
- Monthly cashflow
- —
- DSCR
- —
- Eligible?
- —
Personal DTI + credit; lowest rate.
DSCR
20% down · 8.5% · 30yr
- Down + closing
- —
- Monthly P&I
- —
- Monthly cashflow
- —
- DSCR
- —
- Eligible?
- —
No personal income docs; deal must DSCR.
Hard money
10% down · 12.0% · 12mo
- Down + closing
- —
- Monthly P&I
- —
- Monthly cashflow
- —
- DSCR
- —
- Eligible?
- —
Short-term bridge; refi at stabilization.
Rent comps 13 comps
| Address | Beds | Baths | Sqft | Rent | $/sqft | DOM | Units | Dist |
|---|---|---|---|---|---|---|---|---|
| 315 S Crane St Unit A Independence, MO | 3.0 | 1.0 | 1150 | $1,250 | $1.09 | 23d | 1 | 0.23mi |
| 315 S Crane St Unit A Independence, MO | 3.0 | 1.0 | 1150 | $1,250 | $1.09 | 43d | 1 | 0.23mi |
| 1021 N Kiger Rd Independence, MO | 3.0 | 2.0 | 1200 | $1,500 | $1.25 | 17d | 1 | 0.68mi |
| 414 Hillside Dr Independence, MO | 2.0 | 1.0–2.0 | 627 | $1,199 | $1.91 | 43d | 3 | 0.83mi |
| 1118 S Pope Ave Independence, MO | 2.0 | 1.0 | 988 | $1,195 | $1.21 | 16d | 1 | 0.89mi |
| 523 W Maple Ave Unit 2 A Independence, MO | 3.0 | 2.0 | 964 | $995 | $1.03 | 43d | 1 | 1.15mi |
| 321 W South Ave Unit 11 Independence, MO | 3.0 | 2.0 | 1000 | $1,275 | $1.27 | 21d | 1 | 1.24mi |
| 321 W South Ave Unit 8 Independence, MO | 2.0 | 1.5 | 980 | $1,895 | $1.93 | 1d | 1 | 1.24mi |
| 321 W South Ave Unit 9 Independence, MO | 2.0 | 1.5 | 980 | $1,295 | $1.32 | 43d | 1 | 1.24mi |
| 1808 N Kiger Rd Independence, MO | 3.0 | 1.5 | 1800 | $1,550 | $0.86 | 43d | 1 | 1.28mi |
| 1612 N Dodgion Ave Independence, MO | 3.0 | 1.0 | 1000 | $1,345 | $1.34 | 43d | 1 | 1.34mi |
| 1207 N McCoy St Independence, MO | 3.0 | 2.0 | 972 | $1,295 | $1.33 | 7d | 1 | 1.41mi |
| 718 E Gudgell Ave Independence, MO | 4.0 | 2.0 | 1624 | $1,775 | $1.09 | 16d | 1 | 1.42mi |
Listing history 27 events
-
2026-06-18days on market $143,900 Active 85 DOM
-
2026-06-17days on market $143,900 Active 84 DOM
-
2026-06-16days on market $143,900 Active 83 DOM
-
2026-06-15days on market $143,900 Active 82 DOM
-
2026-06-13pricedays on market $143,900 Active 80 DOM
-
2026-06-09days on market $149,999 Active 76 DOM
-
2026-06-08days on market $149,999 Active 75 DOM
-
2026-06-07days on market $149,999 Active 74 DOM
-
2026-06-05days on market $149,999 Active 71 DOM
-
2026-06-03days on market $149,999 Active 70 DOM
-
2026-06-02days on market $149,999 Active 69 DOM
-
2026-06-01days on market $149,999 Active 68 DOM
-
2026-05-31days on market $149,999 Active 67 DOM
-
2026-05-09price $174,900 491-char remark
Show marketing remark (491 chars)
Spacious home featuring 4 bedrooms, 2 bathrooms, and a garage with a functional layout and plenty of room to spread out. The main living areas offer comfortable space for both everyday living and entertaining, while the kitchen provides ample cabinet and counter space. The primary bedroom includes an en-suite bathroom, and additional bedrooms offer flexibility for guests, office, or hobbies. Enjoy the backyard with space to relax or entertain. Great opportunity with plenty of potential!
-
2026-04-28price $199,950 491-char remark
Show marketing remark (491 chars)
Spacious home featuring 4 bedrooms, 2 bathrooms, and a garage with a functional layout and plenty of room to spread out. The main living areas offer comfortable space for both everyday living and entertaining, while the kitchen provides ample cabinet and counter space. The primary bedroom includes an en-suite bathroom, and additional bedrooms offer flexibility for guests, office, or hobbies. Enjoy the backyard with space to relax or entertain. Great opportunity with plenty of potential!
-
2026-03-25$213,900 Active 491-char remark
Show marketing remark (491 chars)
Spacious home featuring 4 bedrooms, 2 bathrooms, and a garage with a functional layout and plenty of room to spread out. The main living areas offer comfortable space for both everyday living and entertaining, while the kitchen provides ample cabinet and counter space. The primary bedroom includes an en-suite bathroom, and additional bedrooms offer flexibility for guests, office, or hobbies. Enjoy the backyard with space to relax or entertain. Great opportunity with plenty of potential!
-
2026-01-21historical
-
2026-01-08price $159,900
-
2025-12-05$165,000 Active
-
2021-10-11soldstatus
-
2021-10-08soldstatus Closed
-
2021-09-30status Pending
-
2021-09-16historical Active Under Contract
-
2021-09-15$130,000 Active
-
2018-03-09soldstatus
-
2017-10-18soldstatus
-
1955-05-01soldstatus
ⓘ Source: listings_history table (triggers on properties + properties_extension) + one-shot
backfill from property_details.listing_events for pre-trigger history.
Tax reassessment forecast MO · Resets to sale price
- Current annual tax
- $1,221 · $102/mo
- Projected year-2 tax
- $1,396 · $116/mo
- Expected delta
- +$175/yr (+$15/mo · 14.3%)
ⓘ Screening estimate from a state-policy table — verify with the county assessor before closing.
Climate risk First Street
- Flood 1/10 Low FEMA zone X (unshaded) · 0% chance over 30 yrs
- Wildfire 1/10 Low
- Heat 4/10 Moderate 7 d/yr ≥106°F today · 17 d/yr by 30 yrs out
- Wind 2/10 Low
- Air quality 3/10 Moderate 3 unhealthy d/yr today · 3 by 30 yrs out
Nearby sold comps map
Loading sold comps map…
Walkable amenities ~0.75 mi
Loading nearby amenities…
Taxation est. · year 1
- Rental income
- $16,367
- − Mortgage interest
- −$8,061
- − Property taxes
- −$1,221
- − Insurance
- −$720
- − Repairs & maintenance
- −$1,309
- − Management
- −$1,309
- − Depreciation
- −$4,186
- Taxable loss
- −$440
- Est. tax savings @ 24.0%
- +$105
- After-tax cash flow
- $2,039/yr
For passive investors: Depreciation is non-cash, so a rental often shows a tax loss while cash-flowing — sheltering income. Rental losses are passive: they offset passive income freely, and up to $25,000/yr can offset ordinary (W-2) income if you actively participate and your MAGI is under $100k (phasing out to $0 by $150k); unused losses carry forward. On sale, claimed depreciation is recaptured at up to 25%, and gains may owe capital-gains tax (a 1031 exchange can defer both). Figures are a year-1 estimate at your 24.0% rate — not tax advice; consult a CPA.
Schools (NCES district)
- District
- Independence 30
- NCES district ID
- 2915480
- Math proficiency
- 26% ▼ -8.00%
- Reading proficiency
- 38% ▼ -5.00%
- Median HH income
- $41,843
- Composite
- 27.04/100
- National rank
- #7054
- State rank
- #252 of 324 in MO
Livability — Independence
- Score
- 82/100
- State rank
- #10
- US rank
- #1296
Category grades
Schools grade is shown separately in the Schools card above.
Census & demographics
- Census place
- Independence, MO
- County
- Jackson County · 687,798 people
- City population
- 117,675
- Metro
- Kansas City, MO-KS
- Population (ZIP)
- 21,079
- Household income
- $48,834
- Rent vs Own
- Severe rent burden
- 972.0
Population outlook (Jackson County) Hauer SSP2
- Today (2025)
- 719,589 people
- By 2030
- 731,456 · +1.6%
- By 2040
- 746,689 · +3.8%
- By 2050
- 749,289 · +4.1%
- By 2075
- 736,227 · +2.3%
- By 2100
- 668,210 · -7.1%
Race, ethnicity, and origin ACS 2023
- Neighborhood character
- Predominantly White (72%)
- Race & ethnicity
- White 72% Hispanic / Latino 11% Two or more races 9% Black 7% Pacific Islander 1%
- Hispanic origin (detail)
- Mexican 8%
- Common ancestry
- Italian 4% Serbian 2% Lithuanian 1%
- Foreign-born
- 5% · Canada
- Languages at home
- 91% English-only · Spanish 7% Other Asian/Pacific 1%
Political lean MEDSL · Jackson
- 2024 margin
- D (+19.3) · D 58.9% · R 39.5% · Other 1.6%
- 2008→2024 swing
- -6.1pp toward R · 2008: 25.4pp · 2024: 19.3pp
- All cycles
- 2024: D+19.3 2020: D+22.0 2016: D+16.6 2012: D+19.0 2008: D+25.4
Not yet ingested
- Civics
- —
Market trends
- HPI YoY
- ▼ -56.24%
- Current HPI
- 305.796
- Rent YoY
- ▲ 3.79%
- Metro
- Kansas City, MO-KS
- State GDP YoY
- ▲ 1.84%
- F500 in state
- 20
Industry mix (Fortune 500 HQ in MO)
| Industry | F500 HQs | Revenue |
|---|---|---|
| Healthcare | 1 | $163B |
|
||
| Insurance | 1 | $21B |
|
||
| Industrial Technology | 1 | $17B |
|
||
| Retail | 1 | $16B |
|
||
| Industrial Distribution | 1 | $10B |
|
||
| Utilities | 1 | $9B |
|
||
Price history
+34.5% since first listed14 events — show timeline
- 2026-05-09 Price Changed $174,900 Heartland MLS as Distributed by MLS Grid
- 2026-04-28 Price Changed $199,950 Heartland MLS as Distributed by MLS Grid
- 2026-03-25 Listed $213,900 Heartland MLS as Distributed by MLS Grid
- 2026-01-21 Listing Removed — Heartland MLS as Distributed by MLS Grid
- 2026-01-08 Price Changed $159,900 Heartland MLS as Distributed by MLS Grid
- 2025-12-05 Listed $165,000 Heartland MLS as Distributed by MLS Grid
- 2021-10-11 Sold (Public Records) — Public Records
- 2021-10-08 Sold (MLS) — Heartland MLS as Distributed by MLS Grid
- 2021-09-30 Pending — Heartland MLS as Distributed by MLS Grid
- 2021-09-16 Contingent — Heartland MLS as Distributed by MLS Grid
- 2021-09-15 Listed $130,000 Heartland MLS as Distributed by MLS Grid
- 2018-03-09 Sold (Public Records) — Public Records
- 2017-10-18 Sold (Public Records) — Public Records
- 1955-05-01 Sold (Public Records) — Public Records
Property tax history
+3.5%/yrLatest (2025): $1,221 · -40.5% YoY. Source: county tax records.
Cash-flow waterfall
monthlySold comps — $/sqft
last 12 mo · ≤1 miLoading sold comps…