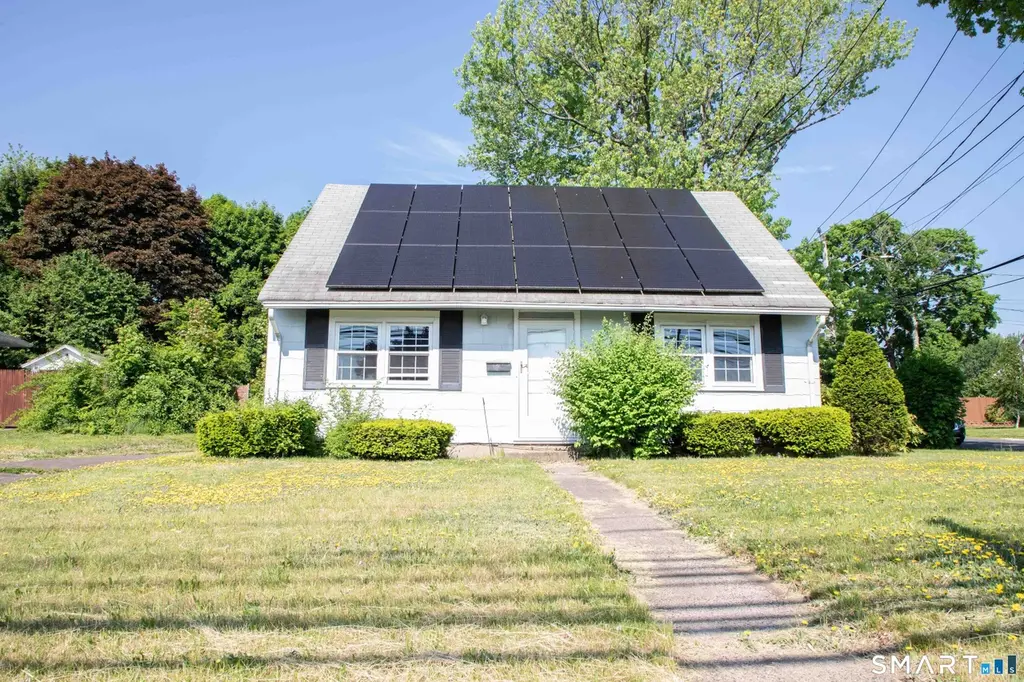
678 Farmington Ave · New Britain, CT
Flood risk No data
- FEMA flood zone
- —
- Chance of flooding over 30 yrs
- —
- Est. flood insurance / yr
- —
Fire risk No data
- Est. fire insurance / yr
- —
Heat risk No data
- Hot days now (above threshold)
- —
- Hot days in 30 yrs
- —
Wind risk No data
- Chance of severe wind over 30 yrs
- —
Air-quality risk No data
- Unhealthy air days now
- —
- Unhealthy air days in 30 yrs
- —
Risk factors via First Street. Map © Google.
Why this score? — see what drove the C grade
The composite is a weighted blend of 9 inputs, each scored 0–100. Each bar is that input's sub-score; the figure is the points it added to the 100-point composite (weight × sub-score).
- Cash flow +16.6/30.0
- Appreciation +10.0/10.0
- ARV discount +7.5/15.0
- 1% rule +5.5/10.0
- DSCR +5.2/10.0
- Rent growth +3.7/5.0
- Livability +3.7/5.0
- Condition / age +2.5/5.0
- Schools +1.0/10.0
$149,900
🖨 Deal sheet (PDF) 📄 Offer letter ✓ Due diligence
Listing remarks MLS
Great opportunity for investor or handyman, this property has expansion capabilities with an unfinished second level. Located near banks and shopping and minutes from downtown or I-84. Eat in kitchen, first floor bath and 2 bedrooms. All rooms have tile floors. Located on a corner .17 acre lot, there is driveway access from either Farmington Ave or the corner side street.
Key facts
- Solar panels
- Walk-up attic
- 7,405 sq ft lot
Tags
Property features AI
Exterior
- Utilities: Public water connected; Public sewer connected; Domestic hot water
- Home design: Single-family home for sale
- Construction: Frame construction; Slab foundation
- Exterior features: Corner lot; level with some sloping; Asphalt shingle roof; Asbestos siding
Interior
- Bedrooms: 2 bedrooms
- Bathrooms: 1 full bathroom
- Heating & cooling: Heat pump heating and cooling; Electric heat fuel
- Interior features: Walk-up attic; No basement; Total of 4 rooms
Neighborhood map
What this means for you Summary
Snapshot
- This is a 2-bed/1.0-bath single-family listed at $150k.
Deal economics
- At list price, monthly cash flow is $91 ($1k/yr) — positive.
- The deal already cash-flows at list — no discount required.
- Meets the 1% rule at list price ($2k rent vs $150k).
- Cap rate 7.0% vs local median 4.2% in New Britain — top-decile yield for the area; either an underpriced asset or a hidden risk that comps aren't pricing in. Stress-test before assuming the spread holds.
Location & tenants
- Location reads 74/100 on livability (#67 in CT, #4,936 nationally) — a middle-class / working-renter tenant base. Strengths: health & safety A+, cost of living A, housing A; Watch: crime D, employment D.
- New Britain School District (suburban): math 6% / reading 17% proficiency, ranked #153 of 153 in CT (top 100%) — low school quality limits family demand, transient renter base, plan for 1-2y turnover; 71% free/reduced lunch — lower-income household profile, screen leases tightly.
- Zoned schools: Jefferson Elementary School (math 8% / reading 17%, grade F, #490 of 553 statewide, top 90%, 390 students, 75% FRL); Pulaski Middle School (math 0% / reading 13%, grade F, #171 of 175 statewide, top 98%, 867 students, 80% FRL); New Britain High School (math 10% / reading 31%, grade F, #162 of 194 statewide, top 83%, 2,331 students, 71% FRL) — zoned schools at 75% FRL track the district average.
- Market conditions: Rents rising fast (+4.9%/yr); 71 active listings in the ZIP; 17 comparable units currently listed for rent nearby; rentals at typical pace (median 22d on market — plan ~3-4 weeks tenant-placement turnaround); 1,867 units permitted in Capitol Planning Region in 2024 (1,399 in 5+ unit buildings).
- This rent runs 30% of the median local income ($63k/yr) — at the standard rent-burdened threshold; future hikes will face affordability resistance.
Forward outlook
- In year one you build about $16k of equity ($1k loan paydown + $15k appreciation (10.0% local appreciation)).
- At projected returns (10.0% appreciation + 4.9% rent growth), your $42k cash investment doubles in ~3 years — after that, you're playing with house money.
- By year 3, paydown + projected appreciation supports a ~$41k cash-out refi (75% LTV) — recoverable capital for the next deal without selling this one.
Negotiation context
- Only 9 days on market — expect competitive offers; lowballing is unlikely to land.
- 4 sale attempts since 9y ago with the ask held roughly flat each time — persistent listings suggest the price (not the market) is what's stuck; bring a comps-based counter.
- Current owner paid $60k; list at $150k implies a 150% gain — meaningful room to come down on a strong offer.
Risks & watch-outs
- Watch-outs: built in 1951 — expect roof / HVAC / electrical / plumbing capex.
Questions for the listing agent
- Built in 1951 — when were the roof, HVAC, electrical panel, plumbing, and water heater last replaced?
- Is there a deadline driving the sale (1031 exchange, divorce, estate, relocation)? That informs how much negotiation room exists.
- Schools are F-rated, which usually means shorter tenancies and higher turnover. Who's the typical renter profile here, and what's been the actual vacancy rate?
- Crime grade is D in this area — have there been break-ins, vandalism, or insurance claims at this property in the last 3 years? What carrier currently insures it and at what premium?
- What's the average days-on-market for RENTAL listings here right now (not sales)? A rising rental-DOM trend means longer vacancies and softer asking-rent achievability than the comps imply.
- What's the recent tenant-quality profile in this submarket — average credit score on applications, eviction rate, late-payment / NSF rate, and stable-employment percentage? A property-management company in the area should have these aggregated.
- How much new for-sale + rental construction is in the pipeline within 1–3 miles? Heavy new supply typically softens prices + rents 12–24 months out; constrained supply supports both.
Investment metrics
- 1% rule
- 1.05% ✓
- Cap rate
- 7.02%
- Cash-on-cash
- 2.60%
- DSCR
- 1.12
- GRM
- 7.9
CMA / ARV
No comps found within radius.
Projected returns pro-forma
10.0% appreciation · 4.94% rent growth · sell at horizon
- IRR
- 27.0%
- Equity multiple
- 3.16×
- Total profit
- $90,670
- Equity at exit
- $135,042
- IRR
- 24.2%
- Equity multiple
- 7.42×
- Total profit
- $269,516
- Equity at exit
- $291,223
Cash invested: $41,972 (down + closing). Projections, not guarantees.
Landlord ↔ Tenant lean methodology
- Overall (STATE)
- 27 Tenant-Leaning
- State Connecticut
- 27 Tenant-Leaning · D+7
- County
- — inherits STATE
- City
- — inherits STATE
ZIP-level market 06053
- Home prices YoY
- 15.4%
- Rents YoY
- 4.9%
- Active inventory
- 71
- Price-to-rent
- 7.9×
Monthly cashflow live
- Estimated rent
- $1,575 high interval (Pro) →
- Mortgage (P&I)
- −$786
- Tax from tax record
- −$304 /mo · $3,653/yr
- Insurance
- −$62
- HOA
- −$0
- Vacancy / Maint / Mgmt
- −$331
- Net cashflow
- $91
Break-even live
Sensitivity live
| Price | -10% $176 | -5% $134 | +0% $91 | +5% $49 | +10% $6 |
|---|---|---|---|---|---|
| Rent | -10% $-33 | -5% $29 | +0% $91 | +5% $153 | +10% $215 |
| Rate | -1.0pp $167 | -0.5pp $129 | base $91 | +0.5pp $52 | +1.0pp $13 |
UW: 25.0% down · 7.5% · 30yr · 1.5% tax · 5.0% vac · 8.0% maint · 8.0% mgmt
Financing live
Cash to close
- Down payment
- $37,475
- Closing costs
- $4,497
- Reserves months
- —
- Total cash needed
- —
Loan-product check · same deal, 3 products live
Conventional
25% down · 7.5% · 30yr
- Down + closing
- —
- Monthly P&I
- —
- Monthly cashflow
- —
- DSCR
- —
- Eligible?
- —
Personal DTI + credit; lowest rate.
DSCR
20% down · 8.5% · 30yr
- Down + closing
- —
- Monthly P&I
- —
- Monthly cashflow
- —
- DSCR
- —
- Eligible?
- —
No personal income docs; deal must DSCR.
Hard money
10% down · 12.0% · 12mo
- Down + closing
- —
- Monthly P&I
- —
- Monthly cashflow
- —
- DSCR
- —
- Eligible?
- —
Short-term bridge; refi at stabilization.
Rent comps 17 comps
| Address | Beds | Baths | Sqft | Rent | $/sqft | DOM | Units | Dist |
|---|---|---|---|---|---|---|---|---|
| 418 Farmington Ave New Britain, CT | 1.0 | 1.0 | 662 | $1,275 | $1.92 | 45d | 1 | 0.46mi |
| 2100 Stanley St #411 New Britain, CT | 1.0 | 1.0 | 700 | $1,495 | $2.14 | 17d | 1 | 0.92mi |
| 126 Biruta St Unit B16 New Britain, CT | 1.0 | 1.0 | 624 | $1,400 | $2.24 | 23d | 1 | 0.98mi |
| 579 Burritt St Unit 3S New Britain, CT | 2.0 | 1.0 | 704 | $1,600 | $2.27 | 45d | 1 | 1.08mi |
| 192 Allen St New Britain, CT | 1.0–3.0 | 1.0 | 713 | $1,670 | $2.34 | 3d | 15 | 1.09mi |
| 98 Carlton St Unit 201 New Britain, CT | 1.0 | 1.0 | 700 | $1,350 | $1.93 | 5d | 1 | 1.09mi |
| 45 Elam St New Britain, CT | 1.0 | 1.0 | 720 | $1,295 | $1.80 | 21d | 1 | 1.11mi |
| 385 High St Unit 4 New Britain, CT | 1.0 | 1.0 | 500 | $1,100 | $2.20 | 5d | 1 | 1.23mi |
| 385 High St Apt 6 New Britain, CT | 1.0 | 1.0 | 500 | $1,100 | $2.20 | 21d | 1 | 1.23mi |
| 80 Batterson Park Rd Farmington, CT | 2.0 | 1.0–2.0 | 900 | $4,793 | $5.32 | 3d | 98 | 1.34mi |
| 15 Farm Springs Rd Farmington, CT | 2.0 | 2.0 | 864 | $3,599 | $4.16 | 3d | 18 | 1.36mi |
| 313 High St Unit 1N New Britain, CT | 1.0 | 1.0 | 700 | $1,250 | $1.79 | 25d | 1 | 1.36mi |
| 290 Washington St Apt 4 New Britain, CT | 1.0 | 1.0 | 700 | $1,590 | $2.27 | 5d | 1 | 1.43mi |
| 46 Brittany Farms Rd New Britain, CT | 1.0–2.0 | 1.0 | 820 | $2,025 | $2.47 | 3d | 1 | 1.44mi |
| 152 Oak St Unit 1S New Britain, CT | 2.0 | 1.0 | 745 | $1,600 | $2.15 | 23d | 1 | 1.44mi |
| 22 Wilcox St Unit 3N New Britain, CT | 2.0 | 1.0 | 725 | $1,700 | $2.34 | 45d | 1 | 1.45mi |
| 59 Daly Ave Apt 1W New Britain, CT | 2.0 | 1.0 | 658 | $1,600 | $2.43 | 23d | 1 | 1.46mi |
Listing history 8 events
-
2026-05-20historical
-
2026-05-20status Active
-
2026-05-20$149,900 Active
-
2026-01-20status Under Contract
-
2026-01-09$164,900 Active
-
2017-09-26soldstatus $60,000 374-char remark
Show marketing remark (374 chars)
Great opportunity for investor or handyman, this property has expansion capabilities with an unfinished second level. Located near banks and shopping and minutes from downtown or I-84. Eat in kitchen, first floor bath and 2 bedrooms. All rooms have tile floors. Located on a corner .17 acre lot, there is driveway access from either Farmington Ave or the corner side street.
-
2017-08-30historical 374-char remark
Show marketing remark (374 chars)
Great opportunity for investor or handyman, this property has expansion capabilities with an unfinished second level. Located near banks and shopping and minutes from downtown or I-84. Eat in kitchen, first floor bath and 2 bedrooms. All rooms have tile floors. Located on a corner .17 acre lot, there is driveway access from either Farmington Ave or the corner side street.
-
2017-05-15$64,900 374-char remark
Show marketing remark (374 chars)
Great opportunity for investor or handyman, this property has expansion capabilities with an unfinished second level. Located near banks and shopping and minutes from downtown or I-84. Eat in kitchen, first floor bath and 2 bedrooms. All rooms have tile floors. Located on a corner .17 acre lot, there is driveway access from either Farmington Ave or the corner side street.
ⓘ Source: listings_history table (triggers on properties + properties_extension) + one-shot
backfill from property_details.listing_events for pre-trigger history.
Tax reassessment forecast CT · Partial reset (capped growth)
- Current annual tax
- $3,653 · $304/mo
- Projected year-2 tax
- $3,653 · $304/mo
- Expected delta
- $0/yr ($0/mo · 0.0%)
ⓘ Screening estimate from a state-policy table — verify with the county assessor before closing.
Nearby sold comps map
Loading sold comps map…
Walkable amenities ~0.75 mi
Loading nearby amenities…
Taxation est. · year 1
- Rental income
- $18,897
- − Mortgage interest
- −$8,397
- − Property taxes
- −$3,653
- − Insurance
- −$750
- − Repairs & maintenance
- −$1,512
- − Management
- −$1,512
- − Depreciation
- −$4,361
- Taxable loss
- −$1,286
- Est. tax savings @ 24.0%
- +$309
- After-tax cash flow
- $1,402/yr
For passive investors: Depreciation is non-cash, so a rental often shows a tax loss while cash-flowing — sheltering income. Rental losses are passive: they offset passive income freely, and up to $25,000/yr can offset ordinary (W-2) income if you actively participate and your MAGI is under $100k (phasing out to $0 by $150k); unused losses carry forward. On sale, claimed depreciation is recaptured at up to 25%, and gains may owe capital-gains tax (a 1031 exchange can defer both). Figures are a year-1 estimate at your 24.0% rate — not tax advice; consult a CPA.
Schools (NCES district)
- District
- New Britain School District
- NCES district ID
- 0902670
- Math proficiency
- 6% ▼ -6.00%
- Reading proficiency
- 17% ▼ -5.00%
- Median HH income
- $40,827
- Composite
- 9.95/100
- National rank
- #9816
- State rank
- #153 of 153 in CT
Livability — New Britain
- Score
- 74/100
- State rank
- #67
- US rank
- #4936
Category grades
Schools grade is shown separately in the Schools card above.
Census & demographics
- Census place
- New Britain, CT
- County
- Hartford County · 754,208 people
- City population
- 66,322
- Metro
- Hartford-East Hartford-Middletown, CT
- Population (ZIP)
- 36,774
- Household income
- $62,645
- Rent vs Own
- Severe rent burden
- 1835.0
Population outlook (Capitol County) Hauer SSP2
- By 2040
- 1,063,519
Race, ethnicity, and origin ACS 2023
- Neighborhood character
- Diverse neighborhood (Simpson 0.64)
- Race & ethnicity
- White 47% Hispanic / Latino 36% Two or more races 13% Black 10% Asian 3%
- Hispanic origin (detail)
- Mexican 1% Puerto Rican 25% Dominican 4%
- Common ancestry
- Romanian 19% Lithuanian 3% Russian 1%
- Foreign-born
- 22% · Canada, Vietnam, China
- Languages at home
- 50% English-only · Spanish 26% Russian/Polish/Slavic 15% French/Haitian/Cajun 3%
Political lean MEDSL · Capitol
- 2024 margin
- Strong D (+21.9) · D 60.1% · R 38.2% · Other 1.7%
- All cycles
- 2024: D+21.9
Not yet ingested
- Civics
- —
Market trends
- HPI YoY
- ▲ 65.76%
- Current HPI
- 491.4724
- Rent YoY
- ▲ 4.94%
- Metro
- Hartford-East Hartford-Middletown, CT
- State GDP YoY
- ▲ 1.06%
- F500 in state
- 38
Industry mix (Fortune 500 HQ in CT)
| Industry | F500 HQs | Revenue |
|---|---|---|
| Industrial Machinery | 4 | $38B |
|
||
| Insurance | 3 | $71B |
|
||
| Financial Services | 2 | $25B |
|
||
| Transportation / Logistics | 2 | $18B |
|
||
| Healthcare | 1 | $247B |
|
||
| Telecommunications | 1 | $55B |
|
||
Price history
+131.0% since first listed9 events — show timeline
- 2026-05-29 Pending — Smart MLS
- 2026-05-20 Listing Removed — Smart MLS
- 2026-05-20 Relisted — Smart MLS
- 2026-05-20 Listed $149,900 Smart MLS
- 2026-01-20 Pending — Smart MLS
- 2026-01-09 Listed $164,900 Smart MLS
- 2017-09-26 Sold (MLS) $60,000 Smart MLS
- 2017-08-30 Listing Removed — Smart MLS
- 2017-05-15 Listed $64,900 Smart MLS
Property tax history
+2.9%/yrLatest (2025): $3,653 · -1.0% YoY. Source: county tax records.
Cash-flow waterfall
monthlySold comps — $/sqft
last 12 mo · ≤1 miLoading sold comps…