 Triplex
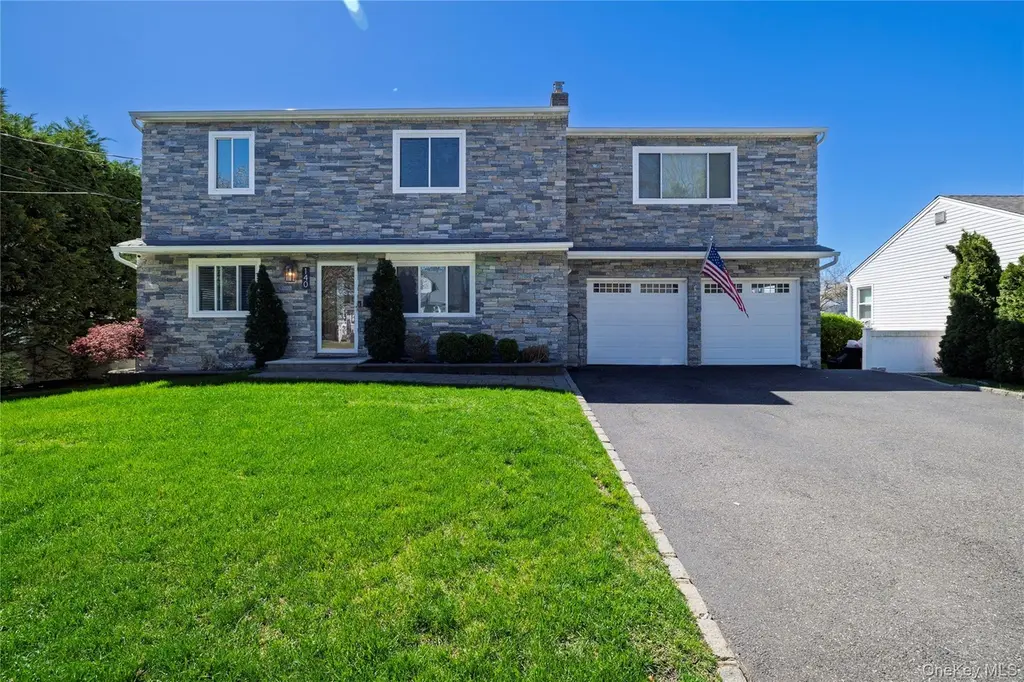
140 Baltimore Ave · Massapequa, NY
Flood risk 1/10 · Minimal
- FEMA flood zone
- X (unshaded)
- Chance of flooding over 30 yrs
- 0.0%
- Est. flood insurance / yr
- $473 – $860
Fire risk 3/10 · Minor
- Est. fire insurance / yr
- $691 – $1,283
Heat risk 6/10 · Moderate
- Hot days now (above 94°F)
- 7 days/yr
- Hot days in 30 yrs
- 16 days/yr
Wind risk 6/10 · Moderate
- Chance of severe wind over 30 yrs
- 62.0%
Air-quality risk 4/10 · Minor
- Unhealthy air days now
- 3 days/yr
- Unhealthy air days in 30 yrs
- 5 days/yr
Risk factors via First Street. Map © Google.
Why this score? — see what drove the D grade
The composite is a weighted blend of 9 inputs, each scored 0–100. Each bar is that input's sub-score; the figure is the points it added to the 100-point composite (weight × sub-score).
- Cash flow +11.3/30.0
- ARV discount +7.5/15.0
- Schools +7.4/10.0
- Livability +4.1/5.0
- DSCR +3.3/10.0
- 1% rule +3.2/10.0
- Rent growth +2.5/5.0
- Condition / age +2.5/5.0
- Appreciation +0.0/10.0
$1,375,000
🖨 Deal sheet (PDF) 📄 Offer letter ✓ Due diligence
Multi-family units
County records classify this as Multi-Family (2-4 Unit). Listing-text estimate: 3 units. confirmed
Listing remarks
Set on a generous 80x100 lot, this exceptional property offers a rare combination of modern upgrades, flexible living space, and long-term efficiency. Designed with comfort and versatility in mind, the home features a thoughtfully laid-out floor plan ideal for multi-generational living. Two spacious ensuite bedrooms provide privacy and convenience, while a separate apartment offers additional living options or potential income. The outdoor space is a true highlight, showcasing a stunning new gunite pool—perfect for entertaining or relaxing in your own private retreat. Significant recent upgrades include a new roof (2025) paired with 41 owned solar panels, delivering both peace of mind
Key facts
- 8,000 sq ft lot
- 2 garage spots
- Pool
Property features AI
Exterior
- Parking: Garage; 2 garage spaces
- Utilities: Public sewer; Electricity connected; Natural gas connected; Solar energy generation
- Home design: Duplex
- Construction: Frame construction
- Exterior features: Vinyl fencing; In-ground private pool
Interior
- Bedrooms: One 2-bedroom unit; One 4-bedroom unit
- Bathrooms: Five full bathrooms
- Heating & cooling: Baseboard heating; Wall/window air conditioning units
- Interior features: First-floor bedroom; First-floor full bathroom; Crown molding; Finished basement; Has fireplace; Patio
Neighborhood map
What this means for you Summary
Snapshot
- This is a 3 × 3-bed/?-bath units multifamily listed at $1.38M.
Deal economics
- At list price, monthly cash flow is $-498 ($-6k/yr) — negative. Per door: $-166/mo.
- To cash-flow at today's rent, offer at most $1.29M (6.4% below list).
- To meet the 1% rule (rent ≥ 1% of price), the offer needs to be $1.12M (18.3% below list).
- Recommended offer: $1.12M (18.3% below list) — sets the bar for 1% rule.
- Cap rate 5.9% vs local median 2.5% in Massapequa — top-decile yield for the area; either an underpriced asset or a hidden risk that comps aren't pricing in. Stress-test before assuming the spread holds.
Location & tenants
- Location reads 82/100 on livability (#82 in NY, #1,242 nationally) — a professional / high-income tenant draw. Strengths: commute A+, employment A+, housing A+; Watch: amenities D, cost of living F.
- Massapequa Union Free School District (suburban): math 76% / reading 83% proficiency, ranked #39 of 590 in NY (top 7%) — strong family-tenant draw, lease renewals of 3-5y typical; only 4% free/reduced lunch — higher-income household profile.
- Zoned schools: Lockhart Elementary School (math 72% / reading 82%, grade A, #244 of 2,108 statewide, top 13%, 366 students, 8% FRL); Berner Middle School (math 63% / reading 71%, grade A-, #101 of 729 statewide, top 15%, 1,596 students, 10% FRL); Massapequa High School (math 97% / reading 100%, grade A+, #10 of 1,100 statewide, top 1%, 1,453 students, 10% FRL).
- Market conditions: 269 active listings in the ZIP; 824 units permitted in Nassau County in 2024 (153 in 5+ unit buildings).
Forward outlook
- Local home prices are declining (-3.0%/yr); year-one equity from $10k of loan paydown is wiped out by about $41k of value loss. Plan a longer hold.
- Nassau County population projected at +7% by 2050 — modest demand growth; plan on rents tracking national, not racing it.
Negotiation context
- It's been on market 33 days — a 3% lower offer ($1.33M) is reasonable based on typical stale-listing flexibility.
- 2 sale attempts; this cycle's ask is 18233% above the opening price — seller raised mid-cycle; expect resistance to lowballs.
- Current owner paid $448k; list at $1.38M implies a 207% gain — meaningful room to come down on a strong offer.
Risks & watch-outs
- Watch-outs: built in 1958 — expect roof / HVAC / electrical / plumbing capex.
- Climate carrying-cost: major wind risk, 62% chance of damaging wind over 30y; extreme-heat days projected 7→16/yr by 2055 (HVAC capex compounding) — expect insurance premiums to compound above CPI over the hold.
Questions for the listing agent
- What do current leases actually rent for vs. the listed asking? Can we see a recent rent roll and the last 12 months of T-12 income?
- It's been on market 33 days. Have you received any prior offers? Is the seller open to a 18% concession, seller financing, or rate buy-down credit?
- Can we see the unit-by-unit rent roll, current vacancy, and any below-market leases? What's the average tenancy length?
- What capital expenditures (roof, boiler, parking lot, exteriors) have been made in the last 5 years, and what's planned in the next 2?
- Built in 1958 — when were the roof, HVAC, electrical panel, plumbing, and water heater last replaced?
- Is there a deadline driving the sale (1031 exchange, divorce, estate, relocation)? That informs how much negotiation room exists.
- Schools are A-rated — typically a magnet for longer-tenancy family renters. What's the average tenant stay here, and is there a school-zone premium baked into asking?
- The area grade is low — what's the realistic commute time and amenity access for the typical tenant pool here? Any planned neighborhood developments (good or bad) we should know about?
- What's the average days-on-market for RENTAL listings here right now (not sales)? A rising rental-DOM trend means longer vacancies and softer asking-rent achievability than the comps imply.
- What's the recent tenant-quality profile in this submarket — average credit score on applications, eviction rate, late-payment / NSF rate, and stable-employment percentage? A property-management company in the area should have these aggregated.
- How much new apartment / multifamily construction is in the pipeline within 1–3 miles? Heavy new supply (>2% of stock underway) typically softens rents 12–24 months out; light construction supports rent growth.
Investment metrics
- 1% rule
- 0.82% ✗
- Cap rate
- 5.86%
- Cash-on-cash
- -1.55%
- DSCR
- 0.93
- GRM
- 10.2
CMA / ARV
No comps found within radius.
Projected returns pro-forma
-3.0% appreciation · 3.0% rent growth · sell at horizon
- IRR
- -18.9%
- Equity multiple
- 0.34×
- Total profit
- $-254,431
- Equity at exit
- $205,017
- IRR
- -11.3%
- Equity multiple
- 0.32×
- Total profit
- $-262,016
- Equity at exit
- $118,885
Cash invested: $385,000 (down + closing). Projections, not guarantees.
Landlord ↔ Tenant lean methodology
- Overall (STATE)
- 15 Strongly Tenant-Friendly
- State New York
- 15 Strongly Tenant-Friendly · D+10
- County
- — inherits STATE
- City
- — inherits STATE
ZIP-level market 11758
- Active inventory
- 269
- Price-to-rent
- 30.6×
Monthly cashflow live
- Estimated rent
- $11,239 medium interval (Pro) →
- Mortgage (P&I)
- −$7,211
- Tax from tax record
- −$1,593 /mo · $19,118/yr
- Insurance
- −$573
- HOA
- −$0
- Vacancy / Maint / Mgmt
- −$2,360
- Net cashflow
- $-498
Break-even live
Sensitivity live
| Price | -10% $280 | -5% $-109 | +0% $-498 | +5% $-887 | +10% $-1,276 |
|---|---|---|---|---|---|
| Rent | -10% $-1,386 | -5% $-942 | +0% $-498 | +5% $-54 | +10% $390 |
| Rate | -1.0pp $195 | -0.5pp $-148 | base $-498 | +0.5pp $-854 | +1.0pp $-1,217 |
3-unit breakdown (identical units grouped — click to expand)
| Units | Beds | Baths | Est. rent |
|---|---|---|---|
| 3× units | 3 | — | $11,238 |
| #1 | 3 | — | $3,746 |
| #2 | 3 | — | $3,746 |
| #3 | 3 | — | $3,746 |
| Total (3 units) | $11,239 | ||
UW: 25.0% down · 7.5% · 30yr · 1.5% tax · 5.0% vac · 8.0% maint · 8.0% mgmt
Financing live
Cash to close
- Down payment
- $343,750
- Closing costs
- $41,250
- Reserves months
- —
- Total cash needed
- —
Loan-product check · same deal, 3 products live
Conventional
25% down · 7.5% · 30yr
- Down + closing
- —
- Monthly P&I
- —
- Monthly cashflow
- —
- DSCR
- —
- Eligible?
- —
Personal DTI + credit; lowest rate.
DSCR
20% down · 8.5% · 30yr
- Down + closing
- —
- Monthly P&I
- —
- Monthly cashflow
- —
- DSCR
- —
- Eligible?
- —
No personal income docs; deal must DSCR.
Hard money
10% down · 12.0% · 12mo
- Down + closing
- —
- Monthly P&I
- —
- Monthly cashflow
- —
- DSCR
- —
- Eligible?
- —
Short-term bridge; refi at stabilization.
Listing history 17 events
-
2026-06-21days on market $1,375,000 Active 33 DOM
-
2026-06-21days on market $1,375,000 Active 32 DOM
-
2026-06-18days on market $1,375,000 Active 30 DOM
-
2026-06-17days on market $1,375,000 Active 29 DOM
-
2026-06-16days on market $1,375,000 Active 28 DOM
-
2026-06-15days on market $1,375,000 Active 27 DOM
-
2026-06-13days on market $1,375,000 Active 25 DOM
-
2026-06-12days on market $1,375,000 Active 24 DOM
-
2026-06-09days on market $1,375,000 Active 21 DOM
-
2026-06-08days on market $1,375,000 Active 20 DOM
-
2026-06-07days on market $1,375,000 Active 19 DOM
-
2026-06-04days on market $1,375,000 Active 15 DOM
-
2026-06-02days on market $1,375,000 Active 14 DOM
-
2026-06-01days on market $1,375,000 Active 13 DOM
-
2026-05-31days on market $1,375,000 Active 12 DOM
-
2026-05-06historical $1,375,000 1319-char remark
-
2011-08-02soldstatus $447,500
ⓘ Source: listings_history table (triggers on properties + properties_extension) + one-shot
backfill from property_details.listing_events for pre-trigger history.
Tax reassessment forecast NY · Partial reset (capped growth)
- Current annual tax
- $19,118 · $1,593/mo
- Projected year-2 tax
- $21,178 · $1,765/mo
- Expected delta
- +$2,060/yr (+$172/mo · 10.8%)
ⓘ Screening estimate from a state-policy table — verify with the county assessor before closing.
Climate risk First Street
- Flood 1/10 Low FEMA zone X (unshaded) · 0% chance over 30 yrs
- Wildfire 3/10 Moderate
- Heat 6/10 Major 7 d/yr ≥94°F today · 16 d/yr by 30 yrs out
- Wind 6/10 Major 62% chance of damaging wind over 30 yrs
- Air quality 4/10 Moderate 3 unhealthy d/yr today · 5 by 30 yrs out
Nearby sold comps map
Loading sold comps map…
Walkable amenities ~0.75 mi
Loading nearby amenities…
Taxation est. · year 1
- Rental income
- $134,868
- − Mortgage interest
- −$77,021
- − Property taxes
- −$19,118
- − Insurance
- −$6,875
- − Repairs & maintenance
- −$10,789
- − Management
- −$10,789
- − Depreciation
- −$40,000
- Taxable loss
- −$29,726
- Est. tax savings @ 24.0%
- +$7,134
- After-tax cash flow
- $1,159/yr
For passive investors: Depreciation is non-cash, so a rental often shows a tax loss while cash-flowing — sheltering income. Rental losses are passive: they offset passive income freely, and up to $25,000/yr can offset ordinary (W-2) income if you actively participate and your MAGI is under $100k (phasing out to $0 by $150k); unused losses carry forward. On sale, claimed depreciation is recaptured at up to 25%, and gains may owe capital-gains tax (a 1031 exchange can defer both). Figures are a year-1 estimate at your 24.0% rate — not tax advice; consult a CPA.
Schools (NCES district)
- District
- Massapequa Union Free School District
- NCES district ID
- 3618630
- Math proficiency
- 76% ▼ -3.00%
- Reading proficiency
- 83% ▲ 12.00%
- Median HH income
- $116,173
- Composite
- 73.55/100
- National rank
- #178
- State rank
- #39 of 590 in NY
Livability — Massapequa
- Score
- 82/100
- State rank
- #82
- US rank
- #1242
Category grades
Schools grade is shown separately in the Schools card above.
Census & demographics
- Census place
- Massapequa, NY
- City population
- 54,741
- Population (ZIP)
- 54,741
Population outlook (Nassau County) Hauer SSP2
- Today (2025)
- 1,409,302 people
- By 2030
- 1,431,482 · +1.6%
- By 2040
- 1,471,607 · +4.4%
- By 2050
- 1,502,845 · +6.6%
- By 2075
- 1,575,403 · +11.8%
- By 2100
- 1,554,356 · +10.3%
Race, ethnicity, and origin ACS 2023
- Neighborhood character
- Predominantly White (80%)
- Race & ethnicity
- White 80% Hispanic / Latino 11% Two or more races 7% Black 6% Asian 2%
- Hispanic origin (detail)
- Puerto Rican 4% Dominican 1%
- Common ancestry
- Romanian 4% Scotch-Irish 2% Italian 1%
- Foreign-born
- 8% · Canada, China
- Languages at home
- 89% English-only · Spanish 6% Other Indo-European 3% Russian/Polish/Slavic 1%
Political lean MEDSL · Nassau
- 2024 margin
- Toss-up / Even · D 47.9% · R 52.1%
- 2008→2024 swing
- -12.6pp toward R · 2008: 8.4pp · 2024: -4.2pp
- All cycles
- 2024: R+4.2 2020: D+9.5 2016: D+5.3 2012: D+6.7 2008: D+8.4
Not yet ingested
- Civics
- —
Market trends
- HPI YoY
- ▼ -765.19%
- Current HPI
- 287.8085
- Rent YoY
- —
- Metro
- —
- State GDP YoY
- ▲ 2.60%
- F500 in state
- 92
Industry mix (Fortune 500 HQ in NY)
| Industry | F500 HQs | Revenue |
|---|---|---|
| Financial Services | 10 | $950B |
|
||
| Consumer Goods | 9 | $162B |
|
||
| Insurance | 4 | $225B |
|
||
| Telecommunications | 2 | $144B |
|
||
| Pharmaceuticals | 2 | $112B |
|
||
| Media / Entertainment | 2 | $69B |
|
||
Price history
-98.3% since first listed4 events — show timeline
- 2026-06-05 Listed for Rent $7,500 ONEKEY
- 2026-05-20 Listed $1,375,000 OneKey® MLS as Distributed by MLS Grid
- 2026-05-06 Coming Soon $1,375,000 OneKey® MLS as Distributed by MLS Grid
- 2011-08-02 Sold (Public Records) $447,500 Public Records
Property tax history
+2.7%/yrLatest (2024): $19,118 · +7.7% YoY. Source: county tax records.
Cash-flow waterfall
monthlySold comps — $/sqft
last 12 mo · ≤1 miLoading sold comps…