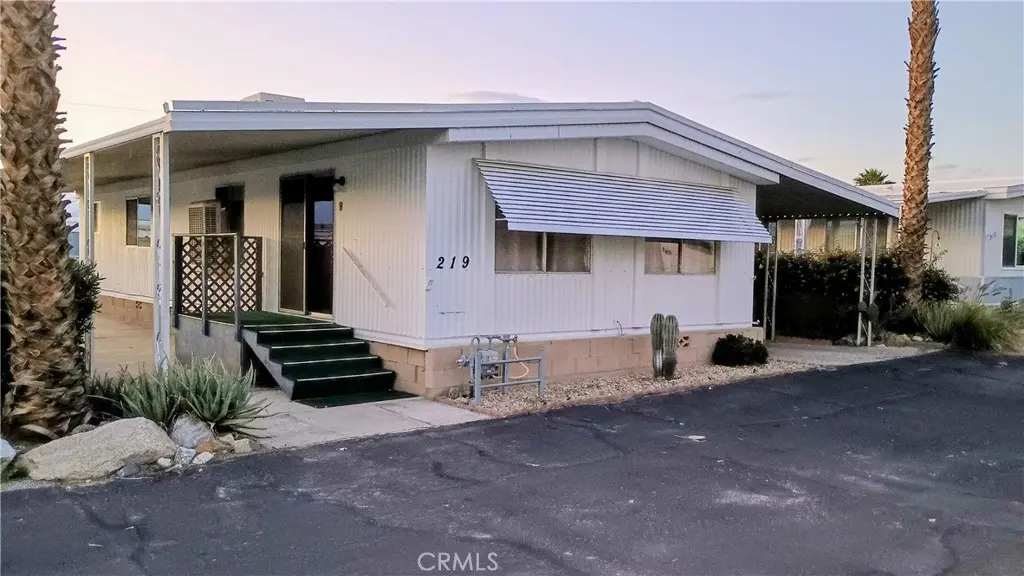
17800 Langlois Rd · Desert Edge, CA
Flood risk 1/10 · Minimal
- FEMA flood zone
- X (unshaded)
- Chance of flooding over 30 yrs
- 0.0%
- Est. flood insurance / yr
- $507 – $1,088
Fire risk 5/10 · Moderate
- Est. fire insurance / yr
- $659 – $1,223
Heat risk 8/10 · Major
- Hot days now (above 109°F)
- 4 days/yr
- Hot days in 30 yrs
- 10 days/yr
Wind risk 1/10 · Minimal
- Chance of severe wind over 30 yrs
- —
Air-quality risk 5/10 · Moderate
- Unhealthy air days now
- 6 days/yr
- Unhealthy air days in 30 yrs
- 8 days/yr
Risk factors via First Street. Map © Google.
Why this score? — see what drove the B grade
The composite is a weighted blend of 9 inputs, each scored 0–100. Each bar is that input's sub-score; the figure is the points it added to the 100-point composite (weight × sub-score).
- Cash flow +30.0/30.0
- 1% rule +10.0/10.0
- DSCR +10.0/10.0
- ARV discount +10.0/15.0
- Livability +3.4/5.0
- Schools +2.7/10.0
- Rent growth +2.5/5.0
- Condition / age +2.5/5.0
- Appreciation +0.0/10.0
$55,000
🖨 Deal sheet (PDF) 📄 Offer letter ✓ Due diligence
Listing remarks MLS
Come see this manufacture home from Silvercrest known for its quality and style along with many owner upgrades like Cortes counter tops and vinyl flooring in the kitchen all plumbing pipes going to home have been upgraded to copper in addition to having central ac and heat you can save energy with the evaporator cooler this home has a bonus room that is perfect for a home office or small gym with a separate entry way. and there is a nice, covered wood deck to enjoy those great desert nights not to mention you get all this in a HOT MINERAL SPRINGS PARK that boast fantastic facilities, billiards room, sauna, spa, shuffleboard and much more.
Key facts
- Clubhouse
- Swimming pool
- Community kitchen
Tags
Property features AI
Finance
- Other: Lot density listed as 36-40 units per acre
- HOA & community: Senior community; Land lease of $575; Rural neighborhood
Exterior
- Parking: Located in Sparkling Waters mobile home park
- Utilities: Private water; Septic tank
- Home design: Single-story property; Mobile home (20' x 52'); Living area is an estimate
- Construction: Year built reported by builder
- Exterior features: Community pool; Paved lot
Interior
- Bathrooms: 2 full bathrooms
- Interior features: Entry on the right side; Single-story home
- Laundry & utility: Inside laundry; Washer included; Dryer included
Neighborhood map
What this means for you Summary
Snapshot
- This is a 2-bed/2.0-bath manufactured listed at $55k.
Deal economics
- At list price, monthly cash flow is $1k ($14k/yr) — positive.
- The deal already cash-flows at list — no discount required.
- Meets the 1% rule at list price ($2k rent vs $55k).
- Recommended offer: $53k (3.0% below list) — sets the bar for market timing.
- Cap rate 31.0% vs local median 14.6% in Desert Edge — top-decile yield for the area; either an underpriced asset or a hidden risk that comps aren't pricing in. Stress-test before assuming the spread holds.
Location & tenants
- Location reads 68/100 on livability (#297 in CA) — a middle-class / working-renter tenant base. Strengths: cost of living A+, housing A+; Watch: crime C-, commute D-, employment F.
- Palm Springs Unified (suburban): math 21% / reading 42% proficiency, ranked #328 of 517 in CA (top 63%) — families likely to look elsewhere, expect single-tenant / working-renter base with shorter leases; 73% free/reduced lunch — lower-income household profile, screen leases tightly.
- Zoned schools: Della S. Lindley Elementary (584 students, 96% FRL); Desert Springs Middle (803 students, 99% FRL); Desert Hot Springs High (math 27% / reading 52%, grade F, #532 of 1,170 statewide, top 48%, 1,742 students, 98% FRL) — zoned schools average 98% FRL vs 73% district-wide (24 pts higher); higher-poverty schools than district average — tighter screening recommended.
- Market conditions: 218 active listings in the ZIP; 5 comparable units currently listed for rent nearby; rentals at typical pace (median 26d on market — plan ~3-4 weeks tenant-placement turnaround); 40% of comp listings sitting > 30 days — soft ceiling on asking rent; 9,195 units permitted in Riverside County in 2024 (1,512 in 5+ unit buildings).
Forward outlook
- Local home prices are declining (-3.0%/yr); year-one equity from $380 of loan paydown is wiped out by about $2k of value loss. Plan a longer hold.
- Riverside County population projected at +22% by 2050 — long-run rental-demand tailwind backs the buy-and-hold thesis.
- At projected returns (-3.0% appreciation + 3.0% rent growth), your $15k cash investment doubles in ~2 years — after that, you're playing with house money.
Negotiation context
- It's been on market 51 days — a 3% lower offer ($53k) is reasonable based on typical stale-listing flexibility.
- 3 sale attempts since 4y ago with the ask held roughly flat each time — persistent listings suggest the price (not the market) is what's stuck; bring a comps-based counter.
Risks & watch-outs
- Climate carrying-cost: moderate wildfire risk; extreme-heat days projected 4→10/yr by 2055 (HVAC capex compounding) — expect insurance premiums to compound above CPI over the hold.
Questions for the listing agent
- It's been on market 51 days. Have you received any prior offers? Is the seller open to a 3% concession, seller financing, or rate buy-down credit?
- Built in 1979 — when were the roof, HVAC, electrical panel, plumbing, and water heater last replaced?
- Is there a deadline driving the sale (1031 exchange, divorce, estate, relocation)? That informs how much negotiation room exists.
- Schools are F-rated, which usually means shorter tenancies and higher turnover. Who's the typical renter profile here, and what's been the actual vacancy rate?
- What's the average days-on-market for RENTAL listings here right now (not sales)? A rising rental-DOM trend means longer vacancies and softer asking-rent achievability than the comps imply.
- What's the recent tenant-quality profile in this submarket — average credit score on applications, eviction rate, late-payment / NSF rate, and stable-employment percentage? A property-management company in the area should have these aggregated.
- How much new for-sale + rental construction is in the pipeline within 1–3 miles? Heavy new supply typically softens prices + rents 12–24 months out; constrained supply supports both.
Investment metrics
- 1% rule
- 3.45% ✓
- Cap rate
- 30.95%
- Cash-on-cash
- 88.08%
- DSCR
- 4.92
- GRM
- 2.4
CMA / ARV
- ARV (median comp)
- $58,208
- List price
- $55,000
- Delta
- -5.51%
- Verdict
- FAIR
- Comps
- 20 within 1.0 mi
Show comp detail 12 sales within ~0.75 mi
| Address | Dist | Beds/Ba | Sqft | Sold | Price | $/sf | Match |
|---|---|---|---|---|---|---|---|
| 17625 Langlois #105 | 0.19mi | 2/2.0 | 840 (0%) | 1mo | $55,000 | $65 | 90 |
| 18131 Langlois Rd Unit S15 | 0.33mi | 2/1.0 | 820 (-2%) | 2mo | $75,000 | $91 | 75 |
| 17555-2 Corkill Rd #28 | 0.64mi | 2/2.0 | 880 (+5%) | 3mo | $99,990 | $114 | 59 |
| 70200 Dillon Rd #550 | 0.72mi | 2/2.0 | 800 (-5%) | 1mo | $122,000 | $153 | 57 |
| 70200 Dillon Rd #102 | 0.72mi | 2/1.5 | 800 (-5%) | 0mo | $72,000 | $90 | 56 |
| 18555 Roberts Rd #17 | 0.41mi | 2/2.0 | 960 (+14%) | 3mo | $57,000 | $59 | 55 |
| 70200 Dillon Rd #376 | 0.61mi | 1/1.0 (-1) | 800 (-5%) | 3mo | $60,000 | $75 | 52 |
| 70200 Dillon Rd #536 | 0.61mi | 2/1.5 | 750 (-11%) | 1mo | $90,000 | $120 | 51 |
| 17850 Corkill Rd | 0.49mi | 2/1.0 | 750 (-11%) | 10mo | $32,000 | $43 | 47 |
| 18801 Roberts Rd #86 | 0.50mi | 2/1.0 | 720 (-14%) | 8mo | $30,000 | $42 | 42 |
| 70200 Dillon Rd #45 | 0.58mi | 2/1.0 | 750 (-11%) | 12mo | $57,500 | $77 | 41 |
| 18801 Roberts Rd #171 | 0.50mi | 2/1.0 | 724 (-14%) | 11mo | $35,000 | $48 | 40 |
Match score weights: distance 35% · size 25% · config 20% · recency 20%. Top-matched comps best support the ARV.
Projected returns pro-forma
-3.0% appreciation · 3.0% rent growth · sell at horizon
- IRR
- 88.7%
- Equity multiple
- 5.10×
- Total profit
- $63,102
- Equity at exit
- $8,201
- IRR
- 91.7%
- Equity multiple
- 10.59×
- Total profit
- $147,741
- Equity at exit
- $4,755
Cash invested: $15,400 (down + closing). Projections, not guarantees.
Landlord ↔ Tenant lean methodology
- Overall (STATE)
- 18 Strongly Tenant-Friendly
- State California
- 18 Strongly Tenant-Friendly · D+13
- County
- — inherits STATE
- City
- — inherits STATE
ZIP-level market 92241
- Home prices YoY
- -22.8%
- Active inventory
- 218
- Price-to-rent
- 2.4×
Monthly cashflow live
- Estimated rent
- $1,900 high interval (Pro) →
- Mortgage (P&I)
- −$288
- Tax from tax record
- −$59 /mo · $711/yr
- Insurance
- −$23
- HOA
- −$0
- Vacancy / Maint / Mgmt
- −$399
- Net cashflow
- $1,130
Break-even live
Sensitivity live
| Price | -10% $1,161 | -5% $1,146 | +0% $1,130 | +5% $1,115 | +10% $1,099 |
|---|---|---|---|---|---|
| Rent | -10% $980 | -5% $1,055 | +0% $1,130 | +5% $1,205 | +10% $1,280 |
| Rate | -1.0pp $1,158 | -0.5pp $1,144 | base $1,130 | +0.5pp $1,116 | +1.0pp $1,102 |
UW: 25.0% down · 7.5% · 30yr · 1.5% tax · 5.0% vac · 8.0% maint · 8.0% mgmt
Financing live
Cash to close
- Down payment
- $13,750
- Closing costs
- $1,650
- Reserves months
- —
- Total cash needed
- —
Loan-product check · same deal, 3 products live
Conventional
25% down · 7.5% · 30yr
- Down + closing
- —
- Monthly P&I
- —
- Monthly cashflow
- —
- DSCR
- —
- Eligible?
- —
Personal DTI + credit; lowest rate.
DSCR
20% down · 8.5% · 30yr
- Down + closing
- —
- Monthly P&I
- —
- Monthly cashflow
- —
- DSCR
- —
- Eligible?
- —
No personal income docs; deal must DSCR.
Hard money
10% down · 12.0% · 12mo
- Down + closing
- —
- Monthly P&I
- —
- Monthly cashflow
- —
- DSCR
- —
- Eligible?
- —
Short-term bridge; refi at stabilization.
Rent comps 5 comps
| Address | Beds | Baths | Sqft | Rent | $/sqft | DOM | Units | Dist |
|---|---|---|---|---|---|---|---|---|
| 18070 Langlois Rd Dsrt Hot Spgs, CA | 2.0 | 2.0 | 950 | $1,850 | $1.95 | 26d | 1 | 0.23mi |
| 18070 Langlois Rd Dsrt Hot Spgs, CA | 2.0 | 2.0 | 950 | $1,850 | $1.95 | 1d | 1 | 0.23mi |
| 18070 Langlois Rd #257 Desert Hot Springs, CA | 2.0 | 2.0 | 1056 | $1,850 | $1.75 | 45d | 1 | 0.23mi |
| 70875 Dillon Rd Desert Hot Springs, CA | 2.0 | 2.0 | 720 | $2,200 | $3.06 | 45d | 1 | 0.43mi |
| 69360 Poolside Dr Desert Hot Springs, CA | 3.0 | 2.0 | 648 | $1,800 | $2.78 | 4d | 1 | 1.41mi |
Listing history 21 events
-
2026-06-21days on market $55,000 Active 51 DOM
-
2026-06-18days on market $55,000 Active 48 DOM
-
2026-06-17days on market $55,000 Active 47 DOM
-
2026-06-16days on market $55,000 Active 46 DOM
-
2026-06-15days on market $55,000 Active 45 DOM
-
2026-06-13days on market $55,000 Active 43 DOM
-
2026-06-13days on market $55,000 Active 42 DOM
-
2026-06-09days on market $55,000 Active 39 DOM
-
2026-06-08days on market $55,000 Active 38 DOM
-
2026-06-07days on market $55,000 Active 37 DOM
-
2026-06-04days on market $55,000 Active 34 DOM
-
2026-06-03days on market $55,000 Active 33 DOM
-
2026-06-02days on market $55,000 Active 32 DOM
-
2026-06-01days on market $55,000 Active 31 DOM
-
2026-05-31days on market $55,000 Active 30 DOM
-
2026-05-01$55,000 Active 320-char remark
-
2024-10-30historical
-
2024-09-25$89,000 Active
-
2022-06-27soldstatus $80,000 Sold
Show marketing remark (646 chars)
Come see this manufacture home from Silvercrest known for its quality and style along with many owner upgrades like Cortes counter tops and vinyl flooring in the kitchen all plumbing pipes going to home have been upgraded to copper in addition to having central ac and heat you can save energy with the evaporator cooler this home has a bonus room that is perfect for a home office or small gym with a separate entry way. and there is a nice, covered wood deck to enjoy those great desert nights not to mention you get all this in a HOT MINERAL SPRINGS PARK that boast fantastic facilities, billiards room, sauna, spa, shuffleboard and much more.
-
2022-05-14historical Backup Offers Accepted
Show marketing remark (646 chars)
Come see this manufacture home from Silvercrest known for its quality and style along with many owner upgrades like Cortes counter tops and vinyl flooring in the kitchen all plumbing pipes going to home have been upgraded to copper in addition to having central ac and heat you can save energy with the evaporator cooler this home has a bonus room that is perfect for a home office or small gym with a separate entry way. and there is a nice, covered wood deck to enjoy those great desert nights not to mention you get all this in a HOT MINERAL SPRINGS PARK that boast fantastic facilities, billiards room, sauna, spa, shuffleboard and much more.
-
2022-04-17$99,999 Active
Show marketing remark (646 chars)
Come see this manufacture home from Silvercrest known for its quality and style along with many owner upgrades like Cortes counter tops and vinyl flooring in the kitchen all plumbing pipes going to home have been upgraded to copper in addition to having central ac and heat you can save energy with the evaporator cooler this home has a bonus room that is perfect for a home office or small gym with a separate entry way. and there is a nice, covered wood deck to enjoy those great desert nights not to mention you get all this in a HOT MINERAL SPRINGS PARK that boast fantastic facilities, billiards room, sauna, spa, shuffleboard and much more.
ⓘ Source: listings_history table (triggers on properties + properties_extension) + one-shot
backfill from property_details.listing_events for pre-trigger history.
Tax reassessment forecast CA · Resets to sale price
- Current annual tax
- $711 · $59/mo
- Projected year-2 tax
- $711 · $59/mo
- Expected delta
- $0/yr ($0/mo · 0.0%)
ⓘ Screening estimate from a state-policy table — verify with the county assessor before closing.
Climate risk First Street
- Flood 1/10 Low FEMA zone X (unshaded) · 0% chance over 30 yrs
- Wildfire 5/10 Major
- Heat 8/10 Severe 4 d/yr ≥109°F today · 10 d/yr by 30 yrs out
- Wind 1/10 Low
- Air quality 5/10 Major 6 unhealthy d/yr today · 8 by 30 yrs out
Nearby sold comps map
Loading sold comps map…
Walkable amenities ~0.75 mi
Loading nearby amenities…
Taxation est. · year 1
- Rental income
- $22,799
- − Mortgage interest
- −$3,081
- − Property taxes
- −$711
- − Insurance
- −$275
- − Repairs & maintenance
- −$1,824
- − Management
- −$1,824
- − Depreciation
- −$1,600
- Taxable income
- $13,484
- Est. tax owed @ 24.0%
- −$3,236
- After-tax cash flow
- $10,328/yr
For passive investors: Depreciation is non-cash, so a rental often shows a tax loss while cash-flowing — sheltering income. Rental losses are passive: they offset passive income freely, and up to $25,000/yr can offset ordinary (W-2) income if you actively participate and your MAGI is under $100k (phasing out to $0 by $150k); unused losses carry forward. On sale, claimed depreciation is recaptured at up to 25%, and gains may owe capital-gains tax (a 1031 exchange can defer both). Figures are a year-1 estimate at your 24.0% rate — not tax advice; consult a CPA.
Schools (NCES district)
- District
- Palm Springs Unified
- NCES district ID
- 0629550
- Math proficiency
- 21% ▼ -7.00%
- Reading proficiency
- 42% ▬ 0.00%
- Median HH income
- $43,638
- Composite
- 26.76/100
- National rank
- #7131
- State rank
- #328 of 517 in CA
Livability — Desert Edge
- Score
- 68/100
- State rank
- #297
- US rank
- #9953
Category grades
Schools grade is shown separately in the Schools card above.
Census & demographics
- Census place
- Desert Edge, CA
- Population (ZIP)
- 8,624
Population outlook (Riverside County) Hauer SSP2
- Today (2025)
- 2,664,475 people
- By 2030
- 2,802,692 · +5.2%
- By 2040
- 3,050,904 · +14.5%
- By 2050
- 3,256,783 · +22.2%
- By 2075
- 3,655,058 · +37.2%
- By 2100
- 3,766,594 · +41.4%
Race, ethnicity, and origin ACS 2023
- Race & ethnicity
- White 50% Hispanic / Latino 46% Two or more races 16% Asian 2% Native American 1%
- Hispanic origin (detail)
- Mexican 36%
- Common ancestry
- Lithuanian 3% Slovak 2% Portuguese 2%
- Foreign-born
- 28% · Canada, South Korea
- Languages at home
- 57% English-only · Spanish 38% Chinese 1% Russian/Polish/Slavic 1%
Political lean MEDSL · Riverside
- 2024 margin
- Toss-up / Even · D 48.0% · R 49.3% · Other 2.6%
- 2008→2024 swing
- -3.6pp toward R · 2008: 2.3pp · 2024: -1.3pp
- All cycles
- 2024: R+1.3 2020: D+8.0 2016: D+4.3 2012: R+0.4 2008: D+2.3
Not yet ingested
- Civics
- —
Market trends
- HPI YoY
- ▼ -118.23%
- Current HPI
- 400.5663
- Rent YoY
- —
- Metro
- —
- State GDP YoY
- ▲ 3.21%
- F500 in state
- 116
Industry mix (Fortune 500 HQ in CA)
| Industry | F500 HQs | Revenue |
|---|---|---|
| Technology | 27 | $1,492B |
|
||
| Financial Services | 3 | $174B |
|
||
| Retail | 3 | $44B |
|
||
| Insurance | 3 | $26B |
|
||
| Media / Entertainment | 2 | $115B |
|
||
| Pharmaceuticals / Biotech | 2 | $62B |
|
||
Price history
-45.0% since first listed6 events — show timeline
- 2026-05-01 Listed $55,000 CRMLS
- 2024-10-30 Listing Removed — CRMLS
- 2024-09-25 Listed $89,000 CRMLS
- 2022-06-27 Sold (MLS) $80,000 TheMLS
- 2022-05-14 Contingent — TheMLS
- 2022-04-17 Listed $99,999 TheMLS
Property tax history
+1.9%/yrLatest (2025): $711 · -8.1% YoY. Source: county tax records.
Cash-flow waterfall
monthlySold comps — $/sqft
last 12 mo · ≤1 miLoading sold comps…