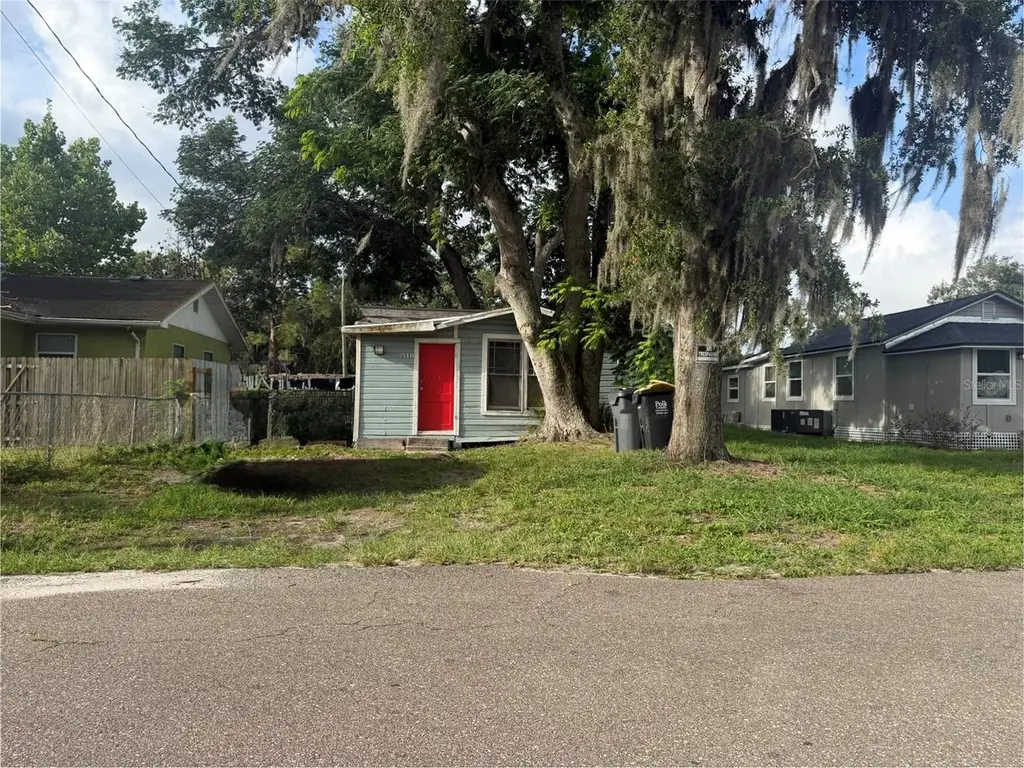
2531 Weber St · Combee Settlement, FL
Flood risk 1/10 · Minimal
- FEMA flood zone
- X (unshaded)
- Chance of flooding over 30 yrs
- 0.0%
- Est. flood insurance / yr
- $507 – $1,088
Fire risk 3/10 · Minor
- Est. fire insurance / yr
- $947 – $1,759
Heat risk 8/10 · Major
- Hot days now (above 108°F)
- 7 days/yr
- Hot days in 30 yrs
- 25 days/yr
Wind risk 9/10 · Severe
- Chance of severe wind over 30 yrs
- 99.0%
Air-quality risk 2/10 · Minimal
- Unhealthy air days now
- 1 days/yr
- Unhealthy air days in 30 yrs
- 2 days/yr
Risk factors via First Street. Map © Google.
Why this score? — see what drove the B- grade
The composite is a weighted blend of 9 inputs, each scored 0–100. Each bar is that input's sub-score; the figure is the points it added to the 100-point composite (weight × sub-score).
- Cash flow +30.0/30.0
- DSCR +10.0/10.0
- 1% rule +9.1/10.0
- ARV discount +7.5/15.0
- Schools +3.5/10.0
- Livability +3.5/5.0
- Rent growth +2.8/5.0
- Condition / age +2.5/5.0
- Appreciation +0.0/10.0
$89,900
🖨 Deal sheet 📄 Offer letter ✓ Due diligence
Listing remarks
Amazing investment opportunity in the heart of Florida! This cash-flowing property is currently tenant-occupied, offering immediate income from day one. Surrounded by rapid growth and ongoing new construction, this location continues to attract strong rental demand and long-term appreciation potential. Whether you're looking to expand your portfolio or secure a turnkey investment, this property presents a solid opportunity with upside as the area continues to develop. Don’t miss your chance to own in one of Florida’s fastest-growing markets.
Key facts
- 3,101 sq ft lot
- Built 1939
- Listed 16 days
Property features AI
Finance
- Other: Lot roughly 41 x 75 (approximately 0.07 acres)
- HOA & community: No HOA/association
Exterior
- Utilities: Public water; Septic tank sewer; Public utilities
- Home design: Single family residence; Residential property; One story; Faces north; Completed condition; Zoning: R-2; Entry level: One
- Construction: Frame construction; Shingle roof; Other roof type; Crawlspace foundation; Built area about 698 square feet
- Exterior features: Other exterior features
Interior
- Kitchen: Range; Refrigerator
- Bedrooms: 2 bedrooms
- Flooring: Carpet; Ceramic tile; Other
- Bathrooms: 1 full bathroom
- Heating & cooling: Electric heating; Mini-split cooling unit(s)
- Interior features: Ceiling fans
- Laundry & utility: Laundry: Other
Neighborhood map
What this means for you Summary
Snapshot
- This is a 2-bed/1.0-bath single-family listed at $90k.
Deal economics
- At list price, monthly cash flow is $411 ($5k/yr) — positive.
- The deal already cash-flows at list — no discount required.
- Meets the 1% rule at list price ($1k rent vs $90k).
- Recommended offer: $89k (1.5% below list) — sets the bar for market timing.
Location & tenants
- Location reads 69/100 on livability (#476 in FL) — a middle-class / working-renter tenant base. Strengths: cost of living A+, housing A+, health & safety A+; Watch: schools C-, employment D, amenities F.
- Polk (suburban): math 39% / reading 43% proficiency, ranked #62 of 73 in FL (top 85%) — families likely to look elsewhere, expect single-tenant / working-renter base with shorter leases.
- Market conditions: Rents rising (+1.1%/yr); 253 active listings in the ZIP; 9 comparable units currently listed for rent nearby; rentals at typical pace (median 24d on market — plan ~3-4 weeks tenant-placement turnaround); 10,384 units permitted in Polk County in 2024 (1,716 in 5+ unit buildings).
Forward outlook
- Local home prices are declining (-3.0%/yr); year-one equity from $622 of loan paydown is wiped out by about $3k of value loss. Plan a longer hold.
- Polk County population projected at +33% by 2050 — long-run rental-demand tailwind backs the buy-and-hold thesis.
- At projected returns (-3.0% appreciation + 1.1% rent growth), your $25k cash investment doubles in ~8 years — after that, you're playing with house money.
Negotiation context
- It's been on market 16 days — a 2% lower offer ($89k) is reasonable based on typical stale-listing flexibility.
Risks & watch-outs
- Watch-outs: built in 1939 — expect roof / HVAC / electrical / plumbing capex.
- Climate carrying-cost: severe wind risk, 99% chance of damaging wind over 30y; extreme-heat days projected 7→25/yr by 2055 (HVAC capex compounding) — expect insurance premiums to compound above CPI over the hold.
Questions for the listing agent
- Built in 1939 — when were the roof, HVAC, electrical panel, plumbing, and water heater last replaced?
- Is there a deadline driving the sale (1031 exchange, divorce, estate, relocation)? That informs how much negotiation room exists.
- What's the average days-on-market for RENTAL listings here right now (not sales)? A rising rental-DOM trend means longer vacancies and softer asking-rent achievability than the comps imply.
- What's the recent tenant-quality profile in this submarket — average credit score on applications, eviction rate, late-payment / NSF rate, and stable-employment percentage? A property-management company in the area should have these aggregated.
- How much new for-sale + rental construction is in the pipeline within 1–3 miles? Heavy new supply typically softens prices + rents 12–24 months out; constrained supply supports both.
Investment metrics
- 1% rule
- 1.41% ✓
- Cap rate
- 11.79%
- Cash-on-cash
- 19.62%
- DSCR
- 1.87
- GRM
- 5.9
CMA / ARV
No comps found within radius.
Projected returns pro-forma
-3.0% appreciation · 1.05% rent growth · sell at horizon
- IRR
- 9.5%
- Equity multiple
- 1.37×
- Total profit
- $9,196
- Equity at exit
- $13,404
- IRR
- 17.0%
- Equity multiple
- 2.28×
- Total profit
- $32,111
- Equity at exit
- $7,773
Cash invested: $25,172 (down + closing). Projections, not guarantees.
Landlord ↔ Tenant lean methodology
- Overall (STATE)
- 87 Strongly Landlord-Friendly
- State Florida
- 87 Strongly Landlord-Friendly · R+3
- County
- — inherits STATE
- City
- — inherits STATE
ZIP-level market 33801
- Home prices YoY
- -15.9%
- Rents YoY
- 1.1%
- Active inventory
- 253
- Price-to-rent
- 5.9×
Monthly cashflow live
- Estimated rent
- $1,270 high interval (Pro) →
- Mortgage (P&I)
- −$471
- Tax from tax record
- −$83 /mo · $998/yr
- Insurance
- −$37
- HOA
- −$0
- Vacancy / Maint / Mgmt
- −$267
- Net cashflow
- $411
Break-even live
UW: 25.0% down · 7.5% · 30yr · 1.5% tax · 5.0% vac · 8.0% maint · 8.0% mgmt
Financing live
Cash to close
- Down payment
- $22,475
- Closing costs
- $2,697
- Reserves months
- —
- Total cash needed
- —
Loan-product check · same deal, 3 products live
Conventional
25% down · 7.5% · 30yr
- Down + closing
- —
- Monthly P&I
- —
- Monthly cashflow
- —
- DSCR
- —
- Eligible?
- —
Personal DTI + credit; lowest rate.
DSCR
20% down · 8.5% · 30yr
- Down + closing
- —
- Monthly P&I
- —
- Monthly cashflow
- —
- DSCR
- —
- Eligible?
- —
No personal income docs; deal must DSCR.
Hard money
10% down · 12.0% · 12mo
- Down + closing
- —
- Monthly P&I
- —
- Monthly cashflow
- —
- DSCR
- —
- Eligible?
- —
Short-term bridge; refi at stabilization.
Rent comps 9 comps
| Address | Beds | Baths | Sqft | Rent | $/sqft | DOM | Units | Dist |
|---|---|---|---|---|---|---|---|---|
| 832 N Combee Rd Lakeland, FL | 2.0 | 1.0 | 560 | $1,195 | $2.13 | 23d | 1 | 0.18mi |
| 2248 Weber St Lakeland, FL | 2.0 | 1.0 | 640 | $1,335 | $2.09 | 3d | 1 | 0.32mi |
| 2625 Kelly Ln Lakeland, FL | 1.0 | 1.0 | 560 | $1,200 | $2.14 | 23d | 1 | 0.53mi |
| 2437 Idlewild St Lakeland, FL | 1.0 | 1.0 | 550 | $1,099 | $2.00 | 14d | 1 | 0.76mi |
| 2437 Idlewild St Lakeland, FL | 1.0 | 1.0 | 550 | $1,099 | $2.00 | 23d | 1 | 0.76mi |
| 3245 E Main St Unit 2 Lakeland, FL | 2.0 | 2.0 | 700 | $1,250 | $1.79 | 14d | 1 | 0.89mi |
| 3245 E Main St Lakeland, FL | 2.0 | 1.0 | 750 | $1,100 | $1.47 | 23d | 1 | 0.89mi |
| 425 Burbank Ave Lakeland, FL | 1.0 | 1.0 | 400 | $949 | $2.37 | 23d | 1 | 1.02mi |
| 427 Burbank Ave Lakeland, FL | 1.0 | 1.0 | 400 | $899 | $2.25 | 23d | 1 | 1.02mi |
Listing history 12 events
-
2026-06-18days on market $89,900 Active 16 DOM
-
2026-06-17days on market $89,900 Active 15 DOM
-
2026-06-16days on market $89,900 Active 14 DOM
-
2026-06-15days on market $89,900 Active 13 DOM
-
2026-06-13days on market $89,900 Active 11 DOM
-
2026-06-10days on market $89,900 Active 8 DOM
-
2026-06-09days on market $89,900 Active 7 DOM
-
2026-06-08days on market $89,900 Active 6 DOM
-
2026-06-07days on market $89,900 Active 5 DOM
-
2026-06-05days on market $89,900 Active 2 DOM
-
2026-06-03remarks 547-char remark
-
2026-06-03$89,900 Active 1 DOM
ⓘ Source: listings_history table (triggers on properties + properties_extension) + one-shot
backfill from property_details.listing_events for pre-trigger history.
Tax reassessment forecast FL · Resets to sale price
- Current annual tax
- $998 · $83/mo
- Projected year-2 tax
- $998 · $83/mo
- Expected delta
- $0/yr ($0/mo · 0.0%)
ⓘ Screening estimate from a state-policy table — verify with the county assessor before closing.
Climate risk First Street
- Flood 1/10 Low FEMA zone X (unshaded) · 0% chance over 30 yrs
- Wildfire 3/10 Moderate
- Heat 8/10 Severe 7 d/yr ≥108°F today · 25 d/yr by 30 yrs out
- Wind 9/10 Extreme 99% chance of damaging wind over 30 yrs
- Air quality 2/10 Low 1 unhealthy d/yr today · 2 by 30 yrs out
Nearby sold comps map
Loading sold comps map…
Walkable amenities ~0.75 mi
Loading nearby amenities…
Taxation est. · year 1
- Rental income
- $15,244
- − Mortgage interest
- −$5,036
- − Property taxes
- −$998
- − Insurance
- −$450
- − Repairs & maintenance
- −$1,219
- − Management
- −$1,219
- − Depreciation
- −$2,615
- Taxable income
- $3,706
- Est. tax owed @ 24.0%
- −$889
- After-tax cash flow
- $4,048/yr
For passive investors: Depreciation is non-cash, so a rental often shows a tax loss while cash-flowing — sheltering income. Rental losses are passive: they offset passive income freely, and up to $25,000/yr can offset ordinary (W-2) income if you actively participate and your MAGI is under $100k (phasing out to $0 by $150k); unused losses carry forward. On sale, claimed depreciation is recaptured at up to 25%, and gains may owe capital-gains tax (a 1031 exchange can defer both). Figures are a year-1 estimate at your 24.0% rate — not tax advice; consult a CPA.
Schools (NCES district)
- District
- Polk
- NCES district ID
- 1201590
- Math proficiency
- 39% ▼ -11.00%
- Reading proficiency
- 43% ▼ -4.00%
- Median HH income
- $43,979
- Composite
- 34.74/100
- National rank
- #5132
- State rank
- #62 of 73 in FL
Livability — Combee Settlement
- Score
- 69/100
- State rank
- #476
- US rank
- #8672
Category grades
Schools grade is shown separately in the Schools card above.
Census & demographics
- Census place
- Combee Settlement, FL
- County
- Polk County · 740,051 people
- Metro
- Lakeland-Winter Haven, FL
- Population (ZIP)
- 35,394
- Household income
- $53,061
- Rent vs Own
- Severe rent burden
- 1291.0
Population outlook (Polk County) Hauer SSP2
- Today (2025)
- 752,975 people
- By 2030
- 804,621 · +6.9%
- By 2040
- 906,117 · +20.3%
- By 2050
- 1,000,476 · +32.9%
- By 2075
- 1,197,520 · +59.0%
- By 2100
- 1,271,518 · +68.9%
Race, ethnicity, and origin ACS 2023
- Neighborhood character
- Diverse neighborhood (Simpson 0.58)
- Race & ethnicity
- White 60% Hispanic / Latino 19% Black 16% Two or more races 8% Asian 1%
- Hispanic origin (detail)
- Mexican 5% Puerto Rican 8% Cuban 3%
- Common ancestry
- Romanian 2% Slovak 2% Lithuanian 1%
- Foreign-born
- 8% · Canada
- Languages at home
- 83% English-only · Spanish 14% French/Haitian/Cajun 1%
Political lean MEDSL · Polk
- 2024 margin
- Strong R (+20.7) · D 39.2% · R 59.9%
- 2008→2024 swing
- -14.6pp toward R · 2008: -6.1pp · 2024: -20.7pp
- All cycles
- 2024: R+20.7 2020: R+14.4 2016: R+14.1 2012: R+6.8 2008: R+6.1
Not yet ingested
- Civics
- —
Market trends
- HPI YoY
- ▼ -70.91%
- Current HPI
- 373.7159
- Rent YoY
- ▲ 1.05%
- Metro
- Lakeland-Winter Haven, FL
- State GDP YoY
- ▲ 3.28%
- F500 in state
- 36
Industry mix (Fortune 500 HQ in FL)
| Industry | F500 HQs | Revenue |
|---|---|---|
| Industrial Technology | 2 | $29B |
|
||
| Insurance | 2 | $17B |
|
||
| Retail | 1 | $60B |
|
||
| Technology Distribution | 1 | $58B |
|
||
| Homebuilding | 1 | $35B |
|
||
| Technology Manufacturing | 1 | $35B |
|
||
Price history
1 event — show timeline
- 2026-06-02 Listed $89,900 Stellar MLS as Distributed by MLS Grid
Property tax history
+15.0%/yrLatest (2025): $998 · +17.9% YoY. Source: county tax records.
Cash-flow waterfall
monthlySold comps — $/sqft
last 12 mo · ≤1 miLoading sold comps…