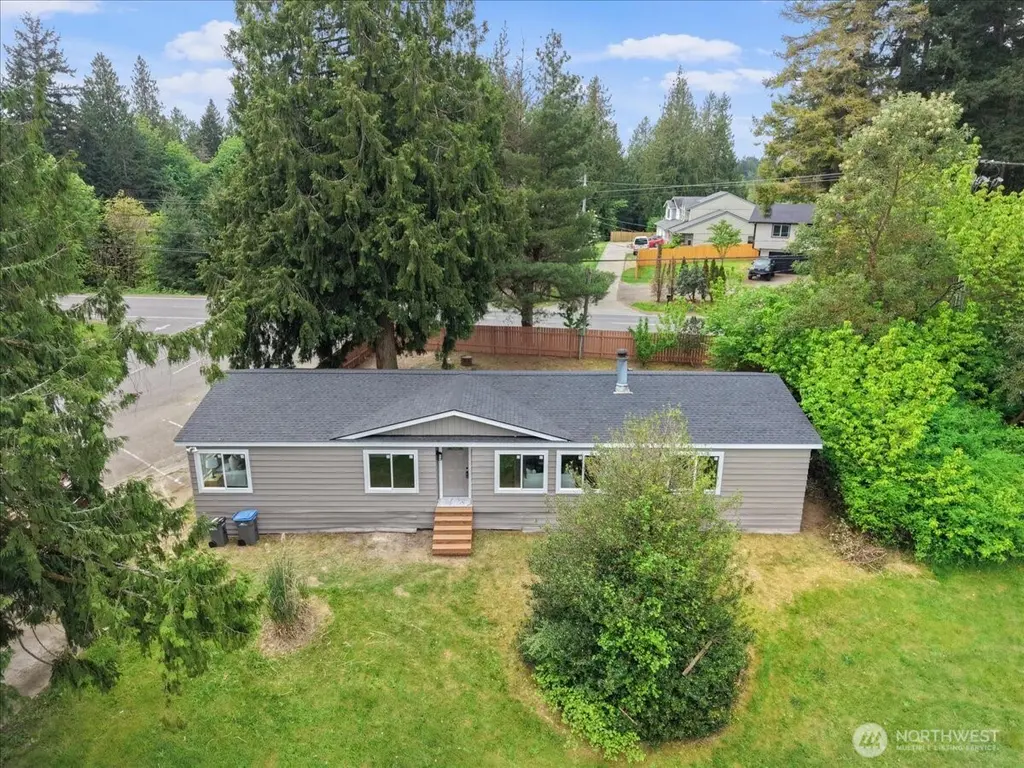
7410 Old Military Rd Unit 1A · Tracyton, WA
Flood risk 1/10 · Minimal
- FEMA flood zone
- X (unshaded)
- Chance of flooding over 30 yrs
- 0.0%
- Est. flood insurance / yr
- $507 – $1,088
Fire risk 1/10 · Minimal
- Est. fire insurance / yr
- $604 – $1,122
Heat risk 3/10 · Minor
- Hot days now (above 86°F)
- 7 days/yr
- Hot days in 30 yrs
- 15 days/yr
Wind risk 1/10 · Minimal
- Chance of severe wind over 30 yrs
- —
Air-quality risk 7/10 · Major
- Unhealthy air days now
- 9 days/yr
- Unhealthy air days in 30 yrs
- 10 days/yr
Risk factors via First Street. Map © Google.
Why this score? — see what drove the B- grade
The composite is a weighted blend of 9 inputs, each scored 0–100. Each bar is that input's sub-score; the figure is the points it added to the 100-point composite (weight × sub-score).
- Cash flow +30.0/30.0
- DSCR +10.0/10.0
- 1% rule +9.1/10.0
- Schools +5.5/10.0
- ARV discount +4.4/15.0
- Livability +3.7/5.0
- Rent growth +2.6/5.0
- Condition / age +2.5/5.0
- Appreciation +0.0/10.0
$195,000
🖨 Deal sheet (PDF) 📄 Offer letter ✓ Due diligence
Listing remarks
Fully remodeled 3 bed, 2 bath home located in the desirable Countryside Mobile Home Park at 7410 Old Military Rd #1A. This thoughtfully updated residence offers modern comfort with quality finishes throughout. Step inside to a bright, open layout featuring durable luxury vinyl plank flooring throughout and a fully renovated kitchen with updated cabinetry and contemporary finishes. The primary bathroom includes a freestanding soaking tub, creating a spa-like retreat, while both bathrooms have been tastefully refreshed with modern fixtures. Comfort is enhanced with mini-split heating and cooling systems, providing efficient year-round climate control. The home offers three well-proportioned b
Key facts
- Fully remodeled
- Renovated kitchen
- Well-positioned lot
Tags
Property features AI
Finance
- Other: Taxes listed but excluded from feature details
- Financial info: Accepted listing terms: Cash, Conventional, FHA
- HOA & community: Located in a park with 75 homes; Pet rules: see remarks; Land lease: $580
Exterior
- Parking: Uncovered parking; 2 open parking spaces
- Security: No security features listed
- Utilities: Electric energy source; Public water; Public sewer; Power provided by PSE
- Home design: Manufactured double-wide home (Fleetwood model 66/28); Updated/remodeled condition; Single-story
- Construction: Metal/Vinyl and wood construction; Composition roof; Pillar/post/pier foundation; Manufactured house (double wide)
- Exterior features: Metal/Vinyl and wood exterior; Located in Countryside Mobile Home Park (space 1A)
Interior
- Kitchen: No appliance details provided
- Bedrooms: 3 bedrooms
- Flooring: Vinyl plank flooring
- Bathrooms: 2 full bathrooms; 2 bathtubs and 2 showers
- Heating & cooling: Ductless heating; Has cooling
- Interior features: Water heater (electric) located in primary bathroom; Wood-burning fireplace
- Laundry & utility: No specific laundry appliances listed
Neighborhood map
What this means for you Summary
Snapshot
- This is a 3-bed/2.0-bath manufactured listed at $195k.
Deal economics
- At list price, monthly cash flow is $828 ($10k/yr) — positive.
- The deal already cash-flows at list — no discount required.
- Meets the 1% rule at list price ($3k rent vs $195k).
- Recommended offer: $189k (3.0% below list) — sets the bar for market timing.
- Cap rate 11.4% vs local median 3.7% in Tracyton — top-decile yield for the area; either an underpriced asset or a hidden risk that comps aren't pricing in. Stress-test before assuming the spread holds.
Location & tenants
- Location reads 73/100 on livability (#193 in WA) — a middle-class / working-renter tenant base. Strengths: employment A+, housing A+, health & safety A+; Watch: cost of living D+, amenities F, commute F.
- Central Kitsap School District (urban): math 55% / reading 67% proficiency, ranked #49 of 291 in WA (top 17%) — acceptable for families but not a draw, mixed tenant base, ~2y average lease.
- Zoned schools: Woodlands Elementary (379 students, 55% FRL); Olympic High School (1,162 students, 48% FRL) — zoned schools average 52% FRL vs 23% district-wide (29 pts higher); higher-poverty schools than district average — tighter screening recommended.
- Market conditions: Rents flat; 151 active listings in the ZIP; 3 comparable units currently listed for rent nearby; rentals at typical pace (median 22d on market — plan ~3-4 weeks tenant-placement turnaround); solid renter incomes; 1,294 units permitted in Kitsap County in 2024 (302 in 5+ unit buildings).
- This rent runs 30% of the median local income ($109k/yr) — at the standard rent-burdened threshold; future hikes will face affordability resistance.
Forward outlook
- Local home prices are declining (-3.0%/yr); year-one equity from $1k of loan paydown is wiped out by about $6k of value loss. Plan a longer hold.
- Kitsap County population projected at +8% by 2050 — modest demand growth; plan on rents tracking national, not racing it.
- At projected returns (-3.0% appreciation + 0.3% rent growth), your $55k cash investment doubles in ~9 years — after that, you're playing with house money.
Negotiation context
- It's been on market 39 days — a 3% lower offer ($189k) is reasonable based on typical stale-listing flexibility.
- 3 sale attempts since 17y ago with the ask held roughly flat each time — persistent listings suggest the price (not the market) is what's stuck; bring a comps-based counter.
- Current owner paid $35k; list at $195k implies a 457% gain — meaningful room to come down on a strong offer.
Questions for the listing agent
- It's been on market 39 days. Have you received any prior offers? Is the seller open to a 3% concession, seller financing, or rate buy-down credit?
- Is there a deadline driving the sale (1031 exchange, divorce, estate, relocation)? That informs how much negotiation room exists.
- Schools are D-rated, which usually means shorter tenancies and higher turnover. Who's the typical renter profile here, and what's been the actual vacancy rate?
- What's the average days-on-market for RENTAL listings here right now (not sales)? A rising rental-DOM trend means longer vacancies and softer asking-rent achievability than the comps imply.
- What's the recent tenant-quality profile in this submarket — average credit score on applications, eviction rate, late-payment / NSF rate, and stable-employment percentage? A property-management company in the area should have these aggregated.
- How much new for-sale + rental construction is in the pipeline within 1–3 miles? Heavy new supply typically softens prices + rents 12–24 months out; constrained supply supports both.
Investment metrics
- 1% rule
- 1.41% ✓
- Cap rate
- 11.39%
- Cash-on-cash
- 18.20%
- DSCR
- 1.81
- GRM
- 5.9
CMA / ARV
- ARV (median comp)
- $182,476
- List price
- $195,000
- Delta
- 6.86%
- Verdict
- FAIR
- Comps
- 14 within 1.0 mi
Show comp detail 9 sales within ~0.75 mi
| Address | Dist | Beds/Ba | Sqft | Sold | Price | $/sf | Match |
|---|---|---|---|---|---|---|---|
| 6638 Virgo Ln NE | 0.45mi | 3/2.0 | 1,848 (0%) | 1mo | $213,500 | $116 | 78 |
| 620 NE Saturn Ln | 0.55mi | 3/2.0 | 1,848 (0%) | 2mo | $225,000 | $122 | 72 |
| 970 NE Saturn Ln | 0.38mi | 3/2.0 | 1,680 (-9%) | 4mo | $180,000 | $107 | 64 |
| 7053 Old Military Rd NE | 0.22mi | 3/2.0 | 1,952 (+6%) | 22mo | $450,000 | $231 | 62 |
| 535 NE Saturn Ln | 0.59mi | 3/2.0 | 1,782 (-4%) | 8mo | $213,000 | $120 | 60 |
| 1027 NE Saturn Ln | 0.35mi | 4/2.0 (+1) | 1,840 (-0%) | 24mo | $179,900 | $98 | 58 |
| 830 NE Saturn Ln | 0.45mi | 3/2.0 | 1,680 (-9%) | 18mo | $180,000 | $107 | 49 |
| 704 NE Libra Ln | 0.43mi | 3/2.0 | 1,620 (-12%) | 14mo | $194,500 | $120 | 48 |
| 7075 Taurus Ln NE | 0.51mi | 3/2.0 | 1,596 (-14%) | 10mo | $185,000 | $116 | 45 |
Match score weights: distance 35% · size 25% · config 20% · recency 20%. Top-matched comps best support the ARV.
Projected returns pro-forma
-3.0% appreciation · 0.27% rent growth · sell at horizon
- IRR
- 6.7%
- Equity multiple
- 1.25×
- Total profit
- $13,824
- Equity at exit
- $29,075
- IRR
- 13.5%
- Equity multiple
- 1.94×
- Total profit
- $51,512
- Equity at exit
- $16,860
Cash invested: $54,600 (down + closing). Projections, not guarantees.
Landlord ↔ Tenant lean methodology
- Overall (STATE)
- 28 Tenant-Leaning
- State Washington
- 28 Tenant-Leaning · D+8
- County
- — inherits STATE
- City
- — inherits STATE
ZIP-level market 98311
- Rents YoY
- 0.3%
- Active inventory
- 151
- Price-to-rent
- 5.9×
Monthly cashflow live
- Estimated rent
- $2,754 medium interval (Pro) →
- Mortgage (P&I)
- −$1,023
- Tax est. 1.5%
- −$244 /mo · $2,925/yr
- Insurance
- −$81
- HOA
- −$0
- Vacancy / Maint / Mgmt
- −$578
- Net cashflow
- $828
Break-even live
Sensitivity live
| Price | -10% $963 | -5% $896 | +0% $828 | +5% $761 | +10% $693 |
|---|---|---|---|---|---|
| Rent | -10% $611 | -5% $719 | +0% $828 | +5% $937 | +10% $1,046 |
| Rate | -1.0pp $926 | -0.5pp $878 | base $828 | +0.5pp $778 | +1.0pp $726 |
UW: 25.0% down · 7.5% · 30yr · 1.5% tax · 5.0% vac · 8.0% maint · 8.0% mgmt
Financing live
Cash to close
- Down payment
- $48,750
- Closing costs
- $5,850
- Reserves months
- —
- Total cash needed
- —
Loan-product check · same deal, 3 products live
Conventional
25% down · 7.5% · 30yr
- Down + closing
- —
- Monthly P&I
- —
- Monthly cashflow
- —
- DSCR
- —
- Eligible?
- —
Personal DTI + credit; lowest rate.
DSCR
20% down · 8.5% · 30yr
- Down + closing
- —
- Monthly P&I
- —
- Monthly cashflow
- —
- DSCR
- —
- Eligible?
- —
No personal income docs; deal must DSCR.
Hard money
10% down · 12.0% · 12mo
- Down + closing
- —
- Monthly P&I
- —
- Monthly cashflow
- —
- DSCR
- —
- Eligible?
- —
Short-term bridge; refi at stabilization.
Rent comps 3 comps
| Address | Beds | Baths | Sqft | Rent | $/sqft | DOM | Units | Dist |
|---|---|---|---|---|---|---|---|---|
| 8078 Old Military Rd NE Bremerton, WA | 2.0 | 2.5 | 2064 | $3,000 | $1.45 | 45d | 1 | 0.47mi |
| 100 NE Miramar Cir Bremerton, WA | 3.0 | 2.5 | 1446 | $2,500 | $1.73 | 22d | 1 | 0.70mi |
| 6101 Washington 303 Bremerton, WA | 1.0–3.0 | 1.0–2.0 | 1010 | $2,880 | $2.85 | 14d | 70 | 0.80mi |
Listing history 20 events
-
2026-06-18days on market $195,000 Active 39 DOM
-
2026-06-17days on market $195,000 Active 38 DOM
-
2026-06-16days on market $195,000 Active 37 DOM
-
2026-06-15days on market $195,000 Active 36 DOM
-
2026-06-14days on market $195,000 Active 34 DOM
-
2026-06-13days on market $195,000 Active 33 DOM
-
2026-06-10days on market $195,000 Active 31 DOM
-
2026-06-09days on market $195,000 Active 30 DOM
-
2026-06-08days on market $195,000 Active 29 DOM
-
2026-06-07days on market $195,000 Active 28 DOM
-
2026-06-05days on market $195,000 Active 25 DOM
-
2026-06-02days on market $195,000 Active 23 DOM
-
2026-06-01days on market $195,000 Active 22 DOM
-
2026-05-31days on market $195,000 Active 21 DOM
-
2026-05-30days on market $195,000 Active 20 DOM
-
2026-05-08$195,000 Active
-
2009-11-19soldstatus $35,000 Sold
-
2009-10-29status Pending Inspection
-
2009-10-08price $44,500
-
2009-10-08$44,500,000 Active
ⓘ Source: listings_history table (triggers on properties + properties_extension) + one-shot
backfill from property_details.listing_events for pre-trigger history.
Climate risk First Street
- Flood 1/10 Low FEMA zone X (unshaded) · 0% chance over 30 yrs
- Wildfire 1/10 Low
- Heat 3/10 Moderate 7 d/yr ≥86°F today · 15 d/yr by 30 yrs out
- Wind 1/10 Low
- Air quality 7/10 Severe 9 unhealthy d/yr today · 10 by 30 yrs out
Nearby sold comps map
Loading sold comps map…
Walkable amenities ~0.75 mi
Loading nearby amenities…
Taxation est. · year 1
- Rental income
- $33,049
- − Mortgage interest
- −$10,923
- − Property taxes
- −$2,925
- − Insurance
- −$975
- − Repairs & maintenance
- −$2,644
- − Management
- −$2,644
- − Depreciation
- −$5,673
- Taxable income
- $7,266
- Est. tax owed @ 24.0%
- −$1,744
- After-tax cash flow
- $8,194/yr
For passive investors: Depreciation is non-cash, so a rental often shows a tax loss while cash-flowing — sheltering income. Rental losses are passive: they offset passive income freely, and up to $25,000/yr can offset ordinary (W-2) income if you actively participate and your MAGI is under $100k (phasing out to $0 by $150k); unused losses carry forward. On sale, claimed depreciation is recaptured at up to 25%, and gains may owe capital-gains tax (a 1031 exchange can defer both). Figures are a year-1 estimate at your 24.0% rate — not tax advice; consult a CPA.
Schools (NCES district)
- District
- Central Kitsap School District
- NCES district ID
- 5301080
- Math proficiency
- 55% ▲ 1.00%
- Reading proficiency
- 67% ▬ 0.00%
- Median HH income
- $64,825
- Composite
- 54.87/100
- National rank
- #2813
- State rank
- #49 of 291 in WA
Livability — Tracyton
- Score
- 73/100
- State rank
- #193
- US rank
- #5240
Category grades
Schools grade is shown separately in the Schools card above.
Census & demographics
- County
- Kitsap County · 243,099 people
- Metro
- Bremerton-Silverdale-Port Orchard, WA
- Population (ZIP)
- 28,168
- Household income
- $108,757
- Rent vs Own
- Severe rent burden
- 502.0
Population outlook (Kitsap County) Hauer SSP2
- Today (2025)
- 277,525 people
- By 2030
- 285,040 · +2.7%
- By 2040
- 294,957 · +6.3%
- By 2050
- 300,622 · +8.3%
- By 2075
- 315,580 · +13.7%
- By 2100
- 304,340 · +9.7%
Race, ethnicity, and origin ACS 2023
- Neighborhood character
- Predominantly White (67%)
- Race & ethnicity
- White 67% Two or more races 14% Hispanic / Latino 9% Asian 9% Black 3% Pacific Islander 2%
- Hispanic origin (detail)
- Mexican 6%
- Common ancestry
- Portuguese 4% Italian 4% Slovak 3%
- Foreign-born
- 9% · Canada, Vietnam, China
- Languages at home
- 89% English-only · Tagalog/Filipino 4% Spanish 3% Vietnamese 2%
Political lean MEDSL · Kitsap
- 2024 margin
- Strong D (+20.9) · D 58.8% · R 37.9% · Other 3.3%
- 2008→2024 swing
- +8.6pp toward D · 2008: 12.3pp · 2024: 20.9pp
- All cycles
- 2024: D+20.9 2020: D+18.1 2016: D+11.6 2012: D+11.1 2008: D+12.3
Not yet ingested
- Civics
- —
Market trends
- HPI YoY
- ▼ -378.18%
- Current HPI
- 356.6272
- Rent YoY
- ▲ 0.27%
- Metro
- Bremerton-Silverdale-Port Orchard, WA
- State GDP YoY
- ▲ 4.65%
- F500 in state
- 22
Industry mix (Fortune 500 HQ in WA)
| Industry | F500 HQs | Revenue |
|---|---|---|
| Retail | 2 | $269B |
|
||
| Technology / Retail | 1 | $638B |
|
||
| Technology | 1 | $245B |
|
||
| Telecommunications | 1 | $38B |
|
||
| Food / Beverage | 1 | $36B |
|
||
| Automotive / Trucks | 1 | $34B |
|
||
Price history
-99.6% since first listed7 events — show timeline
- 2026-05-25 Relisted — NWMLS as Distributed by MLS Grid
- 2026-05-22 Pending — NWMLS as Distributed by MLS Grid
- 2026-05-08 Listed $195,000 NWMLS as Distributed by MLS Grid
- 2009-11-19 Sold (MLS) $35,000 NWMLS as Distributed by MLS Grid
- 2009-10-29 Pending — NWMLS as Distributed by MLS Grid
- 2009-10-08 Price Changed $44,500 NWMLS as Distributed by MLS Grid
- 2009-10-08 Listed $44,500,000 NWMLS as Distributed by MLS Grid
Cash-flow waterfall
monthlySold comps — $/sqft
last 12 mo · ≤1 miLoading sold comps…