8033 Mattox Ave · Jacksonville, FL
Flood risk 1/10 · Minimal
- FEMA flood zone
- X (unshaded)
- Chance of flooding over 30 yrs
- 0.0%
- Est. flood insurance / yr
- $507 – $1,088
Fire risk 3/10 · Minor
- Est. fire insurance / yr
- $947 – $1,759
Heat risk 8/10 · Major
- Hot days now (above 107°F)
- 7 days/yr
- Hot days in 30 yrs
- 19 days/yr
Wind risk 9/10 · Severe
- Chance of severe wind over 30 yrs
- 99.0%
Air-quality risk 4/10 · Minor
- Unhealthy air days now
- 6 days/yr
- Unhealthy air days in 30 yrs
- 6 days/yr
Risk factors via First Street. Map © Google.
Why this score? — see what drove the D grade
The composite is a weighted blend of 9 inputs, each scored 0–100. Each bar is that input's sub-score; the figure is the points it added to the 100-point composite (weight × sub-score).
- Cash flow +13.5/30.0
- ARV discount +7.5/15.0
- Livability +4.2/5.0
- DSCR +4.1/10.0
- Schools +3.9/10.0
- 1% rule +2.5/10.0
- Condition / age +2.5/5.0
- Rent growth +2.4/5.0
- Appreciation +0.0/10.0
$227,990
🖨 Deal sheet (PDF) 📄 Offer letter ✓ Due diligence
Listing remarks MLS
Wooded vacant lot at 8033 Mattox Ave.
Key facts
- Built in storage
- Large island
- Walk in closet
Tags
Property features AI
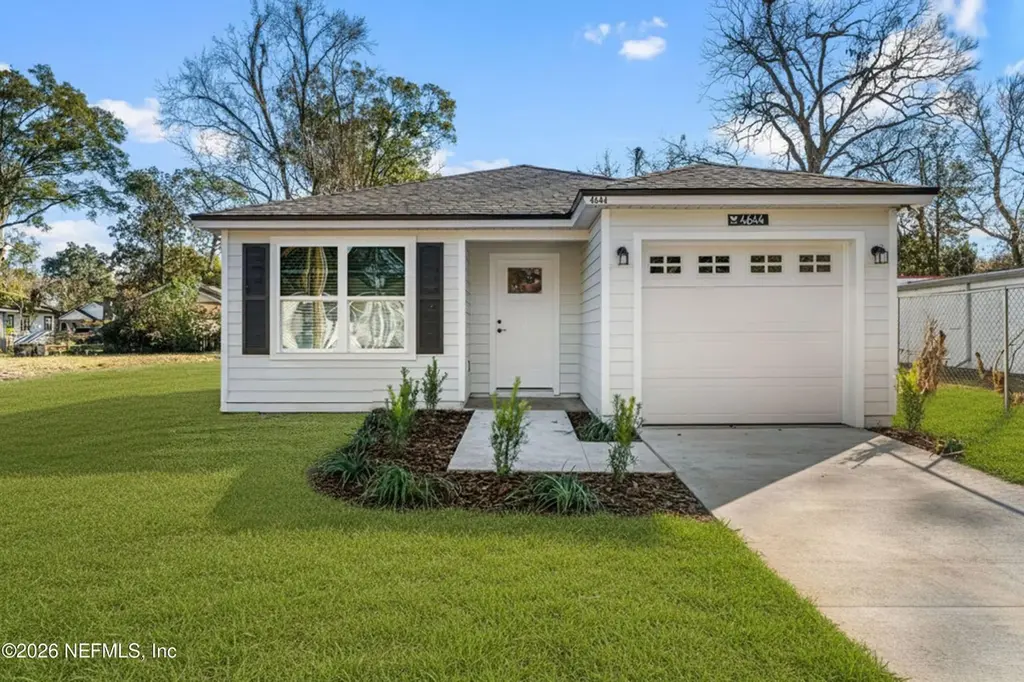
Exterior
- Parking: 1-car garage with garage door opener
- Utilities: Septic tank; Electricity connected; Water connected; Sewer connected
- Home design: Single-family home; One story
- Construction: Fiber cement construction
- Exterior features: Shingle roof; Lot approximately 0.36 acres
Interior
- Kitchen: Dishwasher; Electric range; Microwave; Refrigerator
- Bedrooms: 3 bedrooms
- Flooring: Vinyl
- Bathrooms: 2 full bathrooms
- Heating & cooling: Central heating; Central air conditioning
- Interior features: Breakfast bar; Open floorplan; Pantry; Primary bathroom with tub and shower
- Laundry & utility: In-unit laundry; Washer hookup; Electric dryer hookup
Neighborhood map
What this means for you Summary
Snapshot
- This is a 3-bed/2.0-bath land listed at $228k.
Deal economics
- At list price, monthly cash flow is $6 ($77/yr) — positive.
- The deal already cash-flows at list — no discount required.
- To meet the 1% rule (rent ≥ 1% of price), the offer needs to be $170k (25.3% below list).
- Recommended offer: $170k (25.3% below list) — sets the bar for 1% rule.
- Cap rate 6.3% vs local median 3.9% in Jacksonville — top-decile yield for the area; either an underpriced asset or a hidden risk that comps aren't pricing in. Stress-test before assuming the spread holds.
Location & tenants
- Location reads 83/100 on livability (#50 in FL, #911 nationally) — a professional / high-income tenant draw. Strengths: amenities A+, commute A+, housing A+.
- Duval (urban): math 46% / reading 45% proficiency, ranked #48 of 73 in FL (top 66%) — families likely to look elsewhere, expect single-tenant / working-renter base with shorter leases.
- Zoned schools: Grasp Academy (math 18% / reading 14%, grade F, #2,130 of 2,144 statewide, top 99%, 271 students, 52% FRL); Jean Ribault Middle School (math 28% / reading 24%, grade F, #506 of 571 statewide, top 89%, 679 students, 78% FRL); Jean Ribault High School (math 22% / reading 25%, grade F, #533 of 667 statewide, top 80%, 1,385 students, 71% FRL) — zoned schools average 67% FRL vs 49% district-wide (17 pts higher); higher-poverty schools than district average — tighter screening recommended.
- Zoned-school proficiency averages 22% at this address vs 46% district-wide (-24 pts) — the specific schools serving this property underperform the Duval average; the district grade overstates school quality for this exact location.
- Market conditions: Rents soft (-0.2%/yr); 549 active listings in the ZIP; 25 comparable units currently listed for rent nearby; rentals at typical pace (median 19d on market — plan ~3-4 weeks tenant-placement turnaround); 6,503 units permitted in Duval County in 2024 (1,131 in 5+ unit buildings).
Forward outlook
- Local home prices are declining (-3.0%/yr); year-one equity from $2k of loan paydown is wiped out by about $7k of value loss. Plan a longer hold.
- Duval County population projected at +19% by 2050 — long-run rental-demand tailwind backs the buy-and-hold thesis.
Negotiation context
- It's been on market 55 days — a 3% lower offer ($221k) is reasonable based on typical stale-listing flexibility.
- 4 sale attempts since 20y ago with the ask held roughly flat each time — persistent listings suggest the price (not the market) is what's stuck; bring a comps-based counter.
- Current owner paid $90k; list at $228k implies a 153% gain — meaningful room to come down on a strong offer.
Risks & watch-outs
- Climate carrying-cost: severe wind risk, 99% chance of damaging wind over 30y; extreme-heat days projected 7→19/yr by 2055 (HVAC capex compounding) — expect insurance premiums to compound above CPI over the hold.
Questions for the listing agent
- It's been on market 55 days. Have you received any prior offers? Is the seller open to a 25% concession, seller financing, or rate buy-down credit?
- Is there a deadline driving the sale (1031 exchange, divorce, estate, relocation)? That informs how much negotiation room exists.
- Schools are B-rated — typically a magnet for longer-tenancy family renters. What's the average tenant stay here, and is there a school-zone premium baked into asking?
- The area grade is low — what's the realistic commute time and amenity access for the typical tenant pool here? Any planned neighborhood developments (good or bad) we should know about?
- What's the average days-on-market for RENTAL listings here right now (not sales)? A rising rental-DOM trend means longer vacancies and softer asking-rent achievability than the comps imply.
- What's the recent tenant-quality profile in this submarket — average credit score on applications, eviction rate, late-payment / NSF rate, and stable-employment percentage? A property-management company in the area should have these aggregated.
- How much new for-sale + rental construction is in the pipeline within 1–3 miles? Heavy new supply typically softens prices + rents 12–24 months out; constrained supply supports both.
Investment metrics
- 1% rule
- 0.75% ✗
- Cap rate
- 6.33%
- Cash-on-cash
- 0.12%
- DSCR
- 1.01
- GRM
- 11.1
CMA / ARV
No comps found within radius.
Projected returns pro-forma
-3.0% appreciation · 0.0% rent growth · sell at horizon
- IRR
- -19.1%
- Equity multiple
- 0.35×
- Total profit
- $-41,651
- Equity at exit
- $33,994
- IRR
- -18.1%
- Equity multiple
- 0.13×
- Total profit
- $-55,529
- Equity at exit
- $19,712
Cash invested: $63,837 (down + closing). Projections, not guarantees.
Landlord ↔ Tenant lean methodology
- Overall (STATE)
- 87 Strongly Landlord-Friendly
- State Florida
- 87 Strongly Landlord-Friendly · R+3
- County
- — inherits STATE
- City
- — inherits STATE
ZIP-level market 32219
- Home prices YoY
- -22.3%
- Rents YoY
- -0.2%
- Active inventory
- 549
- Price-to-rent
- 11.1×
Monthly cashflow live
- Estimated rent
- $1,704 high interval (Pro) →
- Mortgage (P&I)
- −$1,196
- Tax from tax record
- −$49 /mo · $590/yr
- Insurance
- −$95
- HOA
- −$0
- Vacancy / Maint / Mgmt
- −$358
- Net cashflow
- $6
Break-even live
Sensitivity live
| Price | -10% $135 | -5% $71 | +0% $6 | +5% $-58 | +10% $-123 |
|---|---|---|---|---|---|
| Rent | -10% $-128 | -5% $-61 | +0% $6 | +5% $74 | +10% $141 |
| Rate | -1.0pp $121 | -0.5pp $64 | base $6 | +0.5pp $-53 | +1.0pp $-113 |
UW: 25.0% down · 7.5% · 30yr · 1.5% tax · 5.0% vac · 8.0% maint · 8.0% mgmt
Financing live
Cash to close
- Down payment
- $56,998
- Closing costs
- $6,840
- Reserves months
- —
- Total cash needed
- —
Loan-product check · same deal, 3 products live
Conventional
25% down · 7.5% · 30yr
- Down + closing
- —
- Monthly P&I
- —
- Monthly cashflow
- —
- DSCR
- —
- Eligible?
- —
Personal DTI + credit; lowest rate.
DSCR
20% down · 8.5% · 30yr
- Down + closing
- —
- Monthly P&I
- —
- Monthly cashflow
- —
- DSCR
- —
- Eligible?
- —
No personal income docs; deal must DSCR.
Hard money
10% down · 12.0% · 12mo
- Down + closing
- —
- Monthly P&I
- —
- Monthly cashflow
- —
- DSCR
- —
- Eligible?
- —
Short-term bridge; refi at stabilization.
Rent comps 25 comps
| Address | Beds | Baths | Sqft | Rent | $/sqft | DOM | Units | Dist |
|---|---|---|---|---|---|---|---|---|
| 8119 Siskin Ave Jacksonville, FL | 2.0 | 2.0 | 1102 | $1,650 | $1.50 | 25d | 1 | 0.04mi |
| 8119 Siskin Ave Jacksonville, FL | 2.0 | 2.0 | 1102 | $1,650 | $1.50 | 19d | 1 | 0.04mi |
| 8036 Mattox Ave Jacksonville, FL | 4.0 | 2.0 | 1160 | $1,480 | $1.28 | 18d | 1 | 0.06mi |
| 8367 Tubman Ct Jacksonville, FL | 4.0 | 1.5 | 1398 | $1,790 | $1.28 | 19d | 1 | 0.40mi |
| 7623 John F Kennedy Dr E Jacksonville, FL | 3.0 | 1.5 | 1008 | $1,501 | $1.49 | 25d | 1 | 0.57mi |
| 9206 Greenleaf Rd Jacksonville, FL | 3.0 | 1.5 | 888 | $1,400 | $1.58 | 19d | 1 | 0.59mi |
| 9340 Sibbald Rd Jacksonville, FL | 4.0 | 2.0 | 1228 | $1,606 | $1.31 | 5d | 1 | 0.69mi |
| 7860 Rondo Ave Jacksonville, FL | 3.0 | 2.0 | 1064 | $1,410 | $1.33 | 9d | 1 | 0.75mi |
| 6609 Miriam St Jacksonville, FL | 3.0 | 2.0 | 1200 | $1,425 | $1.19 | 9d | 1 | 0.80mi |
| 4935 Portsmouth Ave Jacksonville, FL | 3.0 | 1.0 | 894 | $1,163 | $1.30 | 12d | 1 | 0.90mi |
| 4895 Churchill Dr Jacksonville, FL | 3.0 | 2.0 | 1303 | $1,900 | $1.46 | 25d | 1 | 0.93mi |
| 9436 Gisborne Dr Jacksonville, FL | 3.0 | 1.5 | 950 | $1,440 | $1.52 | 22d | 1 | 0.95mi |
| 8645 Samona Dr W Jacksonville, FL | 4.0 | 1.0 | 1196 | $1,250 | $1.05 | 25d | 1 | 1.00mi |
| 4737 Portsmouth Ave Jacksonville, FL | 4.0 | 2.0 | 1396 | $1,148 | $0.82 | 25d | 1 | 1.09mi |
| 9348 Culpeper Ave Jacksonville, FL | 3.0 | 1.0 | 882 | $1,195 | $1.35 | 25d | 1 | 1.20mi |
| 9561 Norfolk Blvd Jacksonville, FL | 3.0 | 1.5 | 934 | $1,350 | $1.45 | 3d | 1 | 1.21mi |
| 4643 Williamsburg Ave Jacksonville, FL | 3.0 | 2.0 | 1209 | $1,496 | $1.24 | 4d | 1 | 1.21mi |
| 4662 Roanoke Blvd Jacksonville, FL | 3.0 | 2.0 | 1104 | $1,195 | $1.08 | 15d | 1 | 1.28mi |
| 8534 Addison Rd Jacksonville, FL | 4.0 | 2.0 | 1410 | $1,995 | $1.41 | 25d | 1 | 1.32mi |
| 4910 Rhode Island Dr N Jacksonville, FL | 3.0 | 2.0 | 1300 | $1,696 | $1.30 | 25d | 1 | 1.32mi |
| 4819 Arrowsmith Rd Unit 1 Jacksonville, FL | 3.0 | 2.0 | 1285 | $1,500 | $1.17 | 16d | 1 | 1.35mi |
| 8509 Addison Rd Jacksonville, FL | 4.0 | 2.0 | 1494 | $1,675 | $1.12 | 25d | 1 | 1.37mi |
| 6718 Gaspar Cir W Jacksonville, FL | 3.0 | 2.0 | 1068 | $1,305 | $1.22 | 25d | 1 | 1.39mi |
| 6705 Gaspar Cir E Jacksonville, FL | 3.0 | 1.5 | 1116 | $1,254 | $1.12 | 19d | 1 | 1.40mi |
| 4543 Moncrief Rd W Jacksonville, FL | 2.0 | 1.0 | 950 | $1,075 | $1.13 | 9d | 1 | 1.44mi |
Listing history 16 events
-
2026-06-21days on market $227,990 Active 55 DOM
-
2026-06-19status $227,990 Active 52 DOM
-
2026-06-05statusdays on market $227,990 Pending 52 DOM
-
2026-06-03days on market $227,990 Active 51 DOM
-
2026-06-02days on market $227,990 Active 50 DOM
-
2026-06-01days on market $227,990 Active 49 DOM
-
2026-05-31days on market $227,990 Active 48 DOM
-
2026-05-18price $227,990
-
2026-04-13$230,000 Active
-
2024-07-25soldstatus $90,000
-
2019-05-11historical 37-char remark
Show marketing remark (37 chars)
Wooded vacant lot at 8033 Mattox Ave.
-
2019-03-17$10,000 Active 37-char remark
Show marketing remark (37 chars)
Wooded vacant lot at 8033 Mattox Ave.
-
2007-09-10historical 176-char remark
Show marketing remark (176 chars)
Beautiful vacant lots, located in growing area of Northwest Jacksonville. Lots 7,8,29 in Lincoln Villas. Lots sizes 50x105. Survey on file. Motivated Seller. Bring all offers.
-
2007-04-10$29,900 176-char remark
Show marketing remark (176 chars)
Beautiful vacant lots, located in growing area of Northwest Jacksonville. Lots 7,8,29 in Lincoln Villas. Lots sizes 50x105. Survey on file. Motivated Seller. Bring all offers.
-
2006-09-14historical
-
2006-06-14$34,900
ⓘ Source: listings_history table (triggers on properties + properties_extension) + one-shot
backfill from property_details.listing_events for pre-trigger history.
Tax reassessment forecast FL · Resets to sale price
- Current annual tax
- $590 · $49/mo
- Projected year-2 tax
- $1,892 · $158/mo
- Expected delta
- +$1,302/yr (+$109/mo · 220.8%)
ⓘ Screening estimate from a state-policy table — verify with the county assessor before closing.
Climate risk First Street
- Flood 1/10 Low FEMA zone X (unshaded) · 0% chance over 30 yrs
- Wildfire 3/10 Moderate
- Heat 8/10 Severe 7 d/yr ≥107°F today · 19 d/yr by 30 yrs out
- Wind 9/10 Extreme 99% chance of damaging wind over 30 yrs
- Air quality 4/10 Moderate 6 unhealthy d/yr today · 6 by 30 yrs out
Nearby sold comps map
Loading sold comps map…
Walkable amenities ~0.75 mi
Loading nearby amenities…
Taxation est. · year 1
- Rental income
- $20,448
- − Mortgage interest
- −$12,771
- − Property taxes
- −$590
- − Insurance
- −$1,140
- − Repairs & maintenance
- −$1,636
- − Management
- −$1,636
- − Depreciation
- −$6,632
- Taxable loss
- −$3,957
- Est. tax savings @ 24.0%
- +$950
- After-tax cash flow
- $1,026/yr
For passive investors: Depreciation is non-cash, so a rental often shows a tax loss while cash-flowing — sheltering income. Rental losses are passive: they offset passive income freely, and up to $25,000/yr can offset ordinary (W-2) income if you actively participate and your MAGI is under $100k (phasing out to $0 by $150k); unused losses carry forward. On sale, claimed depreciation is recaptured at up to 25%, and gains may owe capital-gains tax (a 1031 exchange can defer both). Figures are a year-1 estimate at your 24.0% rate — not tax advice; consult a CPA.
Schools (NCES district)
- District
- Duval
- NCES district ID
- 1200480
- Math proficiency
- 46% ▼ -11.00%
- Reading proficiency
- 45% ▼ -4.00%
- Median HH income
- $48,987
- Composite
- 38.97/100
- National rank
- #4076
- State rank
- #48 of 73 in FL
Livability — Jacksonville
- Score
- 83/100
- State rank
- #50
- US rank
- #911
Category grades
Schools grade is shown separately in the Schools card above.
Census & demographics
- Census place
- Jacksonville, FL
- County
- Duval County · 1,015,274 people
- City population
- 979,034
- Metro
- Jacksonville, FL
- Population (ZIP)
- 14,302
- Household income
- $72,184
- Rent vs Own
- Severe rent burden
- 173.0
Population outlook (Duval County) Hauer SSP2
- Today (2025)
- 1,013,010 people
- By 2030
- 1,059,228 · +4.6%
- By 2040
- 1,141,439 · +12.7%
- By 2050
- 1,205,258 · +19.0%
- By 2075
- 1,324,282 · +30.7%
- By 2100
- 1,319,620 · +30.3%
Race, ethnicity, and origin ACS 2023
- Neighborhood character
- Majority Black (55%)
- Race & ethnicity
- Black 55% White 39% Hispanic / Latino 4% Two or more races 3%
- Common ancestry
- Italian 2% Romanian 1% Hispanic 1%
- Foreign-born
- 4% · Canada, Jamaica
- Languages at home
- 95% English-only · Spanish 3% French/Haitian/Cajun 0%
Political lean MEDSL · Duval
- 2024 margin
- Toss-up / Even · D 48.7% · R 50.1% · Other 1.2%
- 2008→2024 swing
- +0.4pp no change · 2008: -1.9pp · 2024: -1.5pp
- All cycles
- 2024: R+1.5 2020: D+3.8 2016: R+1.5 2012: R+3.6 2008: R+1.9
Not yet ingested
- Civics
- —
Market trends
- HPI YoY
- ▼ -75.90%
- Current HPI
- 263.8901
- Rent YoY
- ▼ -0.25%
- Metro
- Jacksonville, FL
- State GDP YoY
- ▲ 3.28%
- F500 in state
- 36
Industry mix (Fortune 500 HQ in FL)
| Industry | F500 HQs | Revenue |
|---|---|---|
| Industrial Technology | 2 | $29B |
|
||
| Insurance | 2 | $17B |
|
||
| Retail | 1 | $60B |
|
||
| Technology Distribution | 1 | $58B |
|
||
| Homebuilding | 1 | $35B |
|
||
| Technology Manufacturing | 1 | $35B |
|
||
Price history
+553.3% since first listed9 events — show timeline
- 2026-05-18 Price Changed $227,990 realMLS
- 2026-04-13 Listed $230,000 realMLS
- 2024-07-25 Sold (Public Records) $90,000 Public Records
- 2019-05-11 Listing Removed — realMLS
- 2019-03-17 Listed $10,000 realMLS
- 2007-09-10 Listing Removed — realMLS
- 2007-04-10 Listed $29,900 realMLS
- 2006-09-14 Listing Removed — realMLS
- 2006-06-14 Listed $34,900 realMLS
Property tax history
+8.0%/yrLatest (2025): $590 · +42.4% YoY. Source: county tax records.
Cash-flow waterfall
monthlySold comps — $/sqft
last 12 mo · ≤1 miLoading sold comps…