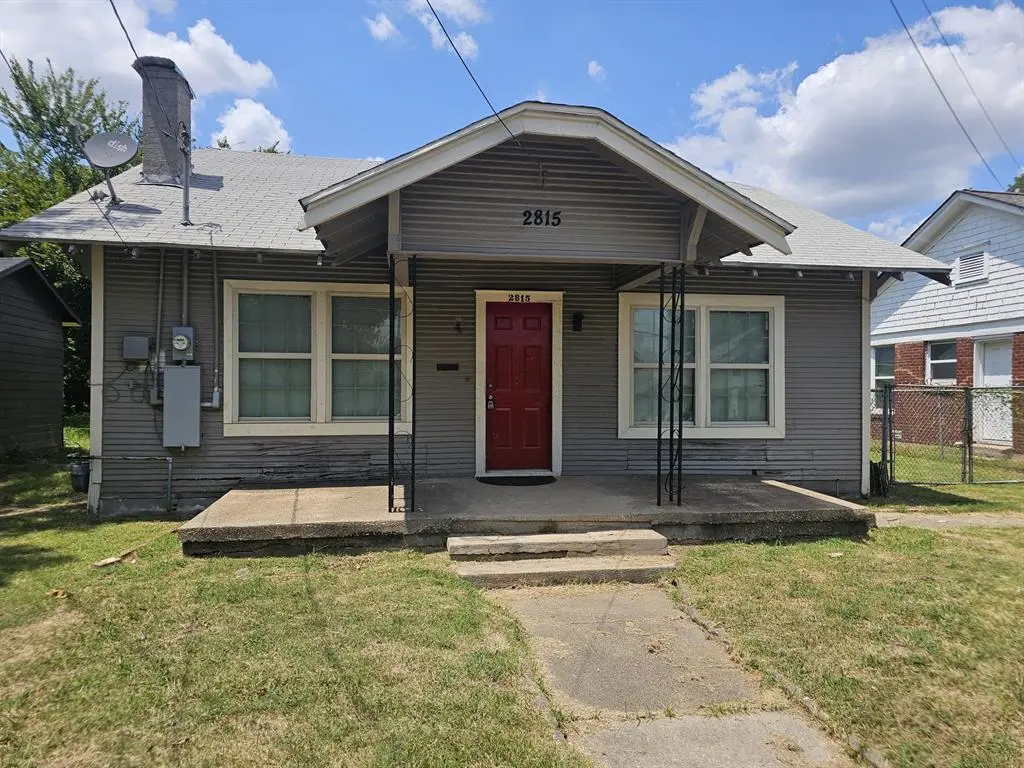
2815 Burger Ave · Dallas, TX
Flood risk 1/10 · Minimal
- FEMA flood zone
- X (unshaded)
- Chance of flooding over 30 yrs
- 0.0%
- Est. flood insurance / yr
- $507 – $1,088
Fire risk 1/10 · Minimal
- Est. fire insurance / yr
- $1,222 – $2,270
Heat risk 7/10 · Major
- Hot days now (above 110°F)
- 7 days/yr
- Hot days in 30 yrs
- 24 days/yr
Wind risk 6/10 · Moderate
- Chance of severe wind over 30 yrs
- 27.0%
Air-quality risk 3/10 · Minor
- Unhealthy air days now
- 2 days/yr
- Unhealthy air days in 30 yrs
- 3 days/yr
Risk factors via First Street. Map © Google.
Why this score? — see what drove the C+ grade
The composite is a weighted blend of 9 inputs, each scored 0–100. Each bar is that input's sub-score; the figure is the points it added to the 100-point composite (weight × sub-score).
- Cash flow +23.0/30.0
- ARV discount +8.0/15.0
- DSCR +7.4/10.0
- 1% rule +6.6/10.0
- Appreciation +5.4/10.0
- Rent growth +4.3/5.0
- Livability +4.0/5.0
- Schools +2.8/10.0
- Condition / age +2.5/5.0
$145,000
🖨 Deal sheet 📄 Offer letter ✓ Due diligence
Listing remarks MLS
Move-In Ready Home in South Dallas – Ideal for Investors or First-Time Buyers! Located in the heart of South Dallas, this property is ready for its next owner. The area is experiencing rapid growth, with new construction and revitalization projects all around. Enjoy quick access to downtown Dallas, major highways, and public transit. The home features a large backyard with space for outdoor living or future improvements. Whether you're an investor seeking a solid rental or a first-time buyer looking to build equity, this is a great opportunity in a rising neighborhood. . NO SIGN AT THE HOUSE! SOLD AS IS!! All info contained herein is deemed reliable but not guaranteed. Buyer and Buyers Agent to verify accuracy of any and all information presented herein measurements, SQFT, Taxes, schools and all other info including restrictions, etc. Neither seller nor listing agent makes any representation as to accuracy. No HOA etc.. BRING YOUR OFFERS! No survey available. All offers must be sent to [email protected] with Pre-approval letter from lender or POF. Do Not Change Title Company SOLD AS IS!!
Key facts
- New construction
- Large backyard
- Move in ready
Tags
Neighborhood map
What this means for you Summary
Snapshot
- This is a 2-bed/1.0-bath single-family listed at $145k.
Deal economics
- At list price, monthly cash flow is $257 ($3k/yr) — positive.
- The deal already cash-flows at list — no discount required.
- Meets the 1% rule at list price ($2k rent vs $145k).
- Recommended offer: $128k (12.0% below list) — sets the bar for market timing.
- Cap rate 8.4% vs local median 2.3% in Dallas — top-decile yield for the area; either an underpriced asset or a hidden risk that comps aren't pricing in. Stress-test before assuming the spread holds.
Location & tenants
- Location reads 81/100 on livability (#24 in TX, #1,380 nationally) — a professional / high-income tenant draw. Strengths: amenities A+, commute A+, housing A+; Watch: schools C-, crime F.
- Dallas ISD (urban): math 31% / reading 36% proficiency, ranked #559 of 826 in TX (top 68%) — families likely to look elsewhere, expect single-tenant / working-renter base with shorter leases; 83% free/reduced lunch — lower-income household profile, screen leases tightly.
- Market conditions: Rents rising fast (+7.2%/yr); 248 active listings in the ZIP; 40 comparable units currently listed for rent nearby; rentals at typical pace (median 15d on market — plan ~3-4 weeks tenant-placement turnaround); 12,577 units permitted in Dallas County in 2024 (6,829 in 5+ unit buildings).
- This rent runs 44% of the median local income ($46k/yr) — at the standard rent-burdened threshold; future hikes will face affordability resistance.
Forward outlook
- In year one you build about $2k of equity ($1k loan paydown + $1k appreciation (0.8% local appreciation)).
- Dallas County population projected at +35% by 2050 — long-run rental-demand tailwind backs the buy-and-hold thesis.
- At projected returns (0.8% appreciation + 7.2% rent growth), your $41k cash investment doubles in ~6 years — after that, you're playing with house money.
Negotiation context
- It's been on market 306 days — a 12% lower offer ($128k) is reasonable based on typical stale-listing flexibility.
Risks & watch-outs
- Watch-outs: built in 1925 — expect roof / HVAC / electrical / plumbing capex.
- Climate carrying-cost: major wind risk, 27% chance of damaging wind over 30y; extreme-heat days projected 7→24/yr by 2055 (HVAC capex compounding) — expect insurance premiums to compound above CPI over the hold.
Questions for the listing agent
- It's been on market 306 days. Have you received any prior offers? Is the seller open to a 12% concession, seller financing, or rate buy-down credit?
- Built in 1925 — when were the roof, HVAC, electrical panel, plumbing, and water heater last replaced?
- Why hasn't it sold? Are there any deal-killer items the seller is aware of (foundation, flood, title, zoning, code violations)?
- Is there a deadline driving the sale (1031 exchange, divorce, estate, relocation)? That informs how much negotiation room exists.
- Crime grade is F in this area — have there been break-ins, vandalism, or insurance claims at this property in the last 3 years? What carrier currently insures it and at what premium?
- What's the average days-on-market for RENTAL listings here right now (not sales)? A rising rental-DOM trend means longer vacancies and softer asking-rent achievability than the comps imply.
- What's the recent tenant-quality profile in this submarket — average credit score on applications, eviction rate, late-payment / NSF rate, and stable-employment percentage? A property-management company in the area should have these aggregated.
- How much new for-sale + rental construction is in the pipeline within 1–3 miles? Heavy new supply typically softens prices + rents 12–24 months out; constrained supply supports both.
Investment metrics
- 1% rule
- 1.16% ✓
- Cap rate
- 8.42%
- Cash-on-cash
- 7.60%
- DSCR
- 1.34
- GRM
- 7.2
CMA / ARV
- ARV (median comp)
- $146,539
- List price
- $145,000
- Delta
- -1.05%
- Verdict
- FAIR
- Comps
- 20 within 1.0 mi
Show comp detail 12 sales within ~0.75 mi
| Address | Dist | Beds/Ba | Sqft | Sold | Price | $/sf | Match |
|---|---|---|---|---|---|---|---|
| 3703 Dunbar St | 0.23mi | 2/1.0 | 978 (-3%) | 5mo | $120,000 | $123 | 80 |
| 3716 Dildock St | 0.29mi | 3/1.0 (+1) | 1,008 (0%) | 8mo | $134,900 | $134 | 75 |
| 2912 Warren Ave | 0.15mi | 2/1.5 | 1,122 (+11%) | 0mo | $125,000 | $111 | 72 |
| 2700 Tanner St | 0.11mi | 3/2.0 (+1) | 1,054 (+5%) | 8mo | $170,000 | $161 | 72 |
| 3111 Mcdermott Ave | 0.35mi | 3/2.0 (+1) | 1,043 (+4%) | 4mo | $226,000 | $217 | 66 |
| 3515 Meadow St | 0.25mi | 3/2.0 (+1) | 1,120 (+11%) | 1mo | $240,000 | $214 | 60 |
| 3626 Meyers St | 0.19mi | 3/2.0 (+1) | 1,144 (+14%) | 1mo | $167,000 | $146 | 59 |
| 2726 Carpenter Ave | 0.70mi | 3/1.0 (+1) | 1,008 (0%) | 6mo | $119,000 | $118 | 57 |
| 2332 Poplar St | 0.67mi | 3/2.0 (+1) | 1,036 (+3%) | 1mo | $249,900 | $241 | 54 |
| 3519 Frank St | 0.66mi | 2/1.0 | 924 (-8%) | 4mo | $90,000 | $97 | 52 |
| 2429 Romine Ave | 0.43mi | 2/2.0 | 864 (-14%) | 12mo | $200,000 | $231 | 42 |
| 3719 Metropolitan Ave | 0.73mi | 3/1.0 (+1) | 1,088 (+8%) | 7mo | $225,000 | $207 | 42 |
Match score weights: distance 35% · size 25% · config 20% · recency 20%. Top-matched comps best support the ARV.
Projected returns pro-forma
0.79% appreciation · 7.19% rent growth · sell at horizon
- IRR
- 11.9%
- Equity multiple
- 1.62×
- Total profit
- $25,021
- Equity at exit
- $47,916
- IRR
- 18.6%
- Equity multiple
- 3.50×
- Total profit
- $101,474
- Equity at exit
- $62,469
Cash invested: $40,600 (down + closing). Projections, not guarantees.
Landlord ↔ Tenant lean methodology
- Overall (STATE)
- 87 Strongly Landlord-Friendly
- State Texas
- 87 Strongly Landlord-Friendly · R+5
- County
- — inherits STATE
- City
- — inherits STATE
ZIP-level market 75215
- Home prices YoY
- 0.3%
- Rents YoY
- 7.2%
- Active inventory
- 248
- Price-to-rent
- 7.2×
Monthly cashflow live
- Estimated rent
- $1,675 high interval (Pro) →
- Mortgage (P&I)
- −$760
- Tax from tax record
- −$245 /mo · $2,943/yr
- Insurance
- −$60
- HOA
- −$0
- Vacancy / Maint / Mgmt
- −$352
- Net cashflow
- $257
Break-even live
UW: 25.0% down · 7.5% · 30yr · 1.5% tax · 5.0% vac · 8.0% maint · 8.0% mgmt
Financing live
Cash to close
- Down payment
- $36,250
- Closing costs
- $4,350
- Reserves months
- —
- Total cash needed
- —
Loan-product check · same deal, 3 products live
Conventional
25% down · 7.5% · 30yr
- Down + closing
- —
- Monthly P&I
- —
- Monthly cashflow
- —
- DSCR
- —
- Eligible?
- —
Personal DTI + credit; lowest rate.
DSCR
20% down · 8.5% · 30yr
- Down + closing
- —
- Monthly P&I
- —
- Monthly cashflow
- —
- DSCR
- —
- Eligible?
- —
No personal income docs; deal must DSCR.
Hard money
10% down · 12.0% · 12mo
- Down + closing
- —
- Monthly P&I
- —
- Monthly cashflow
- —
- DSCR
- —
- Eligible?
- —
Short-term bridge; refi at stabilization.
Rent comps 40 comps
| Address | Beds | Baths | Sqft | Rent | $/sqft | DOM | Units | Dist |
|---|---|---|---|---|---|---|---|---|
| 2847 Metropolitan Ave Dallas, TX | 3.0 | 1.0 | 1344 | $2,050 | $1.53 | 21d | 1 | 0.11mi |
| 3711 Guaranty St Dallas, TX | 3.0 | 1.0 | 984 | $1,800 | $1.83 | 14d | 1 | 0.20mi |
| 2822 McDermott Ave Dallas, TX | 3.0 | 2.0 | 1200 | $1,795 | $1.50 | 24d | 1 | 0.20mi |
| 3501 Latimer St Dallas, TX | 2.0 | 1.0 | 1008 | $1,095 | $1.09 | 2d | 1 | 0.33mi |
| 3927 S Malcolm X Blvd Dallas, TX | 1.0 | 1.0 | 1248 | $1,200 | $0.96 | 1d | 1 | 0.37mi |
| 3907 Roberts Ave Dallas, TX | 3.0 | 1.0 | 908 | $1,395 | $1.54 | 14d | 1 | 0.42mi |
| 4024 Myrtle St Dallas, TX | 3.0 | 2.0 | 1106 | $1,595 | $1.44 | 4d | 1 | 0.47mi |
| 3308 Birmingham Ave Unit 7 Dallas, TX | 2.0 | 2.5 | 1287 | $2,125 | $1.65 | 14d | 1 | 0.50mi |
| 3308 Birmingham Ave Unit 03 Dallas, TX | 2.0 | 2.5 | 1451 | $2,275 | $1.57 | 43d | 1 | 0.50mi |
| 3308 Birmingham Ave Unit 1 Dallas, TX | 2.0 | 2.5 | 1451 | $2,275 | $1.57 | 24d | 1 | 0.50mi |
| 3308 Birmingham Ave Unit 6 Dallas, TX | 2.0 | 2.5 | 1341 | $2,175 | $1.62 | 16d | 1 | 0.50mi |
| 3408 Spring Ave Dallas, TX | 3.0 | 2.0 | 780 | $1,340 | $1.72 | 6d | 1 | 0.68mi |
| 1723 Eugene St Unit 2 Dallas, TX | 1.0 | 1.0 | 756 | $1,250 | $1.65 | 43d | 1 | 0.75mi |
| 2714 Hector St Dallas, TX | 3.0 | 2.0 | 1233 | $2,100 | $1.70 | 24d | 1 | 0.80mi |
| 2711 Cross St Dallas, TX | 2.0 | 1.0 | 700 | $1,275 | $1.82 | 6d | 1 | 0.81mi |
| 2513 Southland St Dallas, TX | 2.0 | 1.0 | 1010 | $1,299 | $1.29 | 2d | 1 | 0.84mi |
| 2513 Southland St Dallas, TX | 2.0 | 1.0 | 1010 | $1,399 | $1.39 | 20d | 1 | 0.84mi |
| 3639 Pine St Dallas, TX | 3.0 | 2.0 | 1090 | $1,490 | $1.37 | 13d | 1 | 0.84mi |
| 2627 Elsie Faye Heggins St Dallas, TX | 3.0 | 2.0 | 876 | $1,280 | $1.46 | 43d | 1 | 0.85mi |
| 2615 Elsie Faye Heggins St Dallas, TX | 3.0 | 2.0 | 876 | $1,280 | $1.46 | 15d | 1 | 0.86mi |
| 2603 Elsie Faye Heggins St Dallas, TX | 3.0 | 2.0 | 876 | $1,385 | $1.58 | 43d | 1 | 0.86mi |
| 2563 Elsie Faye Heggins St Dallas, TX | 3.0 | 2.0 | 876 | $1,240 | $1.42 | 15d | 1 | 0.87mi |
| 2561 Elsie Faye Heggins St Dallas, TX | 3.0 | 2.0 | 876 | $1,390 | $1.59 | 6d | 1 | 0.87mi |
| 3230 Elihu St #2 Dallas, TX | 2.0 | 3.5 | 1400 | $2,300 | $1.64 | 43d | 1 | 0.87mi |
| 3230 Elihu St #5 Dallas, TX | 2.0 | 3.5 | 1400 | $2,700 | $1.93 | 43d | 1 | 0.87mi |
| 4611 Bradshaw St Dallas, TX | 3.0 | 2.0 | 1145 | $1,550 | $1.35 | 24d | 1 | 0.88mi |
| 1630 Poplar St Dallas, TX | 2.0 | 1.0 | 903 | $1,400 | $1.55 | 24d | 1 | 0.90mi |
| 1628 Poplar St Dallas, TX | 2.0 | 1.0 | 903 | $1,400 | $1.55 | 43d | 1 | 0.91mi |
| 3726 Copeland St Dallas, TX | 3.0 | 2.0 | 1298 | $1,690 | $1.30 | 6d | 1 | 0.96mi |
| 2408 Meyers St Unit 204 Dallas, TX | 2.0 | 1.0 | 700 | $770 | $1.10 | 13d | 1 | 0.98mi |
| 4722 Meadow St Dallas, TX | 2.0–3.0 | 2.0 | 1107 | $1,275 | $1.15 | 11d | 4 | 0.98mi |
| 3619 York St Dallas, TX | 3.0 | 2.0 | 1298 | $1,740 | $1.34 | 7d | 1 | 1.00mi |
| 3526 Elsie Faye Heggins St Dallas, TX | 3.0 | 2.0 | 1113 | $1,795 | $1.61 | 24d | 1 | 1.08mi |
| 3526 Elsie Faye Heggins St Dallas, TX | 3.0 | 2.0 | 1113 | $1,795 | $1.61 | 7d | 1 | 1.08mi |
| 5000 Linder Ave Dallas, TX | 3.0 | 2.0 | 1327 | $1,950 | $1.47 | 43d | 1 | 1.10mi |
| 2829 Oakdale St Dallas, TX | 3.0 | 2.0 | 1028 | $1,840 | $1.79 | 7d | 1 | 1.12mi |
| 4303 Jamaica St Dallas, TX | 3.0 | 2.0 | 1027 | $1,375 | $1.34 | 6d | 1 | 1.13mi |
| 2080 Kelly Ave Unit 109 Dallas, TX | 2.0 | 2.5 | 1164 | $2,595 | $2.23 | 43d | 1 | 1.14mi |
| 3627 Sidney St Dallas, TX | 3.0 | 2.0 | 1090 | $1,614 | $1.48 | 6d | 1 | 1.15mi |
| 2840 Oakdale St Dallas, TX | 3.0 | 2.0 | 1379 | $1,900 | $1.38 | 43d | 1 | 1.15mi |
Listing history 19 events
-
2026-06-18days on market $145,000 Active 306 DOM
-
2026-06-17days on market $145,000 Active 305 DOM
-
2026-06-16days on market $145,000 Active 304 DOM
-
2026-06-15days on market $145,000 Active 303 DOM
-
2026-06-13days on market $145,000 Active 301 DOM
-
2026-06-09days on market $145,000 Active 297 DOM
-
2026-06-08days on market $145,000 Active 296 DOM
-
2026-06-07days on market $145,000 Active 295 DOM
-
2026-06-04days on market $145,000 Active 292 DOM
-
2026-06-03days on market $145,000 Active 291 DOM
-
2026-06-02days on market $145,000 Active 290 DOM
-
2026-06-02days on market $145,000 Active 289 DOM
-
2026-05-31days on market $145,000 Active 288 DOM
-
2025-08-25price $145,000 1118-char remark
Show marketing remark (1118 chars)
Move-In Ready Home in South Dallas – Ideal for Investors or First-Time Buyers! Located in the heart of South Dallas, this property is ready for its next owner. The area is experiencing rapid growth, with new construction and revitalization projects all around. Enjoy quick access to downtown Dallas, major highways, and public transit. The home features a large backyard with space for outdoor living or future improvements. Whether you're an investor seeking a solid rental or a first-time buyer looking to build equity, this is a great opportunity in a rising neighborhood. . NO SIGN AT THE HOUSE! SOLD AS IS!! All info contained herein is deemed reliable but not guaranteed. Buyer and Buyers Agent to verify accuracy of any and all information presented herein measurements, SQFT, Taxes, schools and all other info including restrictions, etc. Neither seller nor listing agent makes any representation as to accuracy. No HOA etc.. BRING YOUR OFFERS! No survey available. All offers must be sent to [email protected] with Pre-approval letter from lender or POF. Do Not Change Title Company SOLD AS IS!!
-
2025-08-16$165,000 Active 1118-char remark
Show marketing remark (1118 chars)
Move-In Ready Home in South Dallas – Ideal for Investors or First-Time Buyers! Located in the heart of South Dallas, this property is ready for its next owner. The area is experiencing rapid growth, with new construction and revitalization projects all around. Enjoy quick access to downtown Dallas, major highways, and public transit. The home features a large backyard with space for outdoor living or future improvements. Whether you're an investor seeking a solid rental or a first-time buyer looking to build equity, this is a great opportunity in a rising neighborhood. . NO SIGN AT THE HOUSE! SOLD AS IS!! All info contained herein is deemed reliable but not guaranteed. Buyer and Buyers Agent to verify accuracy of any and all information presented herein measurements, SQFT, Taxes, schools and all other info including restrictions, etc. Neither seller nor listing agent makes any representation as to accuracy. No HOA etc.. BRING YOUR OFFERS! No survey available. All offers must be sent to [email protected] with Pre-approval letter from lender or POF. Do Not Change Title Company SOLD AS IS!!
-
2018-03-08soldstatus
-
2018-01-02soldstatus
-
2010-05-04soldstatus
-
2009-06-11soldstatus
ⓘ Source: listings_history table (triggers on properties + properties_extension) + one-shot
backfill from property_details.listing_events for pre-trigger history.
Tax reassessment forecast TX · Resets to sale price
- Current annual tax
- $2,943 · $245/mo
- Projected year-2 tax
- $2,943 · $245/mo
- Expected delta
- $0/yr ($0/mo · 0.0%)
ⓘ Screening estimate from a state-policy table — verify with the county assessor before closing.
Climate risk First Street
- Flood 1/10 Low FEMA zone X (unshaded) · 0% chance over 30 yrs
- Wildfire 1/10 Low
- Heat 7/10 Severe 7 d/yr ≥110°F today · 24 d/yr by 30 yrs out
- Wind 6/10 Major 27% chance of damaging wind over 30 yrs
- Air quality 3/10 Moderate 2 unhealthy d/yr today · 3 by 30 yrs out
Nearby sold comps map
Loading sold comps map…
Walkable amenities ~0.75 mi
Loading nearby amenities…
Taxation est. · year 1
- Rental income
- $20,099
- − Mortgage interest
- −$8,122
- − Property taxes
- −$2,943
- − Insurance
- −$725
- − Repairs & maintenance
- −$1,608
- − Management
- −$1,608
- − Depreciation
- −$4,218
- Taxable income
- $875
- Est. tax owed @ 24.0%
- −$210
- After-tax cash flow
- $2,875/yr
For passive investors: Depreciation is non-cash, so a rental often shows a tax loss while cash-flowing — sheltering income. Rental losses are passive: they offset passive income freely, and up to $25,000/yr can offset ordinary (W-2) income if you actively participate and your MAGI is under $100k (phasing out to $0 by $150k); unused losses carry forward. On sale, claimed depreciation is recaptured at up to 25%, and gains may owe capital-gains tax (a 1031 exchange can defer both). Figures are a year-1 estimate at your 24.0% rate — not tax advice; consult a CPA.
Schools (NCES district)
- District
- Dallas ISD
- NCES district ID
- 4816230
- Math proficiency
- 31% ▼ -16.00%
- Reading proficiency
- 36% ▼ -4.00%
- Median HH income
- $42,881
- Composite
- 28.41/100
- National rank
- #6763
- State rank
- #559 of 826 in TX
Livability — Dallas
- Score
- 81/100
- State rank
- #24
- US rank
- #1380
Category grades
Schools grade is shown separately in the Schools card above.
Census & demographics
- Census place
- Dallas, TX
- County
- Dallas County · 2,612,404 people
- City population
- 1,168,437
- Metro
- Dallas-Fort Worth-Arlington, TX
- Population (ZIP)
- 18,895
- Household income
- $45,557
- Rent vs Own
- Severe rent burden
- 1464.0
Population outlook (Dallas County) Hauer SSP2
- Today (2025)
- 2,979,839 people
- By 2030
- 3,191,823 · +7.1%
- By 2040
- 3,619,611 · +21.5%
- By 2050
- 4,026,915 · +35.1%
- By 2075
- 4,957,073 · +66.4%
- By 2100
- 5,508,725 · +84.9%
Race, ethnicity, and origin ACS 2023
- Neighborhood character
- Diverse neighborhood (Simpson 0.58)
- Race & ethnicity
- Black 59% Hispanic / Latino 25% White 11% Two or more races 10%
- Hispanic origin (detail)
- Mexican 21%
- Common ancestry
- Italian 1% Hispanic 1%
- Foreign-born
- 16% · Canada
- Languages at home
- 74% English-only · Spanish 26%
Political lean MEDSL · Dallas
- 2024 margin
- Strong D (+22.2) · D 60.2% · R 38.0% · Other 1.8%
- 2008→2024 swing
- +6.9pp toward D · 2008: 15.3pp · 2024: 22.2pp
- All cycles
- 2024: D+22.2 2020: D+31.6 2016: D+26.2 2012: D+15.4 2008: D+15.3
Not yet ingested
- Civics
- —
Market trends
- HPI YoY
- ▲ 0.79%
- Current HPI
- 224.2955
- Rent YoY
- ▲ 7.19%
- Metro
- Dallas-Fort Worth-Arlington, TX
- State GDP YoY
- ▲ 3.95%
- F500 in state
- 110
Industry mix (Fortune 500 HQ in TX)
| Industry | F500 HQs | Revenue |
|---|---|---|
| Energy | 16 | $1,198B |
|
||
| Technology | 5 | $198B |
|
||
| Engineering / Construction | 4 | $72B |
|
||
| Energy Services | 3 | $60B |
|
||
| Utilities | 3 | $41B |
|
||
| Healthcare | 2 | $330B |
|
||
Price history
-12.1% since first listed6 events — show timeline
- 2025-08-25 Price Changed $145,000 NTREIS
- 2025-08-16 Listed $165,000 NTREIS
- 2018-03-08 Sold (Public Records) — Public Records
- 2018-01-02 Sold (Public Records) — Public Records
- 2010-05-04 Sold (Public Records) — Public Records
- 2009-06-11 Sold (Public Records) — Public Records
Property tax history
+9.9%/yrLatest (2025): $2,943 · -1.1% YoY. Source: county tax records.
Cash-flow waterfall
monthlySold comps — $/sqft
last 12 mo · ≤1 miLoading sold comps…