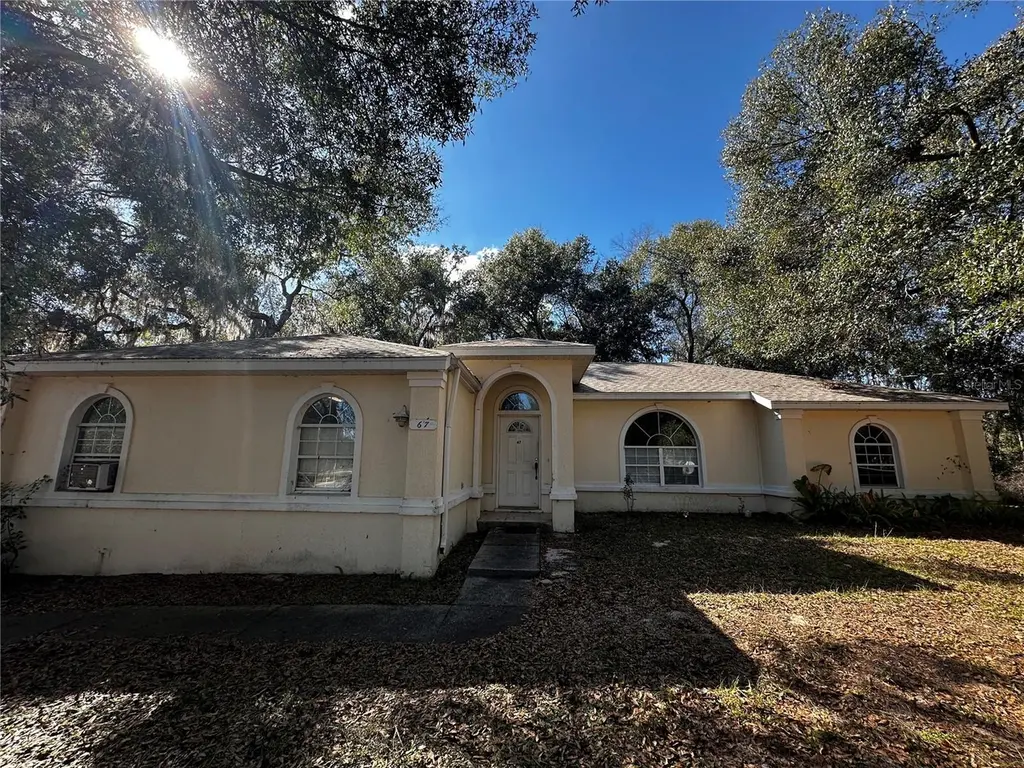
67 Larch Crse · Belleview, FL
Flood risk 1/10 · Minimal
- FEMA flood zone
- X (unshaded)
- Chance of flooding over 30 yrs
- 0.0%
- Est. flood insurance / yr
- $507 – $1,088
Fire risk 4/10 · Minor
- Est. fire insurance / yr
- $947 – $1,759
Heat risk 8/10 · Major
- Hot days now (above 108°F)
- 7 days/yr
- Hot days in 30 yrs
- 19 days/yr
Wind risk 9/10 · Severe
- Chance of severe wind over 30 yrs
- 99.0%
Air-quality risk 3/10 · Minor
- Unhealthy air days now
- 3 days/yr
- Unhealthy air days in 30 yrs
- 4 days/yr
Risk factors via First Street. Map © Google.
Why this score? — see what drove the D+ grade
The composite is a weighted blend of 9 inputs, each scored 0–100. Each bar is that input's sub-score; the figure is the points it added to the 100-point composite (weight × sub-score).
- ARV discount +15.0/15.0
- Cash flow +13.7/30.0
- DSCR +4.2/10.0
- 1% rule +4.1/10.0
- Schools +3.6/10.0
- Livability +3.5/5.0
- Rent growth +3.2/5.0
- Condition / age +2.5/5.0
- Appreciation +0.0/10.0
$200,000
🖨 Deal sheet 📄 Offer letter ✓ Due diligence
Listing remarks MLS
This home is a great opportunity for buyers or investors looking to add value. The home features a new roof installed in 2024 and is being sold as-is, with cosmetic updates needed. Enjoy a convenient location near shops, pharmacies, trails, big box stores, restaurants, and everyday essentials. A perfect chance to customize a home in a well-established area!
Key facts
- Near big box stores
- Near pharmacies
- Convenient location
Tags
Neighborhood map
What this means for you Summary
Snapshot
- This is a 3-bed/2.0-bath single-family listed at $200k.
Deal economics
- At list price, monthly cash flow is $16 ($192/yr) — positive.
- The deal already cash-flows at list — no discount required.
- To meet the 1% rule (rent ≥ 1% of price), the offer needs to be $182k (9.0% below list).
- Recommended offer: $176k (12.0% below list) — sets the bar for market timing.
- Cap rate 6.4% vs local median 4.5% in Belleview — top-decile yield for the area; either an underpriced asset or a hidden risk that comps aren't pricing in. Stress-test before assuming the spread holds.
Location & tenants
- Location reads 69/100 on livability (#458 in FL) — a middle-class / working-renter tenant base. Strengths: cost of living A+, housing A+, health & safety A+; Watch: schools D, crime F, amenities F.
- Marion (rural): math 42% / reading 43% proficiency, ranked #61 of 73 in FL (top 84%) — families likely to look elsewhere, expect single-tenant / working-renter base with shorter leases; 61% free/reduced lunch — lower-income household profile, screen leases tightly.
- Market conditions: Rents rising (+2.8%/yr); 344 active listings in the ZIP; 10 comparable units currently listed for rent nearby; rentals leasing fast (median 14d on market — plan ~1-2 weeks tenant-placement turnaround); solid renter incomes; 7,071 units permitted in Marion County in 2024 (534 in 5+ unit buildings).
Forward outlook
- Local home prices are declining (-3.0%/yr); year-one equity from $1k of loan paydown is wiped out by about $6k of value loss. Plan a longer hold.
- Marion County population projected at +13% by 2050 — modest demand growth; plan on rents tracking national, not racing it.
Negotiation context
- It's been on market 142 days — a 12% lower offer ($176k) is reasonable based on typical stale-listing flexibility.
- 2 sale attempts; this cycle's ask has dropped $20k (9%) from the opening price — seller is motivated, your offer sets the floor, not the list.
Risks & watch-outs
- Climate carrying-cost: severe wind risk, 99% chance of damaging wind over 30y; extreme-heat days projected 7→19/yr by 2055 (HVAC capex compounding) — expect insurance premiums to compound above CPI over the hold.
Questions for the listing agent
- It's been on market 142 days. Have you received any prior offers? Is the seller open to a 12% concession, seller financing, or rate buy-down credit?
- Why hasn't it sold? Are there any deal-killer items the seller is aware of (foundation, flood, title, zoning, code violations)?
- Is there a deadline driving the sale (1031 exchange, divorce, estate, relocation)? That informs how much negotiation room exists.
- Schools are D-rated, which usually means shorter tenancies and higher turnover. Who's the typical renter profile here, and what's been the actual vacancy rate?
- Crime grade is F in this area — have there been break-ins, vandalism, or insurance claims at this property in the last 3 years? What carrier currently insures it and at what premium?
- The area grade is low — what's the realistic commute time and amenity access for the typical tenant pool here? Any planned neighborhood developments (good or bad) we should know about?
- What's the average days-on-market for RENTAL listings here right now (not sales)? A rising rental-DOM trend means longer vacancies and softer asking-rent achievability than the comps imply.
- What's the recent tenant-quality profile in this submarket — average credit score on applications, eviction rate, late-payment / NSF rate, and stable-employment percentage? A property-management company in the area should have these aggregated.
- How much new for-sale + rental construction is in the pipeline within 1–3 miles? Heavy new supply typically softens prices + rents 12–24 months out; constrained supply supports both.
Investment metrics
- 1% rule
- 0.91% ✗
- Cap rate
- 6.39%
- Cash-on-cash
- 0.34%
- DSCR
- 1.02
- GRM
- 9.2
CMA / ARV
- ARV (median comp)
- $245,586
- List price
- $200,000
- Delta
- -18.56%
- Verdict
- UNDERPRICED
- Comps
- 20 within 1.0 mi
Show comp detail 12 sales within ~0.75 mi
| Address | Dist | Beds/Ba | Sqft | Sold | Price | $/sf | Match |
|---|---|---|---|---|---|---|---|
| 5434 SE 91st St | 0.38mi | 3/2.0 | 1,670 (+5%) | 4mo | $305,000 | $183 | 71 |
| 4955 SE 89th Place Rd | 0.37mi | 3/2.0 | 1,537 (-4%) | 11mo | $288,000 | $187 | 68 |
| 14 Juniper Track Dr | 0.40mi | 3/2.0 | 1,508 (-6%) | 7mo | $218,000 | $145 | 67 |
| 18 Larch Radl | 0.24mi | 3/2.0 | 1,451 (-9%) | 12mo | $272,000 | $187 | 64 |
| 5349 SE 91st Pl | 0.41mi | 3/2.0 | 1,545 (-3%) | 17mo | $290,000 | $188 | 61 |
| 8821 Juniper Rd | 0.32mi | 3/2.0 | 1,378 (-14%) | 7mo | $238,000 | $173 | 57 |
| 9053 SE 49th Ave | 0.44mi | 4/2.0 (+1) | 1,715 (+8%) | 15mo | $328,500 | $192 | 50 |
| 91 Juniper Trl | 0.57mi | 4/2.5 (+1) | 1,732 (+9%) | 4mo | $304,900 | $176 | 49 |
| 15 Juniper Trail Ln SE | 0.63mi | 3/2.0 | 1,532 (-4%) | 19mo | $302,000 | $197 | 48 |
| 12 Juniper Pass Dr | 0.49mi | 3/2.0 | 1,463 (-8%) | 20mo | $230,000 | $157 | 47 |
| 4729 SE 89th St | 0.58mi | 3/2.0 | 1,710 (+7%) | 18mo | $306,825 | $179 | 46 |
| 8977 SE 45th Ter | 0.72mi | 4/2.0 (+1) | 1,819 (+14%) | 20mo | $342,215 | $188 | 21 |
Match score weights: distance 35% · size 25% · config 20% · recency 20%. Top-matched comps best support the ARV.
Projected returns pro-forma
-3.0% appreciation · 2.84% rent growth · sell at horizon
- IRR
- -15.9%
- Equity multiple
- 0.44×
- Total profit
- $-31,630
- Equity at exit
- $29,821
- IRR
- -7.8%
- Equity multiple
- 0.51×
- Total profit
- $-27,216
- Equity at exit
- $17,292
Cash invested: $56,000 (down + closing). Projections, not guarantees.
Landlord ↔ Tenant lean methodology
- Overall (STATE)
- 87 Strongly Landlord-Friendly
- State Florida
- 87 Strongly Landlord-Friendly · R+3
- County
- — inherits STATE
- City
- — inherits STATE
ZIP-level market 34480
- Home prices YoY
- -28.7%
- Rents YoY
- 2.8%
- Active inventory
- 344
- Price-to-rent
- 9.2×
Monthly cashflow live
- Estimated rent
- $1,820 high interval (Pro) →
- Mortgage (P&I)
- −$1,049
- Tax from tax record
- −$290 /mo · $3,477/yr
- Insurance
- −$83
- HOA
- −$0
- Vacancy / Maint / Mgmt
- −$382
- Net cashflow
- $16
Break-even live
UW: 25.0% down · 7.5% · 30yr · 1.5% tax · 5.0% vac · 8.0% maint · 8.0% mgmt
Financing live
Cash to close
- Down payment
- $50,000
- Closing costs
- $6,000
- Reserves months
- —
- Total cash needed
- —
Loan-product check · same deal, 3 products live
Conventional
25% down · 7.5% · 30yr
- Down + closing
- —
- Monthly P&I
- —
- Monthly cashflow
- —
- DSCR
- —
- Eligible?
- —
Personal DTI + credit; lowest rate.
DSCR
20% down · 8.5% · 30yr
- Down + closing
- —
- Monthly P&I
- —
- Monthly cashflow
- —
- DSCR
- —
- Eligible?
- —
No personal income docs; deal must DSCR.
Hard money
10% down · 12.0% · 12mo
- Down + closing
- —
- Monthly P&I
- —
- Monthly cashflow
- —
- DSCR
- —
- Eligible?
- —
Short-term bridge; refi at stabilization.
Rent comps 10 comps
| Address | Beds | Baths | Sqft | Rent | $/sqft | DOM | Units | Dist |
|---|---|---|---|---|---|---|---|---|
| 18 Juniper Trl Ocala, FL | 3.0 | 2.0 | 1270 | $1,750 | $1.38 | 13d | 1 | 0.18mi |
| 338 Larch Rd Ocala, FL | 3.0 | 2.0 | 1394 | $1,595 | $1.14 | 21d | 1 | 0.33mi |
| 10 Juniper Trl Ocala, FL | 4.0 | 2.0 | 1617 | $1,875 | $1.16 | 13d | 1 | 0.35mi |
| 5494 SE 91st St Ocala, FL | 4.0 | 2.0 | 1858 | $2,200 | $1.18 | 13d | 1 | 0.37mi |
| 7 Juniper Pass Way Ocala, FL | 3.0 | 2.0 | 1453 | $1,750 | $1.20 | 21d | 1 | 0.41mi |
| 15 Juniper Pass Ln Ocala, FL | 4.0 | 2.0 | 1608 | $1,900 | $1.18 | 13d | 1 | 0.41mi |
| 50 Walnut Run Ocala, FL | 3.0 | 2.0 | 1287 | $1,795 | $1.39 | 13d | 1 | 0.84mi |
| 28 Juniper Dr Ocala, FL | 3.0 | 2.0 | 1453 | $1,650 | $1.14 | 21d | 1 | 0.90mi |
| 28 Poplar Run Ocala, FL | 3.0 | 2.0 | 1473 | $1,650 | $1.12 | 13d | 1 | 0.92mi |
| 123 Juniper Loop Ocala, FL | 3.0 | 2.0 | 1445 | $1,695 | $1.17 | 21d | 1 | 0.99mi |
Listing history 17 events
-
2026-06-18days on market $200,000 Active 142 DOM
-
2026-06-17days on market $200,000 Active 141 DOM
-
2026-06-16days on market $200,000 Active 140 DOM
-
2026-06-15days on market $200,000 Active 139 DOM
-
2026-06-14days on market $200,000 Active 137 DOM
-
2026-06-13days on market $200,000 Active 136 DOM
-
2026-06-10days on market $200,000 Active 134 DOM
-
2026-06-09days on market $200,000 Active 133 DOM
-
2026-06-08days on market $200,000 Active 132 DOM
-
2026-06-07days on market $200,000 Active 131 DOM
-
2026-06-03days on market $200,000 Active 127 DOM
-
2026-06-02days on market $200,000 Active 126 DOM
-
2026-05-31days on market $200,000 Active 124 DOM
-
2026-05-30days on market $200,000 Active 123 DOM
-
2026-05-06status Active 359-char remark
Show marketing remark (359 chars)
This home is a great opportunity for buyers or investors looking to add value. The home features a new roof installed in 2024 and is being sold as-is, with cosmetic updates needed. Enjoy a convenient location near shops, pharmacies, trails, big box stores, restaurants, and everyday essentials. A perfect chance to customize a home in a well-established area!
-
2026-05-01status Pending 359-char remark
Show marketing remark (359 chars)
This home is a great opportunity for buyers or investors looking to add value. The home features a new roof installed in 2024 and is being sold as-is, with cosmetic updates needed. Enjoy a convenient location near shops, pharmacies, trails, big box stores, restaurants, and everyday essentials. A perfect chance to customize a home in a well-established area!
-
2026-01-22$220,000 Active 359-char remark
Show marketing remark (359 chars)
This home is a great opportunity for buyers or investors looking to add value. The home features a new roof installed in 2024 and is being sold as-is, with cosmetic updates needed. Enjoy a convenient location near shops, pharmacies, trails, big box stores, restaurants, and everyday essentials. A perfect chance to customize a home in a well-established area!
ⓘ Source: listings_history table (triggers on properties + properties_extension) + one-shot
backfill from property_details.listing_events for pre-trigger history.
Tax reassessment forecast FL · Resets to sale price
- Current annual tax
- $3,477 · $290/mo
- Projected year-2 tax
- $3,477 · $290/mo
- Expected delta
- $0/yr ($0/mo · -0.0%)
ⓘ Screening estimate from a state-policy table — verify with the county assessor before closing.
Climate risk First Street
- Flood 1/10 Low FEMA zone X (unshaded) · 0% chance over 30 yrs
- Wildfire 4/10 Moderate
- Heat 8/10 Severe 7 d/yr ≥108°F today · 19 d/yr by 30 yrs out
- Wind 9/10 Extreme 99% chance of damaging wind over 30 yrs
- Air quality 3/10 Moderate 3 unhealthy d/yr today · 4 by 30 yrs out
Nearby sold comps map
Loading sold comps map…
Walkable amenities ~0.75 mi
Loading nearby amenities…
Taxation est. · year 1
- Rental income
- $21,841
- − Mortgage interest
- −$11,203
- − Property taxes
- −$3,477
- − Insurance
- −$1,000
- − Repairs & maintenance
- −$1,747
- − Management
- −$1,747
- − Depreciation
- −$5,818
- Taxable loss
- −$3,151
- Est. tax savings @ 24.0%
- +$756
- After-tax cash flow
- $948/yr
For passive investors: Depreciation is non-cash, so a rental often shows a tax loss while cash-flowing — sheltering income. Rental losses are passive: they offset passive income freely, and up to $25,000/yr can offset ordinary (W-2) income if you actively participate and your MAGI is under $100k (phasing out to $0 by $150k); unused losses carry forward. On sale, claimed depreciation is recaptured at up to 25%, and gains may owe capital-gains tax (a 1031 exchange can defer both). Figures are a year-1 estimate at your 24.0% rate — not tax advice; consult a CPA.
Schools (NCES district)
- District
- Marion
- NCES district ID
- 1201260
- Math proficiency
- 42% ▼ -7.00%
- Reading proficiency
- 43% ▼ -4.00%
- Median HH income
- $40,015
- Composite
- 35.61/100
- National rank
- #4890
- State rank
- #61 of 73 in FL
Livability — Belleview
- Score
- 69/100
- State rank
- #458
- US rank
- #8314
Category grades
Schools grade is shown separately in the Schools card above.
Census & demographics
- County
- Marion County · 315,796 people
- City population
- 19,167
- Metro
- Ocala, FL
- Population (ZIP)
- 23,517
- Household income
- $77,557
- Rent vs Own
- Severe rent burden
- 169.0
Population outlook (Marion County) Hauer SSP2
- Today (2025)
- 365,905 people
- By 2030
- 376,768 · +3.0%
- By 2040
- 396,555 · +8.4%
- By 2050
- 412,723 · +12.8%
- By 2075
- 446,090 · +21.9%
- By 2100
- 436,193 · +19.2%
Race, ethnicity, and origin ACS 2023
- Neighborhood character
- Predominantly White (73%)
- Race & ethnicity
- White 73% Hispanic / Latino 15% Two or more races 11% Black 6% Asian 2%
- Hispanic origin (detail)
- Mexican 3% Puerto Rican 5% Cuban 2% Dominican 2%
- Common ancestry
- Italian 3% Slovak 3% Lithuanian 2%
- Foreign-born
- 6% · Canada
- Languages at home
- 89% English-only · Spanish 9% Other Asian/Pacific 1%
Political lean MEDSL · Marion
- 2024 margin
- Solid R (+31.6) · D 33.8% · R 65.5%
- 2008→2024 swing
- -20.0pp toward R · 2008: -11.6pp · 2024: -31.6pp
- All cycles
- 2024: R+31.6 2020: R+25.9 2016: R+26.2 2012: R+16.2 2008: R+11.6
Not yet ingested
- Civics
- —
Market trends
- HPI YoY
- ▼ -85.60%
- Current HPI
- 212.4262
- Rent YoY
- ▲ 2.84%
- Metro
- Ocala, FL
- State GDP YoY
- ▲ 3.28%
- F500 in state
- 36
Industry mix (Fortune 500 HQ in FL)
| Industry | F500 HQs | Revenue |
|---|---|---|
| Industrial Technology | 2 | $29B |
|
||
| Insurance | 2 | $17B |
|
||
| Retail | 1 | $60B |
|
||
| Technology Distribution | 1 | $58B |
|
||
| Homebuilding | 1 | $35B |
|
||
| Technology Manufacturing | 1 | $35B |
|
||
Price history
3 events — show timeline
- 2026-05-06 Relisted — Stellar MLS as Distributed by MLS Grid
- 2026-05-01 Pending — Stellar MLS as Distributed by MLS Grid
- 2026-01-22 Listed $220,000 Stellar MLS as Distributed by MLS Grid
Property tax history
+8.2%/yrLatest (2025): $3,477 · +13.2% YoY. Source: county tax records.
Cash-flow waterfall
monthlySold comps — $/sqft
last 12 mo · ≤1 miLoading sold comps…