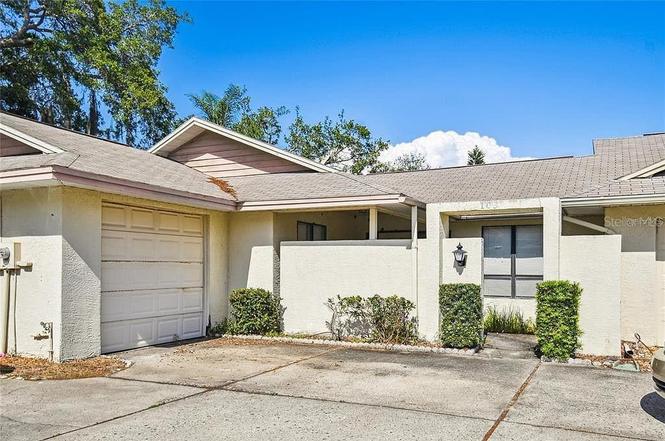
103 Lakeside Colony Dr · Tarpon Springs, FL
Flood risk 1/10 · Minimal
- FEMA flood zone
- X (unshaded)
- Chance of flooding over 30 yrs
- 0.0%
- Est. flood insurance / yr
- $507 – $1,088
Fire risk 1/10 · Minimal
- Est. fire insurance / yr
- $947 – $1,759
Heat risk 10/10 · Severe
- Hot days now (above 109°F)
- 7 days/yr
- Hot days in 30 yrs
- 27 days/yr
Wind risk 10/10 · Severe
- Chance of severe wind over 30 yrs
- 99.0%
Air-quality risk 3/10 · Minor
- Unhealthy air days now
- 3 days/yr
- Unhealthy air days in 30 yrs
- 3 days/yr
Risk factors via First Street. Map © Google.
Why this score? — see what drove the C grade
The composite is a weighted blend of 9 inputs, each scored 0–100. Each bar is that input's sub-score; the figure is the points it added to the 100-point composite (weight × sub-score).
- Cash flow +22.4/30.0
- ARV discount +7.5/15.0
- DSCR +7.2/10.0
- 1% rule +5.7/10.0
- Schools +4.3/10.0
- Livability +3.4/5.0
- Condition / age +2.5/5.0
- Rent growth +2.2/5.0
- Appreciation +0.0/10.0
$239,500
🖨 Deal sheet 📄 Offer letter ✓ Due diligence
Listing remarks
Virtually Staged. Bring your vision and unlock the potential of this hidden gem. While some cosmetic improvements may be desired, the spacious floor plan, location, and affordability make this an outstanding opportunity. You can update a home, but you can't change the price advantage this property offers.
Key facts
- 6,164 sq ft lot
- Garage
- Built 1986
Property features AI
Finance
- Other: Living area about 1,500 (per public records); Building area about 1,900 (per public records); Lot approximately 0.14 acre; Direction to property available
- Financial info: Total annual association fees approximately $2,100; Lease restrictions apply
- HOA & community: Homeowners association with required approval; Monthly HOA fee of $175; Association fee frequency: Monthly; Community mailbox, deed restrictions, street lights; Pets allowed with breed restrictions
Exterior
- Parking: Attached garage (1 car)
- Utilities: Public water; Public sewer; Electricity connected
- Home design: Residential villa; Single-story; Faces south; Fixer condition; Homestead exempt
- Construction: Stucco construction; Shingle roof; Block foundation; Built as part of Lakeside Colony
- Exterior features: Sidewalks; Asphalt road access
Interior
- Kitchen: Range; Refrigerator; Eat-in kitchen
- Bedrooms: 3 bedrooms
- Flooring: Other
- Bathrooms: 2 full bathrooms
- Heating & cooling: Central heating (electric); Central air conditioning
- Interior features: Ceiling fans; Eat-in kitchen; Vaulted ceilings; Walk-in closet(s); Living room fireplace
- Laundry & utility: In-unit laundry (washer and dryer included)
Neighborhood map
What this means for you Summary
Snapshot
- This is a 3-bed/2.0-bath condo listed at $240k.
Deal economics
- At list price, monthly cash flow is $397 ($5k/yr) — positive.
- The deal already cash-flows at list — no discount required.
- Meets the 1% rule at list price ($3k rent vs $240k).
- Cap rate 8.3% vs local median 3.4% in Tarpon Springs — top-decile yield for the area; either an underpriced asset or a hidden risk that comps aren't pricing in. Stress-test before assuming the spread holds.
Location & tenants
- Location reads 68/100 on livability (#502 in FL) — a middle-class / working-renter tenant base. Strengths: housing A+, cost of living A; Watch: employment C-, amenities F, commute F.
- Pinellas (suburban): math 51% / reading 51% proficiency, ranked #31 of 73 in FL (top 42%) — acceptable for families but not a draw, mixed tenant base, ~2y average lease.
- Zoned schools: Sunset Hills Elementary School (math 72% / reading 72%, grade A-, #288 of 2,144 statewide, top 15%, 451 students, 52% FRL); Tarpon Springs High School (math 30% / reading 47%, grade F, #321 of 667 statewide, top 49%, 1,139 students, 46% FRL) — zoned schools at 49% FRL track the district average.
- Market conditions: Rents soft (-1.2%/yr); 399 active listings in the ZIP; 18 comparable units currently listed for rent nearby; rentals at typical pace (median 15d on market — plan ~3-4 weeks tenant-placement turnaround); 2,676 units permitted in Pinellas County in 2024 (1,422 in 5+ unit buildings).
- This rent runs 41% of the median local income ($75k/yr) — at the standard rent-burdened threshold; future hikes will face affordability resistance.
Forward outlook
- Local home prices are declining (-3.0%/yr); year-one equity from $2k of loan paydown is wiped out by about $7k of value loss. Plan a longer hold.
- Pinellas County population projected at +14% by 2050 — modest demand growth; plan on rents tracking national, not racing it.
Negotiation context
- Only 7 days on market — expect competitive offers; lowballing is unlikely to land.
- 3 sale attempts since 3y ago with the ask held roughly flat each time — persistent listings suggest the price (not the market) is what's stuck; bring a comps-based counter.
- Current owner paid $80k; list at $240k implies a 198% gain — meaningful room to come down on a strong offer.
Risks & watch-outs
- Climate carrying-cost: severe wind risk, 99% chance of damaging wind over 30y; extreme-heat days projected 7→27/yr by 2055 (HVAC capex compounding) — expect insurance premiums to compound above CPI over the hold.
Questions for the listing agent
- What does the HOA fee cover, when was the last increase, and are there any pending special assessments or reserve-fund shortfalls?
- Any open or pending special assessments — roof, HVAC, plumbing, elevator, façade? What's the per-unit balance and payoff schedule, and is the seller paying it off at close or rolling it to the buyer?
- Is there a deadline driving the sale (1031 exchange, divorce, estate, relocation)? That informs how much negotiation room exists.
- Schools are A-rated — typically a magnet for longer-tenancy family renters. What's the average tenant stay here, and is there a school-zone premium baked into asking?
- What's the average days-on-market for RENTAL listings here right now (not sales)? A rising rental-DOM trend means longer vacancies and softer asking-rent achievability than the comps imply.
- What's the recent tenant-quality profile in this submarket — average credit score on applications, eviction rate, late-payment / NSF rate, and stable-employment percentage? A property-management company in the area should have these aggregated.
- How much new apartment / multifamily construction is in the pipeline within 1–3 miles? Heavy new supply (>2% of stock underway) typically softens rents 12–24 months out; light construction supports rent growth.
Investment metrics
- 1% rule
- 1.07% ✓
- Cap rate
- 8.28%
- Cash-on-cash
- 7.10%
- DSCR
- 1.32
- GRM
- 7.8
CMA / ARV
No comps found within radius.
Projected returns pro-forma
-3.0% appreciation · 0.0% rent growth · sell at horizon
- IRR
- -8.8%
- Equity multiple
- 0.69×
- Total profit
- $-21,028
- Equity at exit
- $35,710
- IRR
- -3.8%
- Equity multiple
- 0.78×
- Total profit
- $-14,742
- Equity at exit
- $20,708
Cash invested: $67,060 (down + closing). Projections, not guarantees.
Landlord ↔ Tenant lean methodology
- Overall (STATE)
- 87 Strongly Landlord-Friendly
- State Florida
- 87 Strongly Landlord-Friendly · R+3
- County
- — inherits STATE
- City
- — inherits STATE
ZIP-level market 34689
- Rents YoY
- -1.2%
- Active inventory
- 399
- Price-to-rent
- 7.8×
Monthly cashflow live
- Estimated rent
- $2,568 high interval (Pro) →
- Mortgage (P&I)
- −$1,256
- Tax from tax record
- −$101 /mo · $1,216/yr
- Insurance
- −$100
- HOA
- −$175
- Vacancy / Maint / Mgmt
- −$539
- Net cashflow
- $397
Break-even live
UW: 25.0% down · 7.5% · 30yr · 1.5% tax · 5.0% vac · 8.0% maint · 8.0% mgmt
Financing live
Cash to close
- Down payment
- $59,875
- Closing costs
- $7,185
- Reserves months
- —
- Total cash needed
- —
Loan-product check · same deal, 3 products live
Conventional
25% down · 7.5% · 30yr
- Down + closing
- —
- Monthly P&I
- —
- Monthly cashflow
- —
- DSCR
- —
- Eligible?
- —
Personal DTI + credit; lowest rate.
DSCR
20% down · 8.5% · 30yr
- Down + closing
- —
- Monthly P&I
- —
- Monthly cashflow
- —
- DSCR
- —
- Eligible?
- —
No personal income docs; deal must DSCR.
Hard money
10% down · 12.0% · 12mo
- Down + closing
- —
- Monthly P&I
- —
- Monthly cashflow
- —
- DSCR
- —
- Eligible?
- —
Short-term bridge; refi at stabilization.
Rent comps 18 comps
| Address | Beds | Baths | Sqft | Rent | $/sqft | DOM | Units | Dist |
|---|---|---|---|---|---|---|---|---|
| 504 S Florida Ave #222 Tarpon Springs, FL | 2.0 | 2.0 | 1490 | $1,895 | $1.27 | 4d | 1 | 0.14mi |
| 787 Arthurs Ct Tarpon Springs, FL | 3.0 | 2.0 | 1225 | $2,295 | $1.87 | 4d | 1 | 0.23mi |
| 1500 Sunset Rd Unit C4 Tarpon Springs, FL | 2.0 | 1.5 | 1170 | $2,100 | $1.79 | 24d | 1 | 0.29mi |
| 1417 Poinsettia Ave Unit 1244469P Tarpon Springs, FL | 4.0 | 3.0 | 2098 | $6,739 | $3.21 | 8d | 1 | 0.59mi |
| 335 Windrush Loop #335 Tarpon Springs, FL | 2.0 | 2.0 | 1565 | $3,000 | $1.92 | 24d | 1 | 0.70mi |
| 1669 Seascape Cir #1669 Tarpon Springs, FL | 2.0 | 2.0 | 1070 | $2,200 | $2.06 | 24d | 1 | 0.74mi |
| 610 Charlotte Ave Tarpon Springs, FL | 4.0 | 2.5 | 1712 | $2,710 | $1.58 | 24d | 1 | 0.89mi |
| 723 Sunset Dr Tarpon Springs, FL | 3.0 | 2.0 | 1374 | $2,290 | $1.67 | 13d | 1 | 0.94mi |
| 1805 Mariner Dr #52 Tarpon Springs, FL | 2.0 | 2.0 | 1065 | $2,000 | $1.88 | 22d | 1 | 1.01mi |
| 1806 Mariner Dr #214 Tarpon Springs, FL | 2.0 | 2.0 | 1150 | $2,100 | $1.83 | 24d | 1 | 1.06mi |
| 1701 Avoca Dr Tarpon Springs, FL | 3.0 | 2.0 | 1712 | $3,000 | $1.75 | 24d | 1 | 1.12mi |
| 1913 Whispering Way Tarpon Springs, FL | 3.0 | 2.5 | 1564 | $2,295 | $1.47 | 4d | 1 | 1.14mi |
| 1814 Mariner Dr #159 Tarpon Springs, FL | 2.0 | 2.0 | 1065 | $2,000 | $1.88 | 15d | 1 | 1.14mi |
| 1900 Whispering Way Tarpon Springs, FL | 2.0 | 2.0 | 1173 | $2,750 | $2.34 | 3d | 1 | 1.15mi |
| 1813 Mariner Dr #151 Tarpon Springs, FL | 2.0 | 2.0 | 1065 | $2,500 | $2.35 | 4d | 1 | 1.16mi |
| 211 Timberlane Dr Palm Harbor, FL | 2.0 | 1.0 | 1422 | $2,500 | $1.76 | 4d | 1 | 1.22mi |
| 1334 Belcher Dr Tarpon Springs, FL | 3.0 | 2.0 | 2055 | $3,500 | $1.70 | 2d | 1 | 1.36mi |
| 310 Westwinds Dr Palm Harbor, FL | 2.0 | 1.0 | 1196 | $2,500 | $2.09 | 18d | 1 | 1.36mi |
HOA detail condo
- Monthly dues
- $175 · $2,100/yr
- Assessments
- None detected in remarks — confirm with the listing agent.
Listing history 6 events
-
2026-06-18days on market $239,500 Active 7 DOM
-
2026-06-17days on market $239,500 Active 6 DOM
-
2026-06-16days on market $239,500 Active 5 DOM
-
2026-06-15days on market $239,500 Active 4 DOM
-
2026-06-13remarks 306-char remark
-
2026-06-13$239,500 Active 2 DOM
ⓘ Source: listings_history table (triggers on properties + properties_extension) + one-shot
backfill from property_details.listing_events for pre-trigger history.
Tax reassessment forecast FL · Resets to sale price
- Current annual tax
- $1,216 · $101/mo
- Projected year-2 tax
- $1,988 · $166/mo
- Expected delta
- +$772/yr (+$64/mo · 63.5%)
ⓘ Screening estimate from a state-policy table — verify with the county assessor before closing.
Climate risk First Street
- Flood 1/10 Low FEMA zone X (unshaded) · 0% chance over 30 yrs
- Wildfire 1/10 Low
- Heat 10/10 Extreme 7 d/yr ≥109°F today · 27 d/yr by 30 yrs out
- Wind 10/10 Extreme 99% chance of damaging wind over 30 yrs
- Air quality 3/10 Moderate 3 unhealthy d/yr today · 3 by 30 yrs out
Nearby sold comps map
Loading sold comps map…
Walkable amenities ~0.75 mi
Loading nearby amenities…
Taxation est. · year 1
- Rental income
- $30,821
- − Mortgage interest
- −$13,416
- − Property taxes
- −$1,216
- − Insurance
- −$1,198
- − Repairs & maintenance
- −$2,466
- − Management
- −$2,466
- − HOA
- −$2,100
- − Depreciation
- −$6,967
- Taxable income
- $993
- Est. tax owed @ 24.0%
- −$238
- After-tax cash flow
- $4,525/yr
For passive investors: Depreciation is non-cash, so a rental often shows a tax loss while cash-flowing — sheltering income. Rental losses are passive: they offset passive income freely, and up to $25,000/yr can offset ordinary (W-2) income if you actively participate and your MAGI is under $100k (phasing out to $0 by $150k); unused losses carry forward. On sale, claimed depreciation is recaptured at up to 25%, and gains may owe capital-gains tax (a 1031 exchange can defer both). Figures are a year-1 estimate at your 24.0% rate — not tax advice; consult a CPA.
Schools (NCES district)
- District
- Pinellas
- NCES district ID
- 1201560
- Math proficiency
- 51% ▼ -5.00%
- Reading proficiency
- 51% ▼ -3.00%
- Median HH income
- $46,270
- Composite
- 43.27/100
- National rank
- #3046
- State rank
- #31 of 73 in FL
Livability — Tarpon Springs
- Score
- 68/100
- State rank
- #502
- US rank
- #9244
Category grades
Schools grade is shown separately in the Schools card above.
Census & demographics
- Census place
- Tarpon Springs, FL
- County
- Pinellas County · 939,478 people
- City population
- 27,324
- Metro
- Tampa-St. Petersburg-Clearwater, FL
- Population (ZIP)
- 27,324
- Household income
- $74,854
- Rent vs Own
- Severe rent burden
- 721.0
Population outlook (Pinellas County) Hauer SSP2
- Today (2025)
- 1,027,532 people
- By 2030
- 1,063,586 · +3.5%
- By 2040
- 1,125,020 · +9.5%
- By 2050
- 1,168,637 · +13.7%
- By 2075
- 1,265,188 · +23.1%
- By 2100
- 1,260,357 · +22.7%
Race, ethnicity, and origin ACS 2023
- Neighborhood character
- Predominantly White (80%)
- Race & ethnicity
- White 80% Hispanic / Latino 10% Two or more races 7% Black 6%
- Hispanic origin (detail)
- Mexican 2% Puerto Rican 4%
- Common ancestry
- Romanian 6% Lithuanian 3% Slovak 2%
- Foreign-born
- 10% · Canada, Jamaica, Dominican Republic
- Languages at home
- 84% English-only · Other Indo-European 6% Spanish 6% French/Haitian/Cajun 1%
Political lean MEDSL · Pinellas
- 2024 margin
- Lean R (+5.2) · D 46.9% · R 52.1%
- 2008→2024 swing
- -13.5pp toward R · 2008: 8.3pp · 2024: -5.2pp
- All cycles
- 2024: R+5.2 2020: D+0.2 2016: R+1.1 2012: D+5.6 2008: D+8.3
Not yet ingested
- Civics
- —
Market trends
- HPI YoY
- ▼ -300.96%
- Current HPI
- 303.7434
- Rent YoY
- ▼ -1.16%
- Metro
- Tampa-St. Petersburg-Clearwater, FL
- State GDP YoY
- ▲ 3.28%
- F500 in state
- 36
Industry mix (Fortune 500 HQ in FL)
| Industry | F500 HQs | Revenue |
|---|---|---|
| Industrial Technology | 2 | $29B |
|
||
| Insurance | 2 | $17B |
|
||
| Retail | 1 | $60B |
|
||
| Technology Distribution | 1 | $58B |
|
||
| Homebuilding | 1 | $35B |
|
||
| Technology Manufacturing | 1 | $35B |
|
||
Price history
+242.1% since first listed14 events — show timeline
- 2026-06-11 Listed $239,500 Stellar MLS as Distributed by MLS Grid
- 2026-05-10 Listing Removed — Stellar MLS as Distributed by MLS Grid
- 2026-04-28 Price Changed $229,500 Stellar MLS as Distributed by MLS Grid
- 2026-03-30 Price Changed $239,500 Stellar MLS as Distributed by MLS Grid
- 2026-03-18 Price Changed $239,800 Stellar MLS as Distributed by MLS Grid
- 2026-02-16 Price Changed $239,900 Stellar MLS as Distributed by MLS Grid
- 2026-01-20 Price Changed $265,900 Stellar MLS as Distributed by MLS Grid
- 2025-12-14 Price Changed $285,000 Stellar MLS as Distributed by MLS Grid
- 2025-11-14 Listed $290,000 Stellar MLS as Distributed by MLS Grid
- 2023-05-23 Pending — Stellar MLS as Distributed by MLS Grid
- 2023-04-28 Listed $350,000 Stellar MLS as Distributed by MLS Grid
- 1998-06-12 Sold (Public Records) $80,500 Public Records
- 1989-06-30 Sold (Public Records) $182,500 Public Records
- 1986-08-26 Sold (Public Records) $70,000 Public Records
Property tax history
-4.2%/yrLatest (2025): $1,216 · +7.8% YoY. Source: county tax records.
Cash-flow waterfall
monthlySold comps — $/sqft
last 12 mo · ≤1 miLoading sold comps…