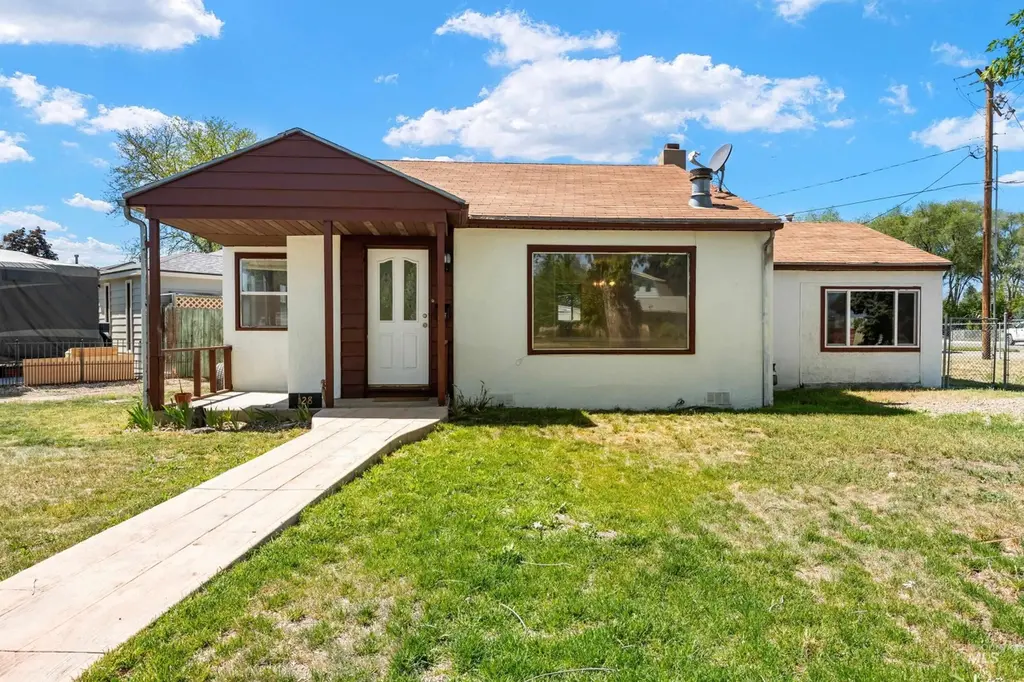
128 Mountain View Dr · Mountain Home, ID
Flood risk 1/10 · Minimal
- FEMA flood zone
- X
- Chance of flooding over 30 yrs
- 0.0%
- Est. flood insurance / yr
- $507 – $1,088
Fire risk 9/10 · Severe
- Est. fire insurance / yr
- $584 – $1,086
Heat risk 4/10 · Minor
- Hot days now (above 98°F)
- 6 days/yr
- Hot days in 30 yrs
- 15 days/yr
Wind risk 1/10 · Minimal
- Chance of severe wind over 30 yrs
- —
Air-quality risk 7/10 · Major
- Unhealthy air days now
- 11 days/yr
- Unhealthy air days in 30 yrs
- 13 days/yr
Risk factors via First Street. Map © Google.
Why this score? — see what drove the D grade
The composite is a weighted blend of 9 inputs, each scored 0–100. Each bar is that input's sub-score; the figure is the points it added to the 100-point composite (weight × sub-score).
- ARV discount +13.0/15.0
- Cash flow +10.1/30.0
- Rent growth +4.1/5.0
- Livability +3.8/5.0
- Schools +3.1/10.0
- DSCR +2.9/10.0
- Condition / age +2.5/5.0
- 1% rule +1.8/10.0
- Appreciation +0.0/10.0
$239,900
🖨 Deal sheet (PDF) 📄 Offer letter ✓ Due diligence
Listing remarks MLS
2 bdrm, 1 bath, + bonus room. Original hardwood floors. Automatic sprinkler system. All appliances. 2 sheds in backyard. Patio and mud room.
Key facts
- Hardwood flooring
- Off-street parking
- Corner lot
Tags
Property features AI
Finance
- Other:
- Financial info:
- HOA & community:
Exterior
- Parking:
- Security:
- Utilities: City water service; Sewer connected
- Home design: Single-family residence; Built in 1951
- Construction: Stucco exterior; Composition roof; Crawl space foundation
- Exterior features: Partial wood and wire fencing; Garden; Sidewalks; Manual sprinkler system; Corner lot; Chickens allowed; Storage shed
Interior
- Kitchen: Kitchen on main level (approx. 9 x 9); Dishwasher; Microwave; Refrigerator
- Bedrooms: 3 bedrooms — all on the main level (Primary ~11 x 12; Bedroom 2 ~11 x 11; Bedroom 3 ~10 x 9)
- Flooring: Hardwood; Vinyl sheet
- Bathrooms: 1 bathroom
- Heating & cooling: Forced air heating (natural gas); No central air listed
- Interior features: Great room; Laminate countertops; Master bedroom on main level; Utility room on main level (approx. 6 x 11)
- Laundry & utility: Washer and dryer included; Gas water heater
Neighborhood map
What this means for you Summary
Snapshot
- This is a 2-bed/1.0-bath single-family listed at $240k.
Deal economics
- At list price, monthly cash flow is $-142 ($-2k/yr) — negative.
- To cash-flow at today's rent, offer at most $215k (10.4% below list).
- To meet the 1% rule (rent ≥ 1% of price), the offer needs to be $163k (32.2% below list).
- Recommended offer: $163k (32.2% below list) — sets the bar for 1% rule.
- Cap rate 5.6% vs local median 3.0% in Mountain Home — top-decile yield for the area; either an underpriced asset or a hidden risk that comps aren't pricing in. Stress-test before assuming the spread holds.
Location & tenants
- Location reads 76/100 on livability (#26 in ID, #3,741 nationally) — a middle-class / working-renter tenant base. Strengths: cost of living A+, housing A+, health & safety A+; Watch: employment D, amenities F, commute F.
- Mountain Home District (town): math 28% / reading 44% proficiency, ranked #78 of 92 in ID (top 85%) — families likely to look elsewhere, expect single-tenant / working-renter base with shorter leases.
- Zoned schools: East Elementary School (math 47% / reading 57%, grade C-, #130 of 357 statewide, top 38%, 456 students, 51% FRL); Hacker Middle School (math 24% / reading 40%, grade F, #90 of 109 statewide, top 84%, 552 students, 45% FRL); Mountain Home Sr High School (math 21% / reading 44%, grade F, #117 of 169 statewide, top 70%, 960 students, 33% FRL) — zoned schools at 43% FRL track the district average.
- Market conditions: Rents rising fast (+6.2%/yr); 355 active listings in the ZIP; 129 units permitted in Elmore County in 2024 (0 in 5+ unit buildings).
- This rent runs 31% of the median local income ($64k/yr) — at the standard rent-burdened threshold; future hikes will face affordability resistance.
Forward outlook
- Local home prices are declining (-3.0%/yr); year-one equity from $2k of loan paydown is wiped out by about $7k of value loss. Plan a longer hold.
- Elmore County population projected at -35% by 2050 — secular population decline; favor cash flow + early exit over multi-decade hold.
Negotiation context
- Only 9 days on market — expect competitive offers; lowballing is unlikely to land.
- 6 sale attempts since 17y ago with the ask held roughly flat each time — persistent listings suggest the price (not the market) is what's stuck; bring a comps-based counter.
Risks & watch-outs
- Watch-outs: built in 1951 — expect roof / HVAC / electrical / plumbing capex.
- Climate carrying-cost: severe wildfire risk — expect insurance premiums to compound above CPI over the hold.
Questions for the listing agent
- What do current leases actually rent for vs. the listed asking? Can we see a recent rent roll and the last 12 months of T-12 income?
- Built in 1951 — when were the roof, HVAC, electrical panel, plumbing, and water heater last replaced?
- Is there a deadline driving the sale (1031 exchange, divorce, estate, relocation)? That informs how much negotiation room exists.
- The area grade is low — what's the realistic commute time and amenity access for the typical tenant pool here? Any planned neighborhood developments (good or bad) we should know about?
- What's the average days-on-market for RENTAL listings here right now (not sales)? A rising rental-DOM trend means longer vacancies and softer asking-rent achievability than the comps imply.
- What's the recent tenant-quality profile in this submarket — average credit score on applications, eviction rate, late-payment / NSF rate, and stable-employment percentage? A property-management company in the area should have these aggregated.
- How much new for-sale + rental construction is in the pipeline within 1–3 miles? Heavy new supply typically softens prices + rents 12–24 months out; constrained supply supports both.
Investment metrics
- 1% rule
- 0.68% ✗
- Cap rate
- 5.58%
- Cash-on-cash
- -2.53%
- DSCR
- 0.89
- GRM
- 12.3
CMA / ARV
- ARV (on-the-fly)
- $273,540
- Comps found
- 12
Show comp detail 12 sales within ~0.75 mi
| Address | Dist | Beds/Ba | Sqft | Sold | Price | $/sf | Match |
|---|---|---|---|---|---|---|---|
| 810 N 3rd E | 0.08mi | 3/1.5 (+1) | 1,106 (-5%) | 2mo | $289,900 | $262 | 79 |
| 416 N 4th West | 0.28mi | 3/1.0 (+1) | 1,166 (+0%) | 3mo | $240,000 | $206 | 79 |
| 835 N 8th E | 0.34mi | 2/2.0 | 1,150 (-1%) | 2mo | $270,000 | $235 | 77 |
| 435 N 9th East | 0.38mi | 3/1.0 (+1) | 1,200 (+3%) | 1mo | $319,000 | $266 | 72 |
| 420 Oak Ct | 0.34mi | 3/2.0 (+1) | 1,276 (+10%) | 4mo | $299,990 | $235 | 56 |
| 285 E 14th North | 0.68mi | 3/2.0 (+1) | 1,176 (+1%) | 6mo | $285,000 | $242 | 53 |
| 410 Chestnut St | 0.44mi | 3/2.0 (+1) | 1,293 (+11%) | 1mo | $255,000 | $197 | 52 |
| 125 S 12th East | 0.66mi | 2/1.0 | 1,079 (-7%) | 8mo | $129,900 | $120 | 51 |
| 1280 N 3 E | 0.62mi | 3/1.0 (+1) | 1,059 (-9%) | 8mo | $285,000 | $269 | 45 |
| 1305 N 2nd E | 0.67mi | 3/1.0 (+1) | 1,000 (-14%) | 1mo | $180,000 | $180 | 40 |
| 835 N 10th | 0.47mi | 3/2.0 (+1) | 994 (-15%) | 6mo | $192,500 | $194 | 40 |
| 945 N 11th East | 0.55mi | 3/1.5 (+1) | 1,332 (+14%) | 5mo | $250,000 | $188 | 39 |
Match score weights: distance 35% · size 25% · config 20% · recency 20%. Top-matched comps best support the ARV.
Projected returns pro-forma
-3.0% appreciation · 6.23% rent growth · sell at horizon
- IRR
- -17.5%
- Equity multiple
- 0.37×
- Total profit
- $-42,572
- Equity at exit
- $35,770
- IRR
- -5.2%
- Equity multiple
- 0.62×
- Total profit
- $-25,253
- Equity at exit
- $20,742
Cash invested: $67,172 (down + closing). Projections, not guarantees.
Landlord ↔ Tenant lean methodology
- Overall (STATE)
- 91 Strongly Landlord-Friendly
- State Idaho
- 91 Strongly Landlord-Friendly · R+18
- County
- — inherits STATE
- City
- — inherits STATE
ZIP-level market 83647
- Home prices YoY
- -31.4%
- Rents YoY
- 6.2%
- Active inventory
- 355
- Price-to-rent
- 12.3×
Monthly cashflow live
- Estimated rent
- $1,627 medium interval (Pro) →
- Mortgage (P&I)
- −$1,258
- Tax from tax record
- −$69 /mo · $827/yr
- Insurance
- −$100
- HOA
- −$0
- Vacancy / Maint / Mgmt
- −$342
- Net cashflow
- $-142
Break-even live
Sensitivity live
| Price | -10% $-6 | -5% $-74 | +0% $-142 | +5% $-210 | +10% $-278 |
|---|---|---|---|---|---|
| Rent | -10% $-270 | -5% $-206 | +0% $-142 | +5% $-78 | +10% $-13 |
| Rate | -1.0pp $-21 | -0.5pp $-81 | base $-142 | +0.5pp $-204 | +1.0pp $-267 |
UW: 25.0% down · 7.5% · 30yr · 1.5% tax · 5.0% vac · 8.0% maint · 8.0% mgmt
Financing live
Cash to close
- Down payment
- $59,975
- Closing costs
- $7,197
- Reserves months
- —
- Total cash needed
- —
Loan-product check · same deal, 3 products live
Conventional
25% down · 7.5% · 30yr
- Down + closing
- —
- Monthly P&I
- —
- Monthly cashflow
- —
- DSCR
- —
- Eligible?
- —
Personal DTI + credit; lowest rate.
DSCR
20% down · 8.5% · 30yr
- Down + closing
- —
- Monthly P&I
- —
- Monthly cashflow
- —
- DSCR
- —
- Eligible?
- —
No personal income docs; deal must DSCR.
Hard money
10% down · 12.0% · 12mo
- Down + closing
- —
- Monthly P&I
- —
- Monthly cashflow
- —
- DSCR
- —
- Eligible?
- —
Short-term bridge; refi at stabilization.
Listing history 11 events
-
2026-05-17status Pending
-
2026-05-08$239,900 Active
-
2026-01-28$250,000 Active 140-char remark
Show marketing remark (140 chars)
2 bdrm, 1 bath, + bonus room. Original hardwood floors. Automatic sprinkler system. All appliances. 2 sheds in backyard. Patio and mud room.
-
2019-02-04soldstatus Sold
-
2019-02-04soldstatus
-
2019-01-07status Pending
-
2018-12-31status Active
-
2018-12-27status Pending
-
2018-11-12$89,900 Active
-
2010-04-09$36,000
-
2009-11-27$49,900
ⓘ Source: listings_history table (triggers on properties + properties_extension) + one-shot
backfill from property_details.listing_events for pre-trigger history.
Tax reassessment forecast ID · Resets to sale price
- Current annual tax
- $827 · $69/mo
- Projected year-2 tax
- $1,655 · $138/mo
- Expected delta
- +$828/yr (+$69/mo · 100.2%)
ⓘ Screening estimate from a state-policy table — verify with the county assessor before closing.
Climate risk First Street
- Flood 1/10 Low FEMA zone X · 0% chance over 30 yrs
- Wildfire 9/10 Extreme
- Heat 4/10 Moderate 6 d/yr ≥98°F today · 15 d/yr by 30 yrs out
- Wind 1/10 Low
- Air quality 7/10 Severe 11 unhealthy d/yr today · 13 by 30 yrs out
Nearby sold comps map
Loading sold comps map…
Walkable amenities ~0.75 mi
Loading nearby amenities…
Taxation est. · year 1
- Rental income
- $19,519
- − Mortgage interest
- −$13,438
- − Property taxes
- −$827
- − Insurance
- −$1,200
- − Repairs & maintenance
- −$1,562
- − Management
- −$1,562
- − Depreciation
- −$6,979
- Taxable loss
- −$6,047
- Est. tax savings @ 24.0%
- +$1,451
- After-tax cash flow
- $-251/yr
For passive investors: Depreciation is non-cash, so a rental often shows a tax loss while cash-flowing — sheltering income. Rental losses are passive: they offset passive income freely, and up to $25,000/yr can offset ordinary (W-2) income if you actively participate and your MAGI is under $100k (phasing out to $0 by $150k); unused losses carry forward. On sale, claimed depreciation is recaptured at up to 25%, and gains may owe capital-gains tax (a 1031 exchange can defer both). Figures are a year-1 estimate at your 24.0% rate — not tax advice; consult a CPA.
Schools (NCES district)
- District
- Mountain Home District
- NCES district ID
- 1602250
- Math proficiency
- 28% ▼ -5.00%
- Reading proficiency
- 44% ▲ 1.00%
- Median HH income
- $44,262
- Composite
- 30.57/100
- National rank
- #6203
- State rank
- #78 of 92 in ID
Livability — Mountain Home
- Score
- 76/100
- State rank
- #26
- US rank
- #3741
Category grades
Schools grade is shown separately in the Schools card above.
Census & demographics
- Census place
- Mountain Home, ID
- County
- Elmore County · 22,952 people
- City population
- 22,952
- Metro
- Mountain Home, ID
- Population (ZIP)
- 22,952
- Household income
- $63,760
- Rent vs Own
- Severe rent burden
- 317.0
Population outlook (Elmore County) Hauer SSP2
- Today (2025)
- 22,644 people
- By 2030
- 21,112 · -6.8%
- By 2040
- 17,768 · -21.5%
- By 2050
- 14,629 · -35.4%
- By 2075
- 9,144 · -59.6%
- By 2100
- 6,006 · -73.5%
Race, ethnicity, and origin ACS 2023
- Neighborhood character
- Predominantly White (72%)
- Race & ethnicity
- White 72% Hispanic / Latino 18% Two or more races 13% Asian 3% Black 2% Native American 1%
- Hispanic origin (detail)
- Mexican 15%
- Common ancestry
- Portuguese 4% Lithuanian 3% Scotch-Irish 3%
- Foreign-born
- 10% · Canada
- Languages at home
- 85% English-only · Spanish 10% Russian/Polish/Slavic 2% Chinese 1%
Political lean MEDSL · Elmore
- 2024 margin
- Solid R (+48.5) · D 24.5% · R 73.0% · Other 2.5%
- 2008→2024 swing
- -12.1pp toward R · 2008: -36.4pp · 2024: -48.5pp
- All cycles
- 2024: R+48.5 2020: R+45.5 2016: R+47.0 2012: R+33.9 2008: R+36.4
Not yet ingested
- Civics
- —
Market trends
- HPI YoY
- ▼ -108.42%
- Current HPI
- 236.3087
- Rent YoY
- ▲ 6.23%
- Metro
- Mountain Home, ID
- State GDP YoY
- ▲ 4.51%
- F500 in state
- 6
Industry mix (Fortune 500 HQ in ID)
| Industry | F500 HQs | Revenue |
|---|---|---|
| Retail | 1 | $79B |
|
||
| Technology | 1 | $25B |
|
||
| Food / Agriculture | 1 | $6B |
|
||
Price history
+380.8% since first listed11 events — show timeline
- 2026-05-17 Pending — IMLS
- 2026-05-08 Listed $239,900 IMLS
- 2026-01-28 Listed $250,000 Fizber.com
- 2019-02-04 Sold (Public Records) — Public Records
- 2019-02-04 Sold (MLS) — IMLS
- 2019-01-07 Pending — IMLS
- 2018-12-31 Relisted — IMLS
- 2018-12-27 Pending — IMLS
- 2018-11-12 Listed $89,900 IMLS
- 2010-04-09 Listed $36,000 IMLS
- 2009-11-27 Listed $49,900 IMLS
Property tax history
-3.9%/yrLatest (2025): $827 · -37.2% YoY. Source: county tax records.
Cash-flow waterfall
monthlySold comps — $/sqft
last 12 mo · ≤1 miLoading sold comps…