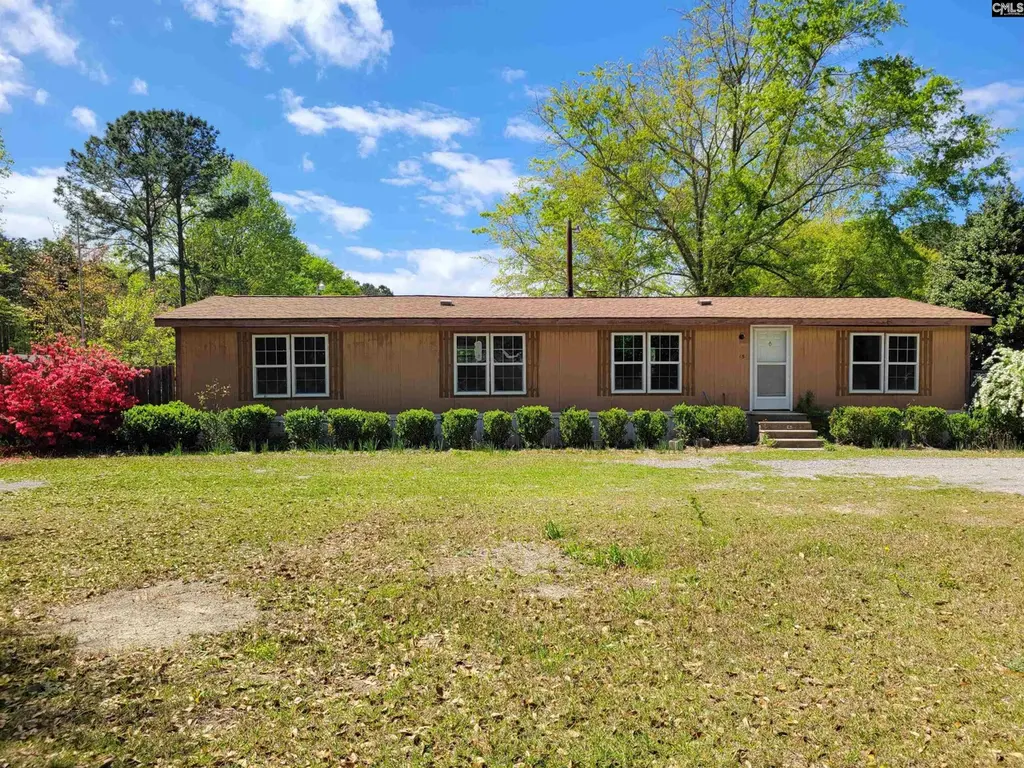
151 Sandpit Ct · Summit, SC
Flood risk 1/10 · Minimal
- FEMA flood zone
- X (unshaded)
- Chance of flooding over 30 yrs
- 0.0%
- Est. flood insurance / yr
- $507 – $1,088
Fire risk 5/10 · Moderate
- Est. fire insurance / yr
- $783 – $1,453
Heat risk 6/10 · Moderate
- Hot days now (above 108°F)
- 7 days/yr
- Hot days in 30 yrs
- 16 days/yr
Wind risk 6/10 · Moderate
- Chance of severe wind over 30 yrs
- 64.0%
Air-quality risk 3/10 · Minor
- Unhealthy air days now
- 3 days/yr
- Unhealthy air days in 30 yrs
- 3 days/yr
Risk factors via First Street. Map © Google.
Why this score? — see what drove the C- grade
The composite is a weighted blend of 9 inputs, each scored 0–100. Each bar is that input's sub-score; the figure is the points it added to the 100-point composite (weight × sub-score).
- Cash flow +15.8/30.0
- Appreciation +10.0/10.0
- ARV discount +7.5/15.0
- DSCR +4.9/10.0
- 1% rule +4.3/10.0
- Schools +4.2/10.0
- Livability +3.2/5.0
- Rent growth +2.5/5.0
- Condition / age +2.5/5.0
$189,000
🖨 Deal sheet (PDF) 📄 Offer letter ✓ Due diligence
Listing remarks
Enjoy peaceful country living on 4.2 acres in the desirable Lexington One School District (Gilbert area). This manufactured home features 3 bedrooms and 2 bathrooms and offers great potential with some TLC. to unlock its full potential- perfect as an investment property or for your family. The main bedroom flooring has been updated, new windows and the back porch was redone as well. The property includes a large carport with an enclosed shed, plus additional outbuildings—perfect for storage, hobbies, or workspace. All vehicles and trailers will be removed prior to closing. Power is currently OFF. Property is being Sold AS IS. Experience the privacy and freedom of no HOA restrictions.
Key facts
- Back porch redone
- Enclosed shed
- Large carport
Tags
Property features AI
Finance
- Other: Property sits on approximately 4.2 acres; Dirt road access
Exterior
- Utilities: Public water and well; Septic system
- Home design: Wood exterior finish; Single-story layout (main-level living)
- Construction: Crawlspace foundation
- Exterior features: Deck; Shed; Workshop; Chain link and full privacy fencing
Interior
- Kitchen: Painted cabinets; Vinyl flooring
- Bedrooms: Main-level master bedroom with double vanity, garden tub, and private bath; Main-level second bedroom with shared bath, tub/shower and box ceilings; Main-level third bedroom with shared bath
- Flooring: Vinyl flooring in kitchen
- Bathrooms: Two full bathrooms
- Heating & cooling: Central heating; Central air conditioning; Wood stove fireplace
- Interior features: Beamed great room with vaulted ceilings and a wood stove fireplace
- Laundry & utility: Main-level laundry in a heated mud room with electric hookup
Neighborhood map
What this means for you Summary
Snapshot
- This is a 3-bed/2.0-bath single-family listed at $189k.
Deal economics
- At list price, monthly cash flow is $85 ($1k/yr) — positive.
- The deal already cash-flows at list — no discount required.
- To meet the 1% rule (rent ≥ 1% of price), the offer needs to be $176k (6.8% below list).
- Recommended offer: $176k (6.8% below list) — sets the bar for 1% rule.
Location & tenants
- Location reads 65/100 on livability (#145 in SC) — a middle-class / working-renter tenant base. Strengths: cost of living A+, housing A+; Watch: crime D+, amenities F, commute F.
- Lexington 01 (suburban): math 42% / reading 53% proficiency, ranked #11 of 80 in SC (top 14%) — families likely to look elsewhere, expect single-tenant / working-renter base with shorter leases.
- Zoned schools: Gilbert Elementary (math 33% / reading 26%, grade F, #399 of 597 statewide, top 69%, 768 students, 45% FRL); Gilbert High (math 37% / reading 83%, grade C+, #109 of 196 statewide, top 55%, 1,118 students, 38% FRL).
- Market conditions: 167 active listings in the ZIP; 1,712 units permitted in Lexington County in 2024 (0 in 5+ unit buildings).
Forward outlook
- In year one you build about $20k of equity ($1k loan paydown + $19k appreciation (10.0% local appreciation)).
- Lexington County population projected at +26% by 2050 — long-run rental-demand tailwind backs the buy-and-hold thesis.
- At projected returns (10.0% appreciation + 3.0% rent growth), your $53k cash investment doubles in ~3 years — after that, you're playing with house money.
- By year 2, paydown + projected appreciation supports a ~$32k cash-out refi (75% LTV) — recoverable capital for the next deal without selling this one.
Negotiation context
- It's been on market 79 days — a 6% lower offer ($178k) is reasonable based on typical stale-listing flexibility.
- Current owner paid $64k; list at $189k implies a 195% gain — meaningful room to come down on a strong offer.
Risks & watch-outs
- Climate carrying-cost: major wind risk, 64% chance of damaging wind over 30y; moderate wildfire risk; extreme-heat days projected 7→16/yr by 2055 (HVAC capex compounding) — expect insurance premiums to compound above CPI over the hold.
Questions for the listing agent
- It's been on market 79 days. Have you received any prior offers? Is the seller open to a 7% concession, seller financing, or rate buy-down credit?
- Why hasn't it sold? Are there any deal-killer items the seller is aware of (foundation, flood, title, zoning, code violations)?
- Is there a deadline driving the sale (1031 exchange, divorce, estate, relocation)? That informs how much negotiation room exists.
- Schools are F-rated, which usually means shorter tenancies and higher turnover. Who's the typical renter profile here, and what's been the actual vacancy rate?
- Crime grade is D in this area — have there been break-ins, vandalism, or insurance claims at this property in the last 3 years? What carrier currently insures it and at what premium?
- What's the average days-on-market for RENTAL listings here right now (not sales)? A rising rental-DOM trend means longer vacancies and softer asking-rent achievability than the comps imply.
- What's the recent tenant-quality profile in this submarket — average credit score on applications, eviction rate, late-payment / NSF rate, and stable-employment percentage? A property-management company in the area should have these aggregated.
- How much new for-sale + rental construction is in the pipeline within 1–3 miles? Heavy new supply typically softens prices + rents 12–24 months out; constrained supply supports both.
Investment metrics
- 1% rule
- 0.93% ✗
- Cap rate
- 6.83%
- Cash-on-cash
- 1.92%
- DSCR
- 1.09
- GRM
- 8.9
CMA / ARV
No comps found within radius.
Projected returns pro-forma
10.0% appreciation · 3.0% rent growth · sell at horizon
- IRR
- 25.7%
- Equity multiple
- 3.05×
- Total profit
- $108,364
- Equity at exit
- $170,266
- IRR
- 22.6%
- Equity multiple
- 6.95×
- Total profit
- $314,919
- Equity at exit
- $367,185
Cash invested: $52,920 (down + closing). Projections, not guarantees.
Landlord ↔ Tenant lean methodology
- Overall (STATE)
- 90 Strongly Landlord-Friendly
- State South Carolina
- 90 Strongly Landlord-Friendly · R+6
- County
- — inherits STATE
- City
- — inherits STATE
ZIP-level market 29070
- Home prices YoY
- 3.2%
- Active inventory
- 167
- Price-to-rent
- 8.9×
Monthly cashflow live
- Estimated rent
- $1,761 medium interval (Pro) →
- Mortgage (P&I)
- −$991
- Tax est. 1.5%
- −$236 /mo · $2,835/yr
- Insurance
- −$79
- HOA
- −$0
- Vacancy / Maint / Mgmt
- −$370
- Net cashflow
- $85
Break-even live
Sensitivity live
| Price | -10% $215 | -5% $150 | +0% $85 | +5% $20 | +10% $-46 |
|---|---|---|---|---|---|
| Rent | -10% $-54 | -5% $15 | +0% $85 | +5% $154 | +10% $224 |
| Rate | -1.0pp $180 | -0.5pp $133 | base $85 | +0.5pp $36 | +1.0pp $-14 |
UW: 25.0% down · 7.5% · 30yr · 1.5% tax · 5.0% vac · 8.0% maint · 8.0% mgmt
Financing live
Cash to close
- Down payment
- $47,250
- Closing costs
- $5,670
- Reserves months
- —
- Total cash needed
- —
Loan-product check · same deal, 3 products live
Conventional
25% down · 7.5% · 30yr
- Down + closing
- —
- Monthly P&I
- —
- Monthly cashflow
- —
- DSCR
- —
- Eligible?
- —
Personal DTI + credit; lowest rate.
DSCR
20% down · 8.5% · 30yr
- Down + closing
- —
- Monthly P&I
- —
- Monthly cashflow
- —
- DSCR
- —
- Eligible?
- —
No personal income docs; deal must DSCR.
Hard money
10% down · 12.0% · 12mo
- Down + closing
- —
- Monthly P&I
- —
- Monthly cashflow
- —
- DSCR
- —
- Eligible?
- —
Short-term bridge; refi at stabilization.
Listing history 16 events
-
2026-06-18days on market $189,000 Active 79 DOM
-
2026-06-17days on market $189,000 Active 78 DOM
-
2026-06-16days on market $189,000 Active 77 DOM
-
2026-06-15days on market $189,000 Active 76 DOM
-
2026-06-14pricedays on market $189,000 Active 74 DOM
-
2026-06-10days on market $190,000 Active 71 DOM
-
2026-06-09days on market $190,000 Active 70 DOM
-
2026-06-08days on market $190,000 Active 69 DOM
-
2026-06-07days on market $190,000 Active 68 DOM
-
2026-06-03days on market $190,000 Active 64 DOM
-
2026-06-03days on market $190,000 Active 63 DOM
-
2026-06-02days on market $190,000 Active 62 DOM
-
2026-05-31days on market $190,000 Active 61 DOM
-
2026-05-21price $190,000
-
2026-03-31$195,000 Active
-
2014-04-01soldstatus $64,000
ⓘ Source: listings_history table (triggers on properties + properties_extension) + one-shot
backfill from property_details.listing_events for pre-trigger history.
Climate risk First Street
- Flood 1/10 Low FEMA zone X (unshaded) · 0% chance over 30 yrs
- Wildfire 5/10 Major
- Heat 6/10 Major 7 d/yr ≥108°F today · 16 d/yr by 30 yrs out
- Wind 6/10 Major 64% chance of damaging wind over 30 yrs
- Air quality 3/10 Moderate 3 unhealthy d/yr today · 3 by 30 yrs out
Nearby sold comps map
Loading sold comps map…
Walkable amenities ~0.75 mi
Loading nearby amenities…
Taxation est. · year 1
- Rental income
- $21,129
- − Mortgage interest
- −$10,587
- − Property taxes
- −$2,835
- − Insurance
- −$945
- − Repairs & maintenance
- −$1,690
- − Management
- −$1,690
- − Depreciation
- −$5,498
- Taxable loss
- −$2,117
- Est. tax savings @ 24.0%
- +$508
- After-tax cash flow
- $1,526/yr
For passive investors: Depreciation is non-cash, so a rental often shows a tax loss while cash-flowing — sheltering income. Rental losses are passive: they offset passive income freely, and up to $25,000/yr can offset ordinary (W-2) income if you actively participate and your MAGI is under $100k (phasing out to $0 by $150k); unused losses carry forward. On sale, claimed depreciation is recaptured at up to 25%, and gains may owe capital-gains tax (a 1031 exchange can defer both). Figures are a year-1 estimate at your 24.0% rate — not tax advice; consult a CPA.
Schools (NCES district)
- District
- Lexington 01
- NCES district ID
- 4502700
- Math proficiency
- 42% ▼ -12.00%
- Reading proficiency
- 53% ▼ -2.00%
- Median HH income
- $61,298
- Composite
- 41.75/100
- National rank
- #3399
- State rank
- #11 of 80 in SC
Livability — Summit
- Score
- 65/100
- State rank
- #145
- US rank
- #13523
Category grades
Schools grade is shown separately in the Schools card above.
Census & demographics
- Population (ZIP)
- 15,528
Population outlook (Lexington County) Hauer SSP2
- Today (2025)
- 322,999 people
- By 2030
- 342,356 · +6.0%
- By 2040
- 377,715 · +16.9%
- By 2050
- 406,984 · +26.0%
- By 2075
- 465,447 · +44.1%
- By 2100
- 485,674 · +50.4%
Race, ethnicity, and origin ACS 2023
- Neighborhood character
- Predominantly White (76%)
- Race & ethnicity
- White 76% Black 12% Hispanic / Latino 7% Two or more races 6%
- Hispanic origin (detail)
- Mexican 5%
- Common ancestry
- Lithuanian 1% Slovak 1% Italian 1%
- Foreign-born
- 4% · Canada
- Languages at home
- 92% English-only · Spanish 6% Other Indo-European 1%
Political lean MEDSL · Lexington
- 2024 margin
- Solid R (+33.5) · D 32.5% · R 66.0% · Other 1.4%
- 2008→2024 swing
- +4.6pp toward D · 2008: -38.0pp · 2024: -33.5pp
- All cycles
- 2024: R+33.5 2020: R+30.1 2016: R+36.7 2012: R+37.8 2008: R+38.0
Not yet ingested
- Civics
- —
Market trends
- HPI YoY
- ▲ 13.72%
- Current HPI
- 439.77
- Rent YoY
- —
- Metro
- —
- State GDP YoY
- ▲ 4.51%
- F500 in state
- 2
Industry mix (Fortune 500 HQ in SC)
| Industry | F500 HQs | Revenue |
|---|---|---|
| Packaging | 1 | $7B |
|
||
Price history
+196.9% since first listed3 events — show timeline
- 2026-05-21 Price Changed $190,000 Consolidated MLS
- 2026-03-31 Listed $195,000 Consolidated MLS
- 2014-04-01 Sold (Public Records) $64,000 Public Records
Property tax history
-15.6%/yrLatest (2024): $154 · +108.7% YoY. Source: county tax records.
Cash-flow waterfall
monthlySold comps — $/sqft
last 12 mo · ≤1 miLoading sold comps…