 Multi-family
615 S 44th St · Louisville, KY
Flood risk 1/10 · Minimal
- FEMA flood zone
- X (shaded)
- Chance of flooding over 30 yrs
- 0.0%
- Est. flood insurance / yr
- $473 – $860
Fire risk 1/10 · Minimal
- Est. fire insurance / yr
- $839 – $1,559
Heat risk 5/10 · Moderate
- Hot days now (above 104°F)
- 7 days/yr
- Hot days in 30 yrs
- 20 days/yr
Wind risk 2/10 · Minimal
- Chance of severe wind over 30 yrs
- 2.0%
Air-quality risk 2/10 · Minimal
- Unhealthy air days now
- 1 days/yr
- Unhealthy air days in 30 yrs
- 2 days/yr
Risk factors via First Street. Map © Google.
Why this score? — see what drove the B- grade
The composite is a weighted blend of 9 inputs, each scored 0–100. Each bar is that input's sub-score; the figure is the points it added to the 100-point composite (weight × sub-score).
- Cash flow +28.7/30.0
- DSCR +10.0/10.0
- 1% rule +7.9/10.0
- ARV discount +7.5/15.0
- Condition / age +4.0/5.0
- Rent growth +3.7/5.0
- Livability +3.2/5.0
- Schools +2.3/10.0
- Appreciation +0.0/10.0
$3,095,000
🖨 Deal sheet (PDF) 📄 Offer letter ✓ Due diligence
Multi-family units
County records classify this as Multi-Family (5+ Unit). Listing-text estimate: 1 unit. estimate disagrees with records
5+ unit building — per-unit beds/baths from public records are typically unavailable; the breakdown below (if shown) is an estimate from the listing text.
Listing remarks
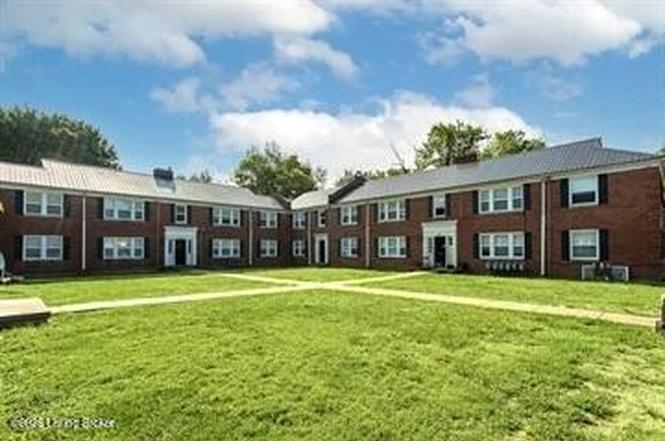
This offering includes 607, 627, and 649 S. 44th St. This 48 unit workforce housing opportunity is located in Louisville's Shawnee neighborhood. The all-brick buildings are just one block from Shawnee Park and are situated in the midst of a dense single family residential neighborhood. The property is well maintained and has undergone improvements over the past several years that include unit turns, new roofs and many windows. It is separately metered for gas and electric, so there is limited landlord utility exposure.
Key facts
- Improvements
- New roofs
- All-brick buildings
Tags
Property features AI
Finance
- Other: Lot dimensions approximately 211 x 180 (about 2.11 acres)
- HOA & community: No association fee
Exterior
- Parking: No covered parking
- Utilities: Electricity connected; Natural gas available
- Home design: Apartment property type; Subdivision: DOERHOEFERS
- Construction: Built in 1949; Brick construction; Asphalt roof; Building area reported as 42,686 total (source: Other)
- Exterior features: No exterior features listed
Interior
- Bedrooms: No bedrooms (studio or non-residential unit count listed as 0)
- Heating & cooling: Heating present
- Interior features: No basement; Separate meters for units
Neighborhood map
What this means for you Summary
Snapshot
- This is a multifamily listed at $3.10M. Condition is rated good.
Deal economics
- At list price, monthly cash flow is $10k ($123k/yr) — positive.
- The deal already cash-flows at list — no discount required.
- Meets the 1% rule at list price ($40k rent vs $3.10M).
- Recommended offer: $2.82M (9.0% below list) — sets the bar for market timing.
- Cap rate 10.3% vs local median 5.0% in Louisville — top-decile yield for the area; either an underpriced asset or a hidden risk that comps aren't pricing in. Stress-test before assuming the spread holds.
Location & tenants
- Location reads 63/100 on livability (#333 in KY) — a middle-class / working-renter tenant base. Strengths: cost of living A+, housing A+; Watch: employment C-, health & safety D+, schools D-.
- Jefferson County (urban): math 19% / reading 35% proficiency, ranked #121 of 165 in KY (top 73%) — low school quality limits family demand, transient renter base, plan for 1-2y turnover.
- Market conditions: Rents rising fast (+4.9%/yr); 144 active listings in the ZIP; lower-income renter base — watch delinquency; 2,836 units permitted in Jefferson County in 2024 (1,558 in 5+ unit buildings).
- At $40,069/mo this rent would consume 1514% of the median local household income ($32k/yr) (locally 1483% of renters already pay >50% of income on rent) — very limited rent-growth headroom before tenants either downsize or default.
Forward outlook
- Local home prices are declining (-3.0%/yr); year-one equity from $21k of loan paydown is wiped out by about $93k of value loss. Plan a longer hold.
- Jefferson County population projected at +13% by 2050 — modest demand growth; plan on rents tracking national, not racing it.
- At projected returns (-3.0% appreciation + 4.9% rent growth), your $867k cash investment doubles in ~8 years — after that, you're playing with house money.
Negotiation context
- It's been on market 100 days — a 9% lower offer ($2.82M) is reasonable based on typical stale-listing flexibility.
Risks & watch-outs
- Watch-outs: built in 1949 — expect roof / HVAC / electrical / plumbing capex.
- Climate carrying-cost: extreme-heat days projected 7→20/yr by 2055 (HVAC capex compounding) — expect insurance premiums to compound above CPI over the hold.
Questions for the listing agent
- It's been on market 100 days. Have you received any prior offers? Is the seller open to a 9% concession, seller financing, or rate buy-down credit?
- Built in 1949 — when were the roof, HVAC, electrical panel, plumbing, and water heater last replaced?
- Why hasn't it sold? Are there any deal-killer items the seller is aware of (foundation, flood, title, zoning, code violations)?
- Is there a deadline driving the sale (1031 exchange, divorce, estate, relocation)? That informs how much negotiation room exists.
- Schools are D-rated, which usually means shorter tenancies and higher turnover. Who's the typical renter profile here, and what's been the actual vacancy rate?
- Crime grade is F in this area — have there been break-ins, vandalism, or insurance claims at this property in the last 3 years? What carrier currently insures it and at what premium?
- What's the average days-on-market for RENTAL listings here right now (not sales)? A rising rental-DOM trend means longer vacancies and softer asking-rent achievability than the comps imply.
- What's the recent tenant-quality profile in this submarket — average credit score on applications, eviction rate, late-payment / NSF rate, and stable-employment percentage? A property-management company in the area should have these aggregated.
- How much new apartment / multifamily construction is in the pipeline within 1–3 miles? Heavy new supply (>2% of stock underway) typically softens rents 12–24 months out; light construction supports rent growth.
Investment metrics
- 1% rule
- 1.29% ✓
- Cap rate
- 10.27%
- Cash-on-cash
- 14.22%
- DSCR
- 1.63
- GRM
- 6.4
CMA / ARV
No comps found within radius.
Projected returns pro-forma
-3.0% appreciation · 4.87% rent growth · sell at horizon
- IRR
- 6.7%
- Equity multiple
- 1.27×
- Total profit
- $229,700
- Equity at exit
- $461,475
- IRR
- 17.6%
- Equity multiple
- 2.58×
- Total profit
- $1,371,781
- Equity at exit
- $267,599
Cash invested: $866,600 (down + closing). Projections, not guarantees.
Landlord ↔ Tenant lean methodology
- Overall (STATE)
- 83 Strongly Landlord-Friendly
- State Kentucky
- 83 Strongly Landlord-Friendly · R+16
- County
- — inherits STATE
- City
- — inherits STATE
ZIP-level market 40211
- Home prices YoY
- -33.4%
- Rents YoY
- 4.9%
- Active inventory
- 144
- Price-to-rent
- 309.0×
Monthly cashflow live
- Estimated rent
- $40,069 high interval (Pro) →
- Mortgage (P&I)
- −$16,231
- Tax est. 1.5%
- −$3,869 /mo · $46,425/yr
- Insurance
- −$1,290
- HOA
- −$0
- Vacancy / Maint / Mgmt
- −$8,414
- Net cashflow
- $10,266
Break-even live
Sensitivity live
| Price | -10% $12,405 | -5% $11,335 | +0% $10,266 | +5% $9,196 | +10% $8,127 |
|---|---|---|---|---|---|
| Rent | -10% $7,100 | -5% $8,683 | +0% $10,266 | +5% $11,848 | +10% $13,431 |
| Rate | -1.0pp $11,824 | -0.5pp $11,053 | base $10,266 | +0.5pp $9,464 | +1.0pp $8,648 |
48-unit breakdown (identical units grouped — click to expand)
| Units | Beds | Baths | Est. rent |
|---|---|---|---|
| 48× units | 1 | 1 | $40,080 |
| #1 | 1 | 1 | $835 |
| #2 | 1 | 1 | $835 |
| #3 | 1 | 1 | $835 |
| #4 | 1 | 1 | $835 |
| #5 | 1 | 1 | $835 |
| #6 | 1 | 1 | $835 |
| #7 | 1 | 1 | $835 |
| #8 | 1 | 1 | $835 |
| #9 | 1 | 1 | $835 |
| #10 | 1 | 1 | $835 |
| #11 | 1 | 1 | $835 |
| #12 | 1 | 1 | $835 |
| #13 | 1 | 1 | $835 |
| #14 | 1 | 1 | $835 |
| #15 | 1 | 1 | $835 |
| #16 | 1 | 1 | $835 |
| #17 | 1 | 1 | $835 |
| #18 | 1 | 1 | $835 |
| #19 | 1 | 1 | $835 |
| #20 | 1 | 1 | $835 |
| #21 | 1 | 1 | $835 |
| #22 | 1 | 1 | $835 |
| #23 | 1 | 1 | $835 |
| #24 | 1 | 1 | $835 |
| #25 | 1 | 1 | $835 |
| #26 | 1 | 1 | $835 |
| #27 | 1 | 1 | $835 |
| #28 | 1 | 1 | $835 |
| #29 | 1 | 1 | $835 |
| #30 | 1 | 1 | $835 |
| #31 | 1 | 1 | $835 |
| #32 | 1 | 1 | $835 |
| #33 | 1 | 1 | $835 |
| #34 | 1 | 1 | $835 |
| #35 | 1 | 1 | $835 |
| #36 | 1 | 1 | $835 |
| #37 | 1 | 1 | $835 |
| #38 | 1 | 1 | $835 |
| #39 | 1 | 1 | $835 |
| #40 | 1 | 1 | $835 |
| #41 | 1 | 1 | $835 |
| #42 | 1 | 1 | $835 |
| #43 | 1 | 1 | $835 |
| #44 | 1 | 1 | $835 |
| #45 | 1 | 1 | $835 |
| #46 | 1 | 1 | $835 |
| #47 | 1 | 1 | $835 |
| #48 | 1 | 1 | $835 |
| Total (48 units) | $40,069 | ||
UW: 25.0% down · 7.5% · 30yr · 1.5% tax · 5.0% vac · 8.0% maint · 8.0% mgmt
Financing live
Cash to close
- Down payment
- $773,750
- Closing costs
- $92,850
- Reserves months
- —
- Total cash needed
- —
Loan-product check · same deal, 3 products live
Conventional
25% down · 7.5% · 30yr
- Down + closing
- —
- Monthly P&I
- —
- Monthly cashflow
- —
- DSCR
- —
- Eligible?
- —
Personal DTI + credit; lowest rate.
DSCR
20% down · 8.5% · 30yr
- Down + closing
- —
- Monthly P&I
- —
- Monthly cashflow
- —
- DSCR
- —
- Eligible?
- —
No personal income docs; deal must DSCR.
Hard money
10% down · 12.0% · 12mo
- Down + closing
- —
- Monthly P&I
- —
- Monthly cashflow
- —
- DSCR
- —
- Eligible?
- —
Short-term bridge; refi at stabilization.
Listing history 15 events
-
2026-06-21days on market $3,095,000 Active 100 DOM
-
2026-06-18days on market $3,095,000 Active 97 DOM
-
2026-06-17days on market $3,095,000 Active 96 DOM
-
2026-06-16days on market $3,095,000 Active 95 DOM
-
2026-06-15days on market $3,095,000 Active 94 DOM
-
2026-06-13days on market $3,095,000 Active 92 DOM
-
2026-06-10days on market $3,095,000 Active 89 DOM
-
2026-06-09days on market $3,095,000 Active 88 DOM
-
2026-06-08days on market $3,095,000 Active 87 DOM
-
2026-06-07days on market $3,095,000 Active 86 DOM
-
2026-06-03days on market $3,095,000 Active 82 DOM
-
2026-06-02days on market $3,095,000 Active 81 DOM
-
2026-06-01days on market $3,095,000 Active 80 DOM
-
2026-05-31days on market $3,095,000 Active 79 DOM
-
2026-03-13$3,095,000 Active
ⓘ Source: listings_history table (triggers on properties + properties_extension) + one-shot
backfill from property_details.listing_events for pre-trigger history.
Climate risk First Street
- Flood 1/10 Low FEMA zone X (shaded) · 0% chance over 30 yrs
- Wildfire 1/10 Low
- Heat 5/10 Major 7 d/yr ≥104°F today · 20 d/yr by 30 yrs out
- Wind 2/10 Low 2% chance of damaging wind over 30 yrs
- Air quality 2/10 Low 1 unhealthy d/yr today · 2 by 30 yrs out
Nearby sold comps map
Loading sold comps map…
Walkable amenities ~0.75 mi
Loading nearby amenities…
Taxation est. · year 1
- Rental income
- $480,828
- − Mortgage interest
- −$173,368
- − Property taxes
- −$46,425
- − Insurance
- −$15,475
- − Repairs & maintenance
- −$38,466
- − Management
- −$38,466
- − Depreciation
- −$90,036
- Taxable income
- $78,591
- Est. tax owed @ 24.0%
- −$18,862
- After-tax cash flow
- $104,326/yr
For passive investors: Depreciation is non-cash, so a rental often shows a tax loss while cash-flowing — sheltering income. Rental losses are passive: they offset passive income freely, and up to $25,000/yr can offset ordinary (W-2) income if you actively participate and your MAGI is under $100k (phasing out to $0 by $150k); unused losses carry forward. On sale, claimed depreciation is recaptured at up to 25%, and gains may owe capital-gains tax (a 1031 exchange can defer both). Figures are a year-1 estimate at your 24.0% rate — not tax advice; consult a CPA.
Condition & rehab AI · 11 photos
The property is in good condition with no major repairs needed. Painting and landscaping improvements can further enhance its value.
Value-add opportunities
- Both Painting the exterior and interior walls — Fresh paint can enhance the curb appeal and interior aesthetics, making the property more attractive to potential buyers and renters.
- Both Landscaping improvements — Well-maintained landscaping can improve the property's curb appeal and add value to the property.
Renovation cost estimate screening
Value-add ROI direction
- Both Painting the exterior and interior walls — Fresh paint can enhance the curb appeal and interior aesthetics, making the property more attractive to potential buyers and renters. ↑
- Both Landscaping improvements — Well-maintained landscaping can improve the property's curb appeal and add value to the property. ↑
ⓘ Cost ranges are severity-bucket heuristics (US national rule-of-thumb). Get contractor quotes + a written scope before underwriting a rehab budget.
Schools (NCES district)
- District
- Jefferson County
- NCES district ID
- 2102990
- Math proficiency
- 19% ▼ -17.00%
- Reading proficiency
- 35% ▼ -11.00%
- Median HH income
- $47,885
- Composite
- 23.45/100
- National rank
- #7884
- State rank
- #121 of 165 in KY
Livability — Louisville
- Score
- 63/100
- State rank
- #333
- US rank
- #15887
Category grades
Schools grade is shown separately in the Schools card above.
Census & demographics
- Census place
- Louisville, KY
- County
- Jefferson County · 790,184 people
- City population
- 769,292
- Metro
- Louisville/Jefferson County, KY-IN
- Population (ZIP)
- 20,407
- Household income
- $31,749
- Rent vs Own
- Severe rent burden
- 1483.0
Population outlook (Jefferson County) Hauer SSP2
- Today (2025)
- 823,112 people
- By 2030
- 849,343 · +3.2%
- By 2040
- 895,696 · +8.8%
- By 2050
- 933,630 · +13.4%
- By 2075
- 1,028,262 · +24.9%
- By 2100
- 1,072,675 · +30.3%
Race, ethnicity, and origin ACS 2023
- Neighborhood character
- Predominantly Black (90%)
- Race & ethnicity
- Black 90% White 5% Two or more races 4% Hispanic / Latino 1%
- Common ancestry
- Italian 1%
- Foreign-born
- 1% · Canada
- Languages at home
- 98% English-only · Spanish 1%
Political lean MEDSL · Jefferson
- 2024 margin
- D (+16.6) · D 57.4% · R 40.9% · Other 1.7%
- 2008→2024 swing
- +4.5pp toward D · 2008: 12.0pp · 2024: 16.6pp
- All cycles
- 2024: D+16.6 2020: D+20.1 2016: D+13.3 2012: D+11.1 2008: D+12.0
Not yet ingested
- Civics
- —
Market trends
- HPI YoY
- ▼ -88.22%
- Current HPI
- 176.337
- Rent YoY
- ▲ 4.87%
- Metro
- Louisville/Jefferson County, KY-IN
- State GDP YoY
- ▲ 1.81%
- F500 in state
- 4
Industry mix (Fortune 500 HQ in KY)
| Industry | F500 HQs | Revenue |
|---|---|---|
| Healthcare | 1 | $118B |
|
||
| Food / Beverage | 1 | $7B |
|
||
Price history
1 event — show timeline
- 2026-03-13 Listed $3,095,000 Metro Search MLS
Cash-flow waterfall
monthlySold comps — $/sqft
last 12 mo · ≤1 miLoading sold comps…