1655 E Palm Canyon Dr #114 · Palm Springs, CA
Flood risk 4/10 · Minor
- FEMA flood zone
- X
- Chance of flooding over 30 yrs
- 0.2%
- Est. flood insurance / yr
- $507 – $1,088
Fire risk 5/10 · Moderate
- Est. fire insurance / yr
- $659 – $1,223
Heat risk 9/10 · Severe
- Hot days now (above 110°F)
- 8 days/yr
- Hot days in 30 yrs
- 24 days/yr
Wind risk 1/10 · Minimal
- Chance of severe wind over 30 yrs
- —
Air-quality risk 5/10 · Moderate
- Unhealthy air days now
- 6 days/yr
- Unhealthy air days in 30 yrs
- 8 days/yr
Risk factors via First Street. Map © Google.
Why this score? — see what drove the D grade
The composite is a weighted blend of 9 inputs, each scored 0–100. Each bar is that input's sub-score; the figure is the points it added to the 100-point composite (weight × sub-score).
- ARV discount +12.4/15.0
- Cash flow +12.1/30.0
- 1% rule +4.9/10.0
- DSCR +3.6/10.0
- Livability +3.3/5.0
- Schools +2.7/10.0
- Condition / age +2.5/5.0
- Rent growth +2.4/5.0
- Appreciation +0.0/10.0
$212,000
🖨 Deal sheet (PDF) 📄 Offer letter ✓ Due diligence
Listing remarks MLS
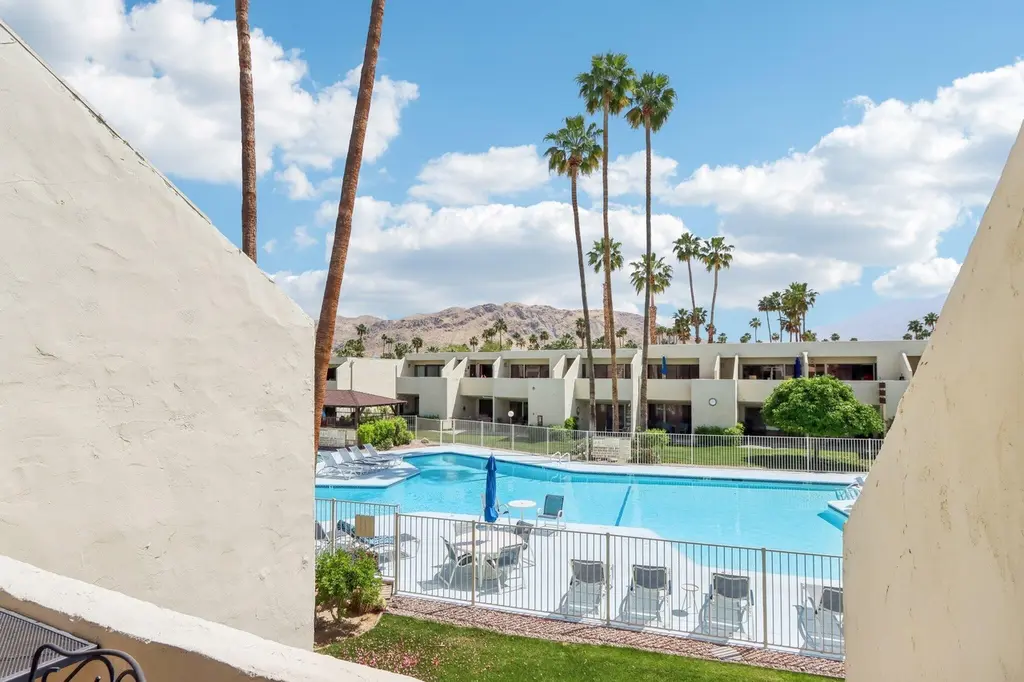
TENNIS or PICKLEBALL ANYONE? You've come to the right place! Welcome to Smoke Tree Racquet Club, where resort-style living meets the active Palm Springs lifestyle. Nestled at the gateway to the highly sought-after Indian Canyons neighborhood in South Palm Springs, this vibrant community offers everything you need--and more. Enjoy one of the largest pools in Palm Springs, a maxi-size spa, and lighted tennis & pickleball courts that are perfect for day or evening play. The adjacent dog park is a ''paw-some'' bonus your pets will love--ARF! This spacious 1-bedroom, 1-bath upper-floor condominium features a private balcony with breathtaking views of the pool and surrounding mountains. Plus, enjoy direct access to the resort amenities via a convenient semi-private rear stairway. LOCATION, LOCATION, LOCATION! Just across Sunrise Way is the rustic Smoke Tree Village, home to Ralph's Fresh Fare with Starbucks, Giuseppe's Italian, Smokin' Burgers, and more. Less than a mile away, you will find Smoke Tree Commons, offering Jensen's Fine Foods, TJ Maxx, World Market, Petco, and more shopping and dining options. Looking for a night out? The pizzazz of downtown Palm Springs is only 2.5 miles away, brimming with restaurants, shops, entertainment, and that unforgettable desert vibe.
Key facts
- $380 HOA
- Garage
- Community pool
Neighborhood map
What this means for you Summary
Snapshot
- This is a 1-bed/1.0-bath condo listed at $212k.
Deal economics
- At list price, monthly cash flow is $-45 ($-541/yr) — negative.
- To cash-flow at today's rent, offer at most $204k (3.8% below list).
- To meet the 1% rule (rent ≥ 1% of price), the offer needs to be $211k (0.7% below list).
- Recommended offer: $199k (6.0% below list) — sets the bar for market timing.
- Cap rate 6.0% vs local median 2.7% in Palm Springs — top-decile yield for the area; either an underpriced asset or a hidden risk that comps aren't pricing in. Stress-test before assuming the spread holds.
Location & tenants
- Location reads 66/100 on livability (#348 in CA) — a middle-class / working-renter tenant base. Strengths: amenities A+, commute A+; Watch: crime F, cost of living F, health & safety F.
- Palm Springs Unified (suburban): math 21% / reading 42% proficiency, ranked #328 of 517 in CA (top 63%) — families likely to look elsewhere, expect single-tenant / working-renter base with shorter leases; 73% free/reduced lunch — lower-income household profile, screen leases tightly.
- Zoned schools: Cahuilla Elementary (421 students, 93% FRL); Raymond Cree Middle (708 students, 98% FRL); Palm Springs High (math 30% / reading 51%, grade F, #508 of 1,170 statewide, top 44%, 1,584 students, 97% FRL) — zoned schools average 96% FRL vs 73% district-wide (22 pts higher); higher-poverty schools than district average — tighter screening recommended.
- Market conditions: Rents soft (-0.4%/yr); 498 active listings in the ZIP; 38 comparable units currently listed for rent nearby; rentals at typical pace (median 26d on market — plan ~3-4 weeks tenant-placement turnaround); solid renter incomes; 9,195 units permitted in Riverside County in 2024 (1,512 in 5+ unit buildings).
- This rent runs 33% of the median local income ($78k/yr) — at the standard rent-burdened threshold; future hikes will face affordability resistance.
Forward outlook
- Local home prices are declining (-3.0%/yr); year-one equity from $1k of loan paydown is wiped out by about $6k of value loss. Plan a longer hold.
- Riverside County population projected at +22% by 2050 — long-run rental-demand tailwind backs the buy-and-hold thesis.
Negotiation context
- It's been on market 74 days — a 6% lower offer ($199k) is reasonable based on typical stale-listing flexibility.
- 4 sale attempts with the ask held roughly flat each time — persistent listings suggest the price (not the market) is what's stuck; bring a comps-based counter.
Risks & watch-outs
- Climate carrying-cost: moderate wildfire risk; extreme-heat days projected 8→24/yr by 2055 (HVAC capex compounding) — expect insurance premiums to compound above CPI over the hold.
Questions for the listing agent
- What do current leases actually rent for vs. the listed asking? Can we see a recent rent roll and the last 12 months of T-12 income?
- It's been on market 74 days. Have you received any prior offers? Is the seller open to a 6% concession, seller financing, or rate buy-down credit?
- Built in 1974 — when were the roof, HVAC, electrical panel, plumbing, and water heater last replaced?
- What does the HOA fee cover, when was the last increase, and are there any pending special assessments or reserve-fund shortfalls?
- Any open or pending special assessments — roof, HVAC, plumbing, elevator, façade? What's the per-unit balance and payoff schedule, and is the seller paying it off at close or rolling it to the buyer?
- Why hasn't it sold? Are there any deal-killer items the seller is aware of (foundation, flood, title, zoning, code violations)?
- Is there a deadline driving the sale (1031 exchange, divorce, estate, relocation)? That informs how much negotiation room exists.
- Crime grade is F in this area — have there been break-ins, vandalism, or insurance claims at this property in the last 3 years? What carrier currently insures it and at what premium?
- The area grade is low — what's the realistic commute time and amenity access for the typical tenant pool here? Any planned neighborhood developments (good or bad) we should know about?
- What's the average days-on-market for RENTAL listings here right now (not sales)? A rising rental-DOM trend means longer vacancies and softer asking-rent achievability than the comps imply.
- What's the recent tenant-quality profile in this submarket — average credit score on applications, eviction rate, late-payment / NSF rate, and stable-employment percentage? A property-management company in the area should have these aggregated.
- How much new apartment / multifamily construction is in the pipeline within 1–3 miles? Heavy new supply (>2% of stock underway) typically softens rents 12–24 months out; light construction supports rent growth.
Investment metrics
- 1% rule
- 0.99% ✗
- Cap rate
- 6.04%
- Cash-on-cash
- -0.91%
- DSCR
- 0.96
- GRM
- 8.4
CMA / ARV
- ARV (median comp)
- $237,881
- List price
- $212,000
- Delta
- -10.88%
- Verdict
- UNDERPRICED
- Comps
- 20 within 1.0 mi
Projected returns pro-forma
-3.0% appreciation · 0.0% rent growth · sell at horizon
- IRR
- -21.7%
- Equity multiple
- 0.27×
- Total profit
- $-43,216
- Equity at exit
- $31,610
- IRR
- -27.3%
- Equity multiple
- -0.09×
- Total profit
- $-64,443
- Equity at exit
- $18,330
Cash invested: $59,360 (down + closing). Projections, not guarantees.
Landlord ↔ Tenant lean methodology
- Overall (STATE)
- 18 Strongly Tenant-Friendly
- State California
- 18 Strongly Tenant-Friendly · D+13
- County
- — inherits STATE
- City
- — inherits STATE
ZIP-level market 92264
- Rents YoY
- -0.4%
- Active inventory
- 498
- Price-to-rent
- 8.4×
Monthly cashflow live
- Estimated rent
- $2,106 high interval (Pro) →
- Mortgage (P&I)
- −$1,112
- Tax from tax record
- −$129 /mo · $1,542/yr
- Insurance
- −$88
- HOA
- −$380
- Vacancy / Maint / Mgmt
- −$442
- Net cashflow
- $-45
Break-even live
Sensitivity live
| Price | -10% $75 | -5% $15 | +0% $-45 | +5% $-105 | +10% $-165 |
|---|---|---|---|---|---|
| Rent | -10% $-211 | -5% $-128 | +0% $-45 | +5% $38 | +10% $121 |
| Rate | -1.0pp $62 | -0.5pp $9 | base $-45 | +0.5pp $-100 | +1.0pp $-156 |
UW: 25.0% down · 7.5% · 30yr · 1.5% tax · 5.0% vac · 8.0% maint · 8.0% mgmt
Financing live
Cash to close
- Down payment
- $53,000
- Closing costs
- $6,360
- Reserves months
- —
- Total cash needed
- —
Loan-product check · same deal, 3 products live
Conventional
25% down · 7.5% · 30yr
- Down + closing
- —
- Monthly P&I
- —
- Monthly cashflow
- —
- DSCR
- —
- Eligible?
- —
Personal DTI + credit; lowest rate.
DSCR
20% down · 8.5% · 30yr
- Down + closing
- —
- Monthly P&I
- —
- Monthly cashflow
- —
- DSCR
- —
- Eligible?
- —
No personal income docs; deal must DSCR.
Hard money
10% down · 12.0% · 12mo
- Down + closing
- —
- Monthly P&I
- —
- Monthly cashflow
- —
- DSCR
- —
- Eligible?
- —
Short-term bridge; refi at stabilization.
Rent comps 38 comps
| Address | Beds | Baths | Sqft | Rent | $/sqft | DOM | Units | Dist |
|---|---|---|---|---|---|---|---|---|
| 1655 E Palm Canyon Dr Palm Springs, CA | 1.0 | 1.0 | 755 | $2,122 | $2.81 | 45d | 3 | 0.04mi |
| 1655 E Palm Canyon Dr Palm Springs, CA | 1.0 | 1.0 | 755 | $2,000 | $2.65 | 9d | 3 | 0.04mi |
| 1655 E Palm Canyon Dr Palm Springs, CA | 1.0 | 1.0 | 755 | $2,350 | $3.11 | 26d | 2 | 0.04mi |
| 1530 E Palm Canyon Dr Unit 209 Palm Springs, CA | 2.0 | 2.0 | 740 | $2,595 | $3.51 | 5d | 1 | 0.06mi |
| 1400 E Palm Canyon Dr Unit 113 Palm Springs, CA | 1.0 | 1.0 | 800 | $1,995 | $2.49 | 45d | 1 | 0.10mi |
| 1111 E Palm Canyon Dr Palm Springs, CA | 1.0 | 1.0 | 525 | $2,525 | $4.81 | 26d | 2 | 0.39mi |
| 1428 S Camino Real Palm Springs, CA | 2.0 | 2.0 | 1054 | $2,300 | $2.18 | 45d | 1 | 0.56mi |
| 1674 Via Salida Unit 3 Palm Springs, CA | 1.0 | 1.0 | 550 | $1,650 | $3.00 | 17d | 1 | 0.75mi |
| 777 E San Lorenzo Rd Unit 3 Palm Springs, CA | 1.0 | 1.0 | 550 | $1,765 | $3.21 | 20d | 1 | 0.81mi |
| 120 Pali Dr Palm Springs, CA | 2.0 | 2.0 | 835 | $2,200 | $2.63 | 23d | 1 | 0.83mi |
| 722 E San Lorenzo Rd Palm Springs, CA | 3.0 | 1.0–2.0 | 750 | $1,605 | $2.14 | 9d | 3 | 0.86mi |
| 1425 Via Soledad Unit 1 Palm Springs, CA | 2.0 | 2.0 | 1050 | $2,500 | $2.38 | 45d | 1 | 0.86mi |
| 1425 Via Soledad Unit 1 Palm Springs, CA | 2.0 | 2.0 | 1050 | $2,500 | $2.38 | 26d | 1 | 0.86mi |
| 1900 S Palm Canyon Dr #42 Palm Springs, CA | 2.0 | 2.0 | 1024 | $2,500 | $2.44 | 45d | 1 | 0.87mi |
| 788 N Riverside Dr Palm Springs, CA | 1.0 | 1.0 | 725 | $1,648 | $2.27 | 45d | 1 | 0.88mi |
| 620 S Thornhill Rd Unit 6 Palm Springs, CA | 1.0 | 1.0 | 656 | $1,765 | $2.69 | 26d | 1 | 0.89mi |
| 620 S Thornhill Rd Unit 3 Palm Springs, CA | 2.0 | 1.0 | 700 | $1,985 | $2.84 | 26d | 1 | 0.89mi |
| 671 S Riverside Dr Unit 6 Palm Springs, CA | 2.0 | 2.0 | 900 | $1,985 | $2.21 | 26d | 1 | 0.90mi |
| 1950 S Palm Canyon Dr Palm Springs, CA | 1.0–2.0 | 1.0–2.0 | 902 | $1,999 | $2.22 | 4d | 3 | 0.93mi |
| 1950 S Palm Canyon Dr Palm Springs, CA | 1.0–2.0 | 1.0–2.0 | 902 | $2,095 | $2.32 | 45d | 2 | 0.93mi |
| 1700 S Araby Dr Palm Springs, CA | 1.0–2.0 | 1.0–2.0 | 871 | $2,217 | $2.54 | 0d | 5 | 0.98mi |
| 505 S Farrell Dr Palm Springs, CA | 1.0–2.0 | 1.0–2.0 | 986 | $1,700 | $1.72 | 4d | 4 | 1.03mi |
| 1111 E Ramon Rd Palm Springs, CA | 2.0–3.0 | 2.0 | 1191 | $2,000 | $1.68 | 26d | 2 | 1.04mi |
| 1111 E Ramon Rd Palm Springs, CA | 2.0–3.0 | 2.0 | 1191 | $2,800 | $2.35 | 18d | 2 | 1.04mi |
| 1050 E Ramon Rd Palm Springs, CA | 2.0 | 2.0 | 1135 | $3,264 | $2.88 | 1d | 3 | 1.10mi |
| 2540 S Araby Dr Palm Springs, CA | 1.0 | 1.0 | 678 | $2,900 | $4.28 | 45d | 1 | 1.13mi |
| 594 Calle Abronia S Unit 03 Palm Springs, CA | 2.0 | 2.0 | 662 | $1,895 | $2.86 | 45d | 1 | 1.13mi |
| 585 Calle Abronia S Unit B Palm Springs, CA | 1.0 | 1.0 | 750 | $2,100 | $2.80 | 45d | 1 | 1.16mi |
| 583 Calle Abronia S Unit A Palm Springs, CA | 2.0 | 1.0 | 760 | $2,299 | $3.02 | 45d | 1 | 1.16mi |
| 500 S Farrell Dr Palm Springs, CA | 1.0–2.0 | 1.0–2.0 | 986 | $2,800 | $2.84 | 45d | 3 | 1.21mi |
| 311 S Sunrise Way Palm Springs, CA | 2.0 | 1.0–2.0 | 688 | $1,950 | $2.83 | 26d | 18 | 1.26mi |
| 900 E Saturnino Rd Palm Springs, CA | 1.0–3.0 | 1.0–2.0 | 1020 | $1,870 | $1.83 | 0d | 6 | 1.35mi |
| 280 S Avenida Caballeros #129 Palm Springs, CA | 1.0 | 1.5 | 767 | $1,699 | $2.22 | 26d | 1 | 1.35mi |
| 1745 E Arenas Rd Unit 11 Palm Springs, CA | 2.0 | 2.0 | 900 | $1,975 | $2.19 | 45d | 1 | 1.39mi |
| 2900 E Ramon Rd Palm Springs, CA | 1.0–2.0 | 1.0 | 626 | $1,699 | $2.71 | 1d | 7 | 1.40mi |
| 300 S Calle El Segundo Palm Springs, CA | 1.0–2.0 | 1.0 | 554 | $1,330 | $2.40 | 5d | 1 | 1.42mi |
| 557 El Cielo Rd Unit 16 Palm Springs, CA | 2.0 | 2.0 | 845 | $1,800 | $2.13 | 45d | 1 | 1.48mi |
| 550 El Cielo Rd Unit 12 Palm Springs, CA | 1.0 | 1.0 | 600 | $1,350 | $2.25 | 26d | 1 | 1.48mi |
HOA detail condo
- Monthly dues
- $380 · $4,560/yr
- Likely covers
- pool
- Assessments
- None detected in remarks — confirm with the listing agent.
Listing history 22 events
-
2026-06-21days on market $212,000 Active 74 DOM
-
2026-06-18days on market $212,000 Active 71 DOM
-
2026-06-17days on market $212,000 Active 70 DOM
-
2026-06-16days on market $212,000 Active 69 DOM
-
2026-06-15days on market $212,000 Active 68 DOM
-
2026-06-13days on market $212,000 Active 66 DOM
-
2026-06-13pricedays on market $212,000 Active 65 DOM
-
2026-06-09days on market $219,000 Active 62 DOM
-
2026-06-08days on market $219,000 Active 61 DOM
-
2026-06-07days on market $219,000 Active 60 DOM
-
2026-06-04days on market $219,000 Active 57 DOM
-
2026-06-03days on market $219,000 Active 56 DOM
-
2026-06-02days on market $219,000 Active 55 DOM
-
2026-06-01days on market $219,000 Active 54 DOM
-
2026-05-31days on market $219,000 Active 53 DOM
-
2026-04-08$219,000 Active 1294-char remark
Show marketing remark (1294 chars)
TENNIS or PICKLEBALL ANYONE? You've come to the right place! Welcome to Smoke Tree Racquet Club, where resort-style living meets the active Palm Springs lifestyle. Nestled at the gateway to the highly sought-after Indian Canyons neighborhood in South Palm Springs, this vibrant community offers everything you need--and more. Enjoy one of the largest pools in Palm Springs, a maxi-size spa, and lighted tennis & pickleball courts that are perfect for day or evening play. The adjacent dog park is a ''paw-some'' bonus your pets will love--ARF! This spacious 1-bedroom, 1-bath upper-floor condominium features a private balcony with breathtaking views of the pool and surrounding mountains. Plus, enjoy direct access to the resort amenities via a convenient semi-private rear stairway. LOCATION, LOCATION, LOCATION! Just across Sunrise Way is the rustic Smoke Tree Village, home to Ralph's Fresh Fare with Starbucks, Giuseppe's Italian, Smokin' Burgers, and more. Less than a mile away, you will find Smoke Tree Commons, offering Jensen's Fine Foods, TJ Maxx, World Market, Petco, and more shopping and dining options. Looking for a night out? The pizzazz of downtown Palm Springs is only 2.5 miles away, brimming with restaurants, shops, entertainment, and that unforgettable desert vibe.
-
2026-02-03historical
-
2025-11-03$223,000 Active
-
2025-11-01historical
-
2025-08-08$223,000 Active
-
2025-08-01historical
-
2025-04-18$223,000 Active
ⓘ Source: listings_history table (triggers on properties + properties_extension) + one-shot
backfill from property_details.listing_events for pre-trigger history.
Tax reassessment forecast CA · Resets to sale price
- Current annual tax
- $1,542 · $129/mo
- Projected year-2 tax
- $1,611 · $134/mo
- Expected delta
- +$69/yr (+$6/mo · 4.5%)
ⓘ Screening estimate from a state-policy table — verify with the county assessor before closing.
Climate risk First Street
- Flood 4/10 Moderate FEMA zone X · 20% chance over 30 yrs
- Wildfire 5/10 Major
- Heat 9/10 Extreme 8 d/yr ≥110°F today · 24 d/yr by 30 yrs out
- Wind 1/10 Low
- Air quality 5/10 Major 6 unhealthy d/yr today · 8 by 30 yrs out
Nearby sold comps map
Loading sold comps map…
Walkable amenities ~0.75 mi
Loading nearby amenities…
Taxation est. · year 1
- Rental income
- $25,268
- − Mortgage interest
- −$11,875
- − Property taxes
- −$1,542
- − Insurance
- −$1,060
- − Repairs & maintenance
- −$2,021
- − Management
- −$2,021
- − HOA
- −$4,560
- − Depreciation
- −$6,167
- Taxable loss
- −$3,979
- Est. tax savings @ 24.0%
- +$955
- After-tax cash flow
- $414/yr
For passive investors: Depreciation is non-cash, so a rental often shows a tax loss while cash-flowing — sheltering income. Rental losses are passive: they offset passive income freely, and up to $25,000/yr can offset ordinary (W-2) income if you actively participate and your MAGI is under $100k (phasing out to $0 by $150k); unused losses carry forward. On sale, claimed depreciation is recaptured at up to 25%, and gains may owe capital-gains tax (a 1031 exchange can defer both). Figures are a year-1 estimate at your 24.0% rate — not tax advice; consult a CPA.
Schools (NCES district)
- District
- Palm Springs Unified
- NCES district ID
- 0629550
- Math proficiency
- 21% ▼ -7.00%
- Reading proficiency
- 42% ▬ 0.00%
- Median HH income
- $43,638
- Composite
- 26.76/100
- National rank
- #7131
- State rank
- #328 of 517 in CA
Livability — Palm Springs
- Score
- 66/100
- State rank
- #348
- US rank
- #11850
Category grades
Schools grade is shown separately in the Schools card above.
Census & demographics
- Census place
- Palm Springs, CA
- County
- Riverside County · 2,287,001 people
- City population
- 46,786
- Metro
- Riverside-San Bernardino-Ontario, CA
- Population (ZIP)
- 19,899
- Household income
- $77,688
- Rent vs Own
- Severe rent burden
- 1215.0
Population outlook (Riverside County) Hauer SSP2
- Today (2025)
- 2,664,475 people
- By 2030
- 2,802,692 · +5.2%
- By 2040
- 3,050,904 · +14.5%
- By 2050
- 3,256,783 · +22.2%
- By 2075
- 3,655,058 · +37.2%
- By 2100
- 3,766,594 · +41.4%
Race, ethnicity, and origin ACS 2023
- Neighborhood character
- Predominantly White (68%)
- Race & ethnicity
- White 68% Hispanic / Latino 20% Two or more races 12% Asian 6% Black 2% Native American 1%
- Hispanic origin (detail)
- Mexican 16%
- Common ancestry
- Lithuanian 4% Romanian 3% Slovak 3%
- Foreign-born
- 16% · Canada, China, South Korea
- Languages at home
- 81% English-only · Spanish 13% Tagalog/Filipino 2% Other Asian/Pacific 1%
Political lean MEDSL · Riverside
- 2024 margin
- Toss-up / Even · D 48.0% · R 49.3% · Other 2.6%
- 2008→2024 swing
- -3.6pp toward R · 2008: 2.3pp · 2024: -1.3pp
- All cycles
- 2024: R+1.3 2020: D+8.0 2016: D+4.3 2012: R+0.4 2008: D+2.3
Not yet ingested
- Civics
- —
Market trends
- HPI YoY
- ▼ -489.04%
- Current HPI
- 357.0969
- Rent YoY
- ▼ -0.43%
- Metro
- Riverside-San Bernardino-Ontario, CA
- State GDP YoY
- ▲ 3.21%
- F500 in state
- 116
Industry mix (Fortune 500 HQ in CA)
| Industry | F500 HQs | Revenue |
|---|---|---|
| Technology | 27 | $1,492B |
|
||
| Financial Services | 3 | $174B |
|
||
| Retail | 3 | $44B |
|
||
| Insurance | 3 | $26B |
|
||
| Media / Entertainment | 2 | $115B |
|
||
| Pharmaceuticals / Biotech | 2 | $62B |
|
||
Price history
-1.8% since first listed7 events — show timeline
- 2026-04-08 Listed $219,000 GPSMLS
- 2026-02-03 Listing Removed — GPSMLS
- 2025-11-03 Listed $223,000 GPSMLS
- 2025-11-01 Listing Removed — GPSMLS
- 2025-08-08 Listed $223,000 GPSMLS
- 2025-08-01 Listing Removed — GPSMLS
- 2025-04-18 Listed $223,000 GPSMLS
Property tax history
+1.9%/yrLatest (2025): $1,542 · -2.3% YoY. Source: county tax records.
Cash-flow waterfall
monthlySold comps — $/sqft
last 12 mo · ≤1 miLoading sold comps…