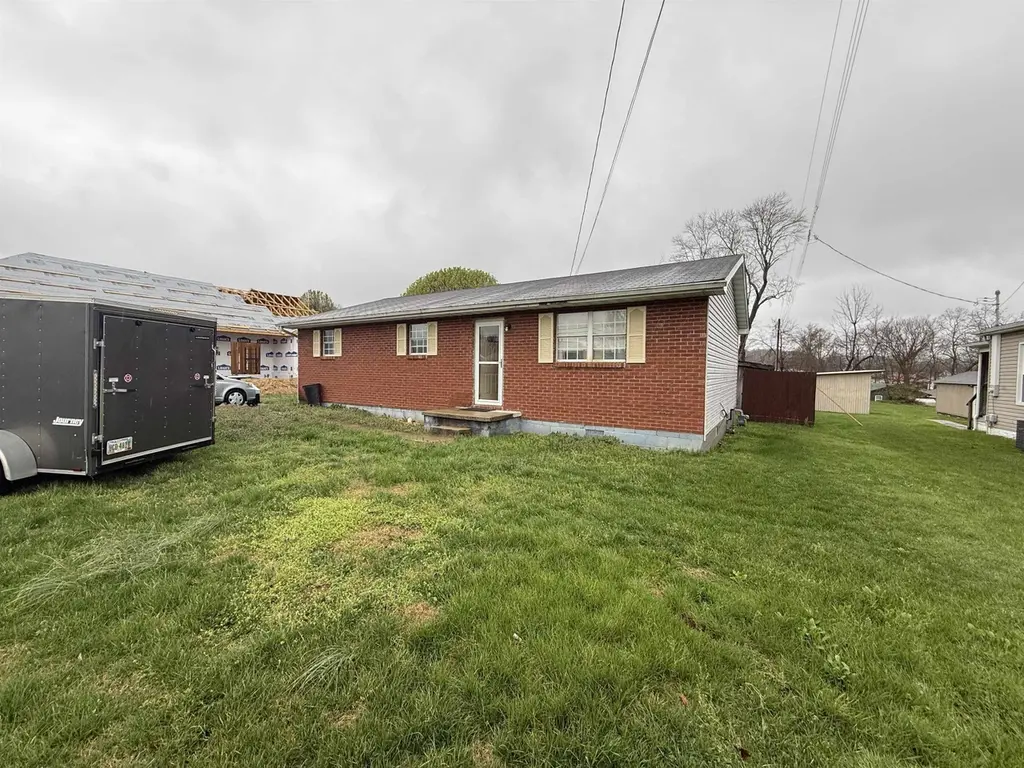
2901 Indian Run Rd · Flatwoods, KY
Flood risk 1/10 · Minimal
- FEMA flood zone
- X (unshaded)
- Chance of flooding over 30 yrs
- 0.0%
- Est. flood insurance / yr
- $507 – $1,088
Fire risk 3/10 · Minor
- Est. fire insurance / yr
- $839 – $1,559
Heat risk 4/10 · Minor
- Hot days now (above 102°F)
- 7 days/yr
- Hot days in 30 yrs
- 19 days/yr
Wind risk 2/10 · Minimal
- Chance of severe wind over 30 yrs
- 2.0%
Air-quality risk 2/10 · Minimal
- Unhealthy air days now
- 0 days/yr
- Unhealthy air days in 30 yrs
- 2 days/yr
Risk factors via First Street. Map © Google.
Why this score? — see what drove the B- grade
The composite is a weighted blend of 9 inputs, each scored 0–100. Each bar is that input's sub-score; the figure is the points it added to the 100-point composite (weight × sub-score).
- Cash flow +24.8/30.0
- ARV discount +15.0/15.0
- DSCR +8.0/10.0
- 1% rule +5.6/10.0
- Schools +3.8/10.0
- Livability +3.6/5.0
- Rent growth +2.5/5.0
- Condition / age +2.5/5.0
- Appreciation +0.0/10.0
$99,999
🖨 Deal sheet 📄 Offer letter ✓ Due diligence
Listing remarks
3 bedrooms, 1 bath, all on one level and sitting on . 23 acres with 1,040 square feet that actually feels usable. This partially brick home keeps things simple but gives you room to make it your own. The layout flows easily from the living space into a large eat in kitchen with plenty of room for a full table, not just a corner squeeze. All bedrooms are positioned near the full bath for a practical setup that just works. Outside, you have just enough yard to enjoy without constant upkeep. Whether you are buying your first home, downsizing, or looking for something you can personalize over time, this one is worth a look. Sold as is. Cash only.
Key facts
- Built 1960
- Listed 2 days
Neighborhood map
What this means for you Summary
Snapshot
- This is a 3-bed/1.0-bath single-family listed at $100k.
Deal economics
- At list price, monthly cash flow is $210 ($3k/yr) — positive.
- The deal already cash-flows at list — no discount required.
- Meets the 1% rule at list price ($1k rent vs $100k).
- Cap rate 8.8% vs local median 3.3% in Flatwoods — top-decile yield for the area; either an underpriced asset or a hidden risk that comps aren't pricing in. Stress-test before assuming the spread holds.
Location & tenants
- Location reads 72/100 on livability (#125 in KY) — a middle-class / working-renter tenant base. Strengths: crime A+, cost of living A+, housing A+; Watch: amenities F, commute F.
- Russell Independent (suburban): math 40% / reading 49% proficiency, ranked #22 of 165 in KY (top 13%) — families likely to look elsewhere, expect single-tenant / working-renter base with shorter leases.
- Zoned schools: Russell-Mcdowell Intermediate School (math 43% / reading 46%, grade F, #148 of 676 statewide, top 24%, 456 students, 51% FRL); Russell High School (math 42% / reading 47%, grade F, #21 of 254 statewide, top 10%, 668 students, 42% FRL).
- Market conditions: 42 active listings in the ZIP; 20 units permitted in Greenup County in 2024 (0 in 5+ unit buildings).
Forward outlook
- Local home prices are declining (-3.0%/yr); year-one equity from $691 of loan paydown is wiped out by about $3k of value loss. Plan a longer hold.
- Greenup County population projected at -19% by 2050 — secular population decline; favor cash flow + early exit over multi-decade hold.
Negotiation context
- Only 2 days on market — expect competitive offers; lowballing is unlikely to land.
- 2 sale attempts; this cycle's ask is 5% above the opening price — seller raised mid-cycle; expect resistance to lowballs.
Questions for the listing agent
- Built in 1960 — when were the roof, HVAC, electrical panel, plumbing, and water heater last replaced?
- Is there a deadline driving the sale (1031 exchange, divorce, estate, relocation)? That informs how much negotiation room exists.
- Schools are B-rated — typically a magnet for longer-tenancy family renters. What's the average tenant stay here, and is there a school-zone premium baked into asking?
- What's the average days-on-market for RENTAL listings here right now (not sales)? A rising rental-DOM trend means longer vacancies and softer asking-rent achievability than the comps imply.
- What's the recent tenant-quality profile in this submarket — average credit score on applications, eviction rate, late-payment / NSF rate, and stable-employment percentage? A property-management company in the area should have these aggregated.
- How much new for-sale + rental construction is in the pipeline within 1–3 miles? Heavy new supply typically softens prices + rents 12–24 months out; constrained supply supports both.
Investment metrics
- 1% rule
- 1.06% ✓
- Cap rate
- 8.81%
- Cash-on-cash
- 9.00%
- DSCR
- 1.40
- GRM
- 7.9
CMA / ARV
- ARV (on-the-fly)
- $134,160
- Comps found
- 12
Show comp detail 12 sales within ~0.75 mi
| Address | Dist | Beds/Ba | Sqft | Sold | Price | $/sf | Match |
|---|---|---|---|---|---|---|---|
| 2610 Roberts St | 0.23mi | 3/1.0 | 1,008 (-3%) | 1mo | $135,000 | $134 | 84 |
| 2615 Roberts St | 0.21mi | 3/1.0 | 1,071 (+3%) | 7mo | $138,000 | $129 | 80 |
| 1520 Luci Mae Dr | 0.63mi | 3/1.0 | 1,008 (-3%) | 2mo | $141,000 | $140 | 64 |
| 2600 Indian Run Road Rd | 0.26mi | 3/1.0 | 1,128 (+8%) | 15mo | $90,000 | $80 | 61 |
| 2606 Roberts St | 0.25mi | 2/1.0 (-1) | 949 (-9%) | 9mo | $130,000 | $137 | 61 |
| 942 Vallance St | 0.52mi | 3/1.0 | 1,100 (+6%) | 10mo | $80,000 | $73 | 58 |
| 1515 Luci Mae Dr | 0.64mi | 2/1.0 (-1) | 1,036 (-0%) | 10mo | $131,150 | $127 | 56 |
| 2613 Roberts St | 0.22mi | 2/1.0 (-1) | 933 (-10%) | 15mo | $140,000 | $150 | 55 |
| 1214 Napier St | 0.67mi | 2/1.0 (-1) | 1,000 (-4%) | 4mo | $112,200 | $112 | 54 |
| 1213 W Collins St | 0.60mi | 2/1.0 (-1) | 936 (-10%) | 4mo | $25,000 | $27 | 47 |
| 49 Toni Drive Dr | 0.68mi | 3/1.0 | 993 (-4%) | 18mo | $123,500 | $124 | 46 |
| 2210 Oak St | 0.64mi | 4/2.0 (+1) | 886 (-15%) | 16mo | $170,000 | $192 | 23 |
Match score weights: distance 35% · size 25% · config 20% · recency 20%. Top-matched comps best support the ARV.
Projected returns pro-forma
-3.0% appreciation · 3.0% rent growth · sell at horizon
- IRR
- -2.7%
- Equity multiple
- 0.90×
- Total profit
- $-2,853
- Equity at exit
- $14,910
- IRR
- 7.0%
- Equity multiple
- 1.52×
- Total profit
- $14,637
- Equity at exit
- $8,646
Cash invested: $28,000 (down + closing). Projections, not guarantees.
Landlord ↔ Tenant lean methodology
- Overall (STATE)
- 83 Strongly Landlord-Friendly
- State Kentucky
- 83 Strongly Landlord-Friendly · R+16
- County
- — inherits STATE
- City
- — inherits STATE
ZIP-level market 41139
- Home prices YoY
- -6.4%
- Active inventory
- 42
- Price-to-rent
- 7.9×
Monthly cashflow live
- Estimated rent
- $1,055 medium interval (Pro) →
- Mortgage (P&I)
- −$524
- Tax from tax record
- −$58 /mo · $692/yr
- Insurance
- −$42
- HOA
- −$0
- Vacancy / Maint / Mgmt
- −$222
- Net cashflow
- $210
Break-even live
UW: 25.0% down · 7.5% · 30yr · 1.5% tax · 5.0% vac · 8.0% maint · 8.0% mgmt
Financing live
Cash to close
- Down payment
- $25,000
- Closing costs
- $3,000
- Reserves months
- —
- Total cash needed
- —
Loan-product check · same deal, 3 products live
Conventional
25% down · 7.5% · 30yr
- Down + closing
- —
- Monthly P&I
- —
- Monthly cashflow
- —
- DSCR
- —
- Eligible?
- —
Personal DTI + credit; lowest rate.
DSCR
20% down · 8.5% · 30yr
- Down + closing
- —
- Monthly P&I
- —
- Monthly cashflow
- —
- DSCR
- —
- Eligible?
- —
No personal income docs; deal must DSCR.
Hard money
10% down · 12.0% · 12mo
- Down + closing
- —
- Monthly P&I
- —
- Monthly cashflow
- —
- DSCR
- —
- Eligible?
- —
Short-term bridge; refi at stabilization.
Listing history 6 events
-
2026-05-11soldstatus $95,000
-
2026-04-24soldstatus $95,000
-
2026-04-24$95,000
-
2026-04-02status Pending
-
2026-03-31$99,999 Active
-
2025-11-21soldstatus $143,000
ⓘ Source: listings_history table (triggers on properties + properties_extension) + one-shot
backfill from property_details.listing_events for pre-trigger history.
Tax reassessment forecast KY · Resets to sale price
- Current annual tax
- $692 · $58/mo
- Projected year-2 tax
- $860 · $72/mo
- Expected delta
- +$168/yr (+$14/mo · 24.3%)
ⓘ Screening estimate from a state-policy table — verify with the county assessor before closing.
Climate risk First Street
- Flood 1/10 Low FEMA zone X (unshaded) · 0% chance over 30 yrs
- Wildfire 3/10 Moderate
- Heat 4/10 Moderate 7 d/yr ≥102°F today · 19 d/yr by 30 yrs out
- Wind 2/10 Low 2% chance of damaging wind over 30 yrs
- Air quality 2/10 Low 0 unhealthy d/yr today · 2 by 30 yrs out
Nearby sold comps map
Loading sold comps map…
Walkable amenities ~0.75 mi
Loading nearby amenities…
Taxation est. · year 1
- Rental income
- $12,665
- − Mortgage interest
- −$5,601
- − Property taxes
- −$692
- − Insurance
- −$500
- − Repairs & maintenance
- −$1,013
- − Management
- −$1,013
- − Depreciation
- −$2,909
- Taxable income
- $936
- Est. tax owed @ 24.0%
- −$225
- After-tax cash flow
- $2,296/yr
For passive investors: Depreciation is non-cash, so a rental often shows a tax loss while cash-flowing — sheltering income. Rental losses are passive: they offset passive income freely, and up to $25,000/yr can offset ordinary (W-2) income if you actively participate and your MAGI is under $100k (phasing out to $0 by $150k); unused losses carry forward. On sale, claimed depreciation is recaptured at up to 25%, and gains may owe capital-gains tax (a 1031 exchange can defer both). Figures are a year-1 estimate at your 24.0% rate — not tax advice; consult a CPA.
Schools (NCES district)
- District
- Russell Independent
- NCES district ID
- 2105130
- Math proficiency
- 40% ▼ -22.00%
- Reading proficiency
- 49% ▼ -18.00%
- Median HH income
- $49,382
- Composite
- 38.14/100
- National rank
- #4268
- State rank
- #22 of 165 in KY
Livability — Flatwoods
- Score
- 72/100
- State rank
- #125
- US rank
- #5872
Category grades
Schools grade is shown separately in the Schools card above.
Census & demographics
- Census place
- Flatwoods, KY
- County
- Greenup · 24,497 people
- City population
- 5,527
- Metro
- Huntington-Ashland, WV-KY-OH
- Population (ZIP)
- 8,258
- Household income
- $59,550
- Rent vs Own
- Severe rent burden
- 4.4
Population outlook (Greenup County) Hauer SSP2
- Today (2025)
- 34,374 people
- By 2030
- 33,145 · -3.6%
- By 2040
- 30,407 · -11.5%
- By 2050
- 27,702 · -19.4%
- By 2075
- 21,970 · -36.1%
- By 2100
- 16,670 · -51.5%
Race, ethnicity, and origin ACS 2023
- Neighborhood character
- Predominantly White (96%)
- Race & ethnicity
- White 96% Two or more races 3% Hispanic / Latino 1%
- Common ancestry
- Slovak 2% Serbian 1% Lithuanian 1%
- Foreign-born
- 1% · Canada
- Languages at home
- 99% English-only · Spanish 1%
Political lean MEDSL · Greenup
- 2024 margin
- Solid R (+50.5) · D 24.1% · R 74.6% · Other 1.3%
- 2008→2024 swing
- -36.4pp toward R · 2008: -14.1pp · 2024: -50.5pp
- All cycles
- 2024: R+50.5 2020: R+45.1 2016: R+45.5 2012: R+18.6 2008: R+14.1
Not yet ingested
- Civics
- —
Market trends
- HPI YoY
- ▼ -12.89%
- Current HPI
- 189.3977
- Rent YoY
- —
- Metro
- —
- State GDP YoY
- ▲ 1.81%
- F500 in state
- 4
Industry mix (Fortune 500 HQ in KY)
| Industry | F500 HQs | Revenue |
|---|---|---|
| Healthcare | 1 | $118B |
|
||
| Food / Beverage | 1 | $7B |
|
||
Price history
-33.6% since first listed6 events — show timeline
- 2026-05-11 Sold (Public Records) $95,000 Public Records
- 2026-04-24 Listed $95,000 AABOR
- 2026-04-24 Sold (MLS) $95,000 AABOR
- 2026-04-02 Pending — REALTRACS as Distributed by MLS Grid
- 2026-03-31 Listed $99,999 REALTRACS as Distributed by MLS Grid
- 2025-11-21 Sold (Public Records) $143,000 Public Records
Property tax history
+1.1%/yrLatest (2025): $692 · +2.0% YoY. Source: county tax records.
Cash-flow waterfall
monthlySold comps — $/sqft
last 12 mo · ≤1 miLoading sold comps…