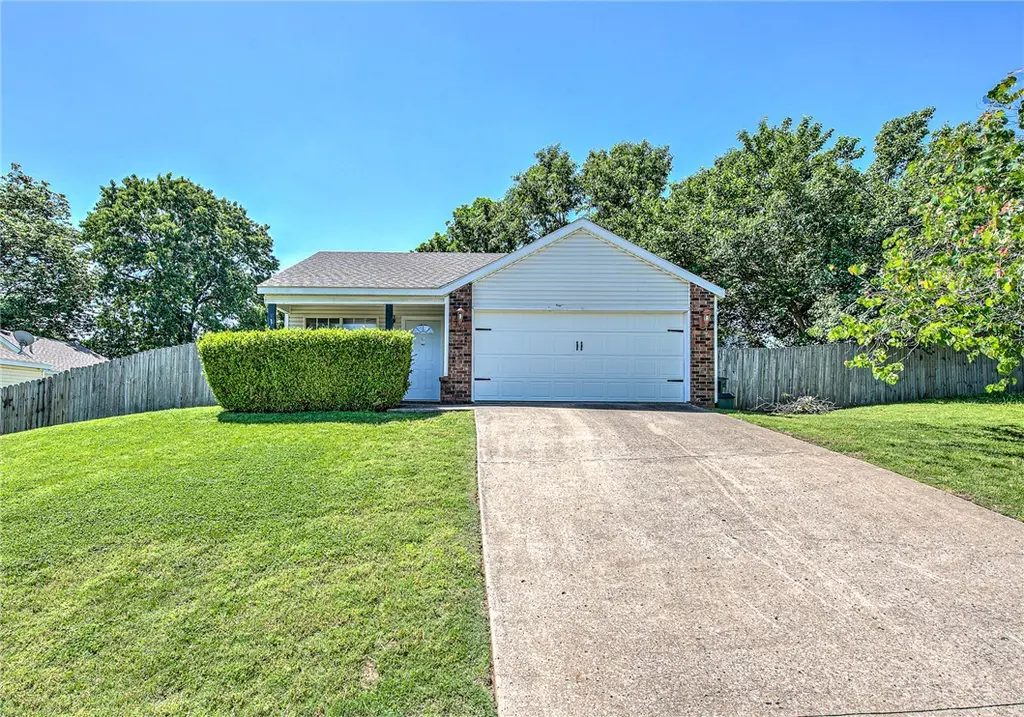
3103 W Woodridge Dr · Fayetteville, AR
Flood risk 1/10 · Minimal
- FEMA flood zone
- X (unshaded)
- Chance of flooding over 30 yrs
- 0.0%
- Est. flood insurance / yr
- $507 – $1,088
Fire risk 4/10 · Minor
- Est. fire insurance / yr
- $1,499 – $2,785
Heat risk 5/10 · Moderate
- Hot days now (above 105°F)
- 7 days/yr
- Hot days in 30 yrs
- 20 days/yr
Wind risk 2/10 · Minimal
- Chance of severe wind over 30 yrs
- 2.0%
Air-quality risk 1/10 · Minimal
- Unhealthy air days now
- 0 days/yr
- Unhealthy air days in 30 yrs
- 0 days/yr
Risk factors via First Street. Map © Google.
Why this score? — see what drove the D- grade
The composite is a weighted blend of 9 inputs, each scored 0–100. Each bar is that input's sub-score; the figure is the points it added to the 100-point composite (weight × sub-score).
- ARV discount +15.0/15.0
- Cash flow +7.2/30.0
- Livability +4.2/5.0
- Schools +4.1/10.0
- Rent growth +3.0/5.0
- Condition / age +2.5/5.0
- 1% rule +1.7/10.0
- DSCR +1.4/10.0
- Appreciation +0.0/10.0
$200,000
🖨 Deal sheet 📄 Offer letter ✓ Due diligence
Listing remarks MLS
Perfect home for investors or first-time buyers! This home has been well maintained and is move-in ready. Located only 7 minutes to the University of Arkansas campus, Walking distance to the dog Park and trails. This home features a large back yard with full privacy fence. Back yard has a back patio and low-maintenance siding. Primary bedroom has an oversized closet with an ensuite bathroom. New roof was added in 2021. Home will be sold "AS IS. " Seller has the right to accept an offer before May 17 at 5:00pm
Key facts
- Oversized closet
- Move in ready
- Patio
Tags
Property features AI
Finance
- HOA & community: Monthly association fee; Community amenities include biking paths, curbs, sidewalks, trails/paths, shopping access, and proximity to hospitals and schools
Exterior
- Parking: Attached garage with garage door opener; 2 covered parking spaces
- Security: Smoke detectors
- Utilities: Electricity available; Public water; Sewer available
- Home design: Single-story; Entry on main level
- Construction: Brick and vinyl siding exterior; Architectural shingle roof; Slab foundation; Built with materials including brick and vinyl siding
- Exterior features: Concrete driveway; Covered patio; Patio; Backyard privacy fencing (wood); Landscaped; Sloped lot; City lot; Located in a subdivision; Public paved road frontage
Interior
- Kitchen: Dishwasher; Electric range; Range hood; Disposal; Refrigerator
- Flooring: Carpet; Concrete; Tile
- Bathrooms: 2 full bathrooms
- Heating & cooling: Central heating (electric); Central air conditioning (electric)
- Interior features: Attic; Ceiling fans; Storage; Walk-in closets
- Laundry & utility: Washer hookup; Dryer hookup; Washer; Dryer; Electric water heater
Neighborhood map
What this means for you Summary
Snapshot
- This is a 2-bed/2.0-bath single-family listed at $200k.
Deal economics
- At list price, monthly cash flow is $-275 ($-3k/yr) — negative.
- To cash-flow at today's rent, offer at most $151k (24.3% below list).
- To meet the 1% rule (rent ≥ 1% of price), the offer needs to be $133k (33.4% below list).
- Recommended offer: $133k (33.4% below list) — sets the bar for 1% rule.
- Cap rate 4.6% vs local median 3.5% in Fayetteville — top-decile yield for the area; either an underpriced asset or a hidden risk that comps aren't pricing in. Stress-test before assuming the spread holds.
Location & tenants
- Location reads 83/100 on livability (#3 in AR, #871 nationally) — a professional / high-income tenant draw. Strengths: amenities A+, commute A+, health & safety A+; Watch: employment D+, crime D-.
- Fayetteville School District (urban): math 50% / reading 49% proficiency, ranked #19 of 238 in AR (top 8%) — families likely to look elsewhere, expect single-tenant / working-renter base with shorter leases.
- Market conditions: Rents rising (+2.2%/yr); 539 active listings in the ZIP; 32 comparable units currently listed for rent nearby; rentals at typical pace (median 23d on market — plan ~3-4 weeks tenant-placement turnaround); 44% of comp listings sitting > 30 days — soft ceiling on asking rent; solid renter incomes; 3,494 units permitted in Washington County in 2024 (1,497 in 5+ unit buildings).
- This rent is only 17% of the median local income ($96k/yr) — well below the 30% rent-burden line; pricing power to push rent on renewal without tenant pushback.
Forward outlook
- Local home prices are declining (-3.0%/yr); year-one equity from $1k of loan paydown is wiped out by about $6k of value loss. Plan a longer hold.
- Washington County population projected at +47% by 2050 — long-run rental-demand tailwind backs the buy-and-hold thesis.
Negotiation context
- Only 7 days on market — expect competitive offers; lowballing is unlikely to land.
- 4 sale attempts since 12y ago with the ask held roughly flat each time — persistent listings suggest the price (not the market) is what's stuck; bring a comps-based counter.
Risks & watch-outs
- Climate carrying-cost: extreme-heat days projected 7→20/yr by 2055 (HVAC capex compounding) — expect insurance premiums to compound above CPI over the hold.
Questions for the listing agent
- What do current leases actually rent for vs. the listed asking? Can we see a recent rent roll and the last 12 months of T-12 income?
- Is there a deadline driving the sale (1031 exchange, divorce, estate, relocation)? That informs how much negotiation room exists.
- Schools are B-rated — typically a magnet for longer-tenancy family renters. What's the average tenant stay here, and is there a school-zone premium baked into asking?
- Crime grade is D in this area — have there been break-ins, vandalism, or insurance claims at this property in the last 3 years? What carrier currently insures it and at what premium?
- The area grade is low — what's the realistic commute time and amenity access for the typical tenant pool here? Any planned neighborhood developments (good or bad) we should know about?
- What's the average days-on-market for RENTAL listings here right now (not sales)? A rising rental-DOM trend means longer vacancies and softer asking-rent achievability than the comps imply.
- What's the recent tenant-quality profile in this submarket — average credit score on applications, eviction rate, late-payment / NSF rate, and stable-employment percentage? A property-management company in the area should have these aggregated.
- How much new for-sale + rental construction is in the pipeline within 1–3 miles? Heavy new supply typically softens prices + rents 12–24 months out; constrained supply supports both.
Investment metrics
- 1% rule
- 0.67% ✗
- Cap rate
- 4.64%
- Cash-on-cash
- -5.89%
- DSCR
- 0.74
- GRM
- 12.5
CMA / ARV
- ARV (median comp)
- $253,010
- List price
- $200,000
- Delta
- -20.95%
- Verdict
- UNDERPRICED
- Comps
- 20 within 1.0 mi
Show comp detail 12 sales within ~0.75 mi
| Address | Dist | Beds/Ba | Sqft | Sold | Price | $/sf | Match |
|---|---|---|---|---|---|---|---|
| 3064 W Essex Dr | 0.04mi | 3/2.0 (+1) | 952 (+0%) | 0mo | $235,000 | $247 | 92 |
| 3032 W Essex Dr | 0.06mi | 2/2.0 | 874 (-8%) | 1mo | $232,000 | $265 | 83 |
| 3170 W Essex Dr | 0.06mi | 2/2.0 | 900 (-5%) | 12mo | $240,764 | $268 | 79 |
| 3206 Oakfield St | 0.14mi | 2/2.0 | 884 (-7%) | 8mo | $230,000 | $260 | 75 |
| 3089 W Wildflower St | 0.10mi | 3/2.0 (+1) | 1,068 (+12%) | 3mo | $235,000 | $220 | 67 |
| 3119 W Essex Dr | 0.05mi | 3/2.0 (+1) | 1,068 (+12%) | 6mo | $240,000 | $225 | 67 |
| 1482 N Timbercrest Ave | 0.31mi | 2/1.5 | 896 (-6%) | 10mo | $227,000 | $253 | 66 |
| 3210 W Woodfield Way | 0.23mi | 2/2.0 | 886 (-7%) | 18mo | $225,000 | $254 | 63 |
| 1541 N Timbercrest Ave | 0.27mi | 3/2.0 (+1) | 1,028 (+8%) | 10mo | $216,000 | $210 | 60 |
| 1660 N Linda Jo Pl | 0.71mi | 2/2.0 | 966 (+2%) | 14mo | $220,000 | $228 | 52 |
| 3070 Mount Comfort Rd | 0.42mi | 3/1.0 (+1) | 1,026 (+8%) | 11mo | $155,000 | $151 | 49 |
| 2558 W Valley Dr | 0.67mi | 2/2.0 | 1,084 (+14%) | 17mo | $305,000 | $281 | 31 |
Match score weights: distance 35% · size 25% · config 20% · recency 20%. Top-matched comps best support the ARV.
Projected returns pro-forma
-3.0% appreciation · 2.17% rent growth · sell at horizon
- IRR
- -27.3%
- Equity multiple
- 0.09×
- Total profit
- $-51,023
- Equity at exit
- $29,821
- IRR
- -28.4%
- Equity multiple
- -0.28×
- Total profit
- $-71,468
- Equity at exit
- $17,292
Cash invested: $56,000 (down + closing). Projections, not guarantees.
Landlord ↔ Tenant lean methodology
- Overall (STATE)
- 92 Strongly Landlord-Friendly
- State Arkansas
- 92 Strongly Landlord-Friendly · R+14
- County
- — inherits STATE
- City
- — inherits STATE
ZIP-level market 72704
- Home prices YoY
- -20.2%
- Rents YoY
- 2.2%
- Active inventory
- 539
- Price-to-rent
- 12.5×
Monthly cashflow live
- Estimated rent
- $1,331 high interval (Pro) →
- Mortgage (P&I)
- −$1,049
- Tax from tax record
- −$194 /mo · $2,330/yr
- Insurance
- −$83
- HOA
- −$0
- Vacancy / Maint / Mgmt
- −$280
- Net cashflow
- $-275
Break-even live
UW: 25.0% down · 7.5% · 30yr · 1.5% tax · 5.0% vac · 8.0% maint · 8.0% mgmt
Financing live
Cash to close
- Down payment
- $50,000
- Closing costs
- $6,000
- Reserves months
- —
- Total cash needed
- —
Loan-product check · same deal, 3 products live
Conventional
25% down · 7.5% · 30yr
- Down + closing
- —
- Monthly P&I
- —
- Monthly cashflow
- —
- DSCR
- —
- Eligible?
- —
Personal DTI + credit; lowest rate.
DSCR
20% down · 8.5% · 30yr
- Down + closing
- —
- Monthly P&I
- —
- Monthly cashflow
- —
- DSCR
- —
- Eligible?
- —
No personal income docs; deal must DSCR.
Hard money
10% down · 12.0% · 12mo
- Down + closing
- —
- Monthly P&I
- —
- Monthly cashflow
- —
- DSCR
- —
- Eligible?
- —
Short-term bridge; refi at stabilization.
Rent comps 32 comps
| Address | Beds | Baths | Sqft | Rent | $/sqft | DOM | Units | Dist |
|---|---|---|---|---|---|---|---|---|
| 3191 W Oakfield St Unit 1229426P Fayetteville, AR | 2.0 | 2.0 | 839 | $3,978 | $4.74 | 14d | 1 | 0.17mi |
| 1751 N Shiloh Dr Fayetteville, AR | 3.0 | 1.0–2.0 | 959 | $1,675 | $1.75 | 44d | 4 | 0.25mi |
| 3130 W Telluride Dr Fayetteville, AR | 1.0–2.0 | 1.0–2.0 | 694 | $1,150 | $1.66 | 21d | 5 | 0.39mi |
| 1144 N Futrall Dr Fayetteville, AR | 1.0–2.0 | 1.0–2.0 | 767 | $975 | $1.27 | 43d | 1 | 0.58mi |
| 1035 N Betty Jo Dr Fayetteville, AR | 2.0 | 1.5 | 1000 | $1,062 | $1.06 | 21d | 13 | 0.66mi |
| 3001 W Wedington Dr Fayetteville, AR | 1.0–4.0 | 1.0–2.5 | 1000 | $1,165 | $1.17 | 43d | 3 | 0.68mi |
| 1370 N Porter Rd Unit 2 Fayetteville, AR | 2.0 | 2.5 | 990 | $1,545 | $1.56 | 43d | 1 | 0.71mi |
| 1350 N Porter Rd Unit 3 Fayetteville, AR | 1.0 | 1.0 | 770 | $1,275 | $1.66 | 43d | 1 | 0.71mi |
| 1366 N Porter Rd Unit 2 Fayetteville, AR | 1.0 | 1.0 | 770 | $1,275 | $1.66 | 43d | 1 | 0.72mi |
| 1358 N Porter Rd Unit 2 Fayetteville, AR | 1.0 | 1.0 | 770 | $1,275 | $1.66 | 43d | 1 | 0.73mi |
| 3600 W Player Ln Fayetteville, AR | 1.0–2.0 | 1.0–2.0 | 818 | $1,125 | $1.37 | 43d | 1 | 0.78mi |
| 687 N Betty Jo Dr Fayetteville, AR | 2.0 | 1.5 | 1015 | $1,095 | $1.08 | 14d | 1 | 0.88mi |
| 1931 W Deane St Fayetteville, AR | 2.0 | 1.0 | 725 | $995 | $1.37 | 23d | 1 | 0.90mi |
| 1931 W Deane St Unit U Fayetteville, AR | 2.0 | 1.0 | 725 | $925 | $1.28 | 23d | 1 | 0.90mi |
| 2015 W Lawson St Unit 2015 Fayetteville, AR | 2.0 | 1.0 | 900 | $1,000 | $1.11 | 43d | 1 | 0.93mi |
| 1855 W Deane St Fayetteville, AR | 2.0 | 1.0 | 785 | $895 | $1.14 | 43d | 1 | 0.97mi |
| 1853 W Deane St Unit F Fayetteville, AR | 2.0 | 1.0 | 785 | $925 | $1.18 | 23d | 1 | 0.97mi |
| 1851 W Deane St Fayetteville, AR | 2.0 | 1.0 | 785 | $945 | $1.20 | 23d | 1 | 0.98mi |
| 605 N Betty Jo Dr Unit 6052 Betty Jo Fayetteville, AR | 2.0 | 1.0 | 1056 | $895 | $0.85 | 43d | 1 | 0.98mi |
| 1777 W Preservation Dr Fayetteville, AR | 2.0 | 1.0 | 900 | $1,147 | $1.27 | 14d | 4 | 1.02mi |
| 539 N Betty Jo Dr Unit 1 Fayetteville, AR | 2.0 | 1.5 | 1000 | $1,000 | $1.00 | 23d | 1 | 1.06mi |
| 1701 N Lewis Ave Unit 7 Fayetteville, AR | 2.0 | 1.0 | 900 | $795 | $0.88 | 23d | 1 | 1.06mi |
| 1701 N Lewis Ave Unit 8 Fayetteville, AR | 2.0 | 1.0 | 900 | $795 | $0.88 | 14d | 1 | 1.06mi |
| 1701 N Lewis Ave Unit 1 Fayetteville, AR | 2.0 | 1.0 | 900 | $795 | $0.88 | 43d | 1 | 1.06mi |
| 1701 N Lewis Ave Unit 15 Fayetteville, AR | 2.0 | 1.0 | 900 | $795 | $0.88 | 13d | 1 | 1.07mi |
| 2091 W Ora Dr Unit B Fayetteville, AR | 2.0 | 2.5 | 1000 | $1,975 | $1.98 | 14d | 1 | 1.09mi |
| 502 N Betty Jo Dr Fayetteville, AR | 2.0 | 1.5 | 1024 | $1,195 | $1.17 | 43d | 1 | 1.10mi |
| 4418 Acoma St Fayetteville, AR | 2.0 | 1.5 | 998 | $1,350 | $1.35 | 14d | 1 | 1.28mi |
| 4451 Acoma St Unit 4451 Fayetteville, AR | 2.0 | 1.0 | 840 | $1,150 | $1.37 | 23d | 1 | 1.29mi |
| 4520 W Franciscan Trl Fayetteville, AR | 2.0 | 1.5 | 997 | $1,500 | $1.50 | 43d | 1 | 1.31mi |
| 4530 W Franciscan Trl Fayetteville, AR | 2.0 | 1.0 | 800 | $1,195 | $1.49 | 23d | 1 | 1.33mi |
| 1225 W Mount Comfort Rd Fayetteville, AR | 1.0–2.0 | 1.0 | 595 | $1,211 | $2.03 | 13d | 16 | 1.47mi |
Listing history 17 events
-
2026-06-07statusdays on market $200,000 Pending 7 DOM
-
2026-06-05days on market $200,000 Active 6 DOM
-
2026-06-03days on market $200,000 Active 5 DOM
-
2026-06-02statusdays on market $200,000 Active 4 DOM
-
2026-05-18status Pending 909-char remark
-
2026-05-15$200,000 Active 909-char remark
-
2022-06-15soldstatus $210,000
-
2022-06-13soldstatus $210,000 Closed 524-char remark
Show marketing remark (524 chars)
Perfect home for investors or first-time buyers! This home has been well maintained and is move-in ready. Located only 7 minutes to the University of Arkansas campus, Walking distance to the dog Park and trails. This home features a large back yard with full privacy fence. Back yard has a back patio and low-maintenance siding. Primary bedroom has an oversized closet with an ensuite bathroom. New roof was added in 2021. Home will be sold "AS IS. " Seller has the right to accept an offer before May 17 at 5:00pm
-
2022-05-17status Pending 524-char remark
Show marketing remark (524 chars)
Perfect home for investors or first-time buyers! This home has been well maintained and is move-in ready. Located only 7 minutes to the University of Arkansas campus, Walking distance to the dog Park and trails. This home features a large back yard with full privacy fence. Back yard has a back patio and low-maintenance siding. Primary bedroom has an oversized closet with an ensuite bathroom. New roof was added in 2021. Home will be sold "AS IS. " Seller has the right to accept an offer before May 17 at 5:00pm
-
2022-05-05$185,000 Active 524-char remark
Show marketing remark (524 chars)
Perfect home for investors or first-time buyers! This home has been well maintained and is move-in ready. Located only 7 minutes to the University of Arkansas campus, Walking distance to the dog Park and trails. This home features a large back yard with full privacy fence. Back yard has a back patio and low-maintenance siding. Primary bedroom has an oversized closet with an ensuite bathroom. New roof was added in 2021. Home will be sold "AS IS. " Seller has the right to accept an offer before May 17 at 5:00pm
-
2015-05-19soldstatus $102,500
Show marketing remark (186 chars)
A Darling house that is move-in ready at a great price! Great location. Close to Uof A so perfect to own or as an investment. Great neighborhood!, Entire house has been freshly painted.
-
2015-05-19soldstatus $102,500
Show marketing remark (186 chars)
A Darling house that is move-in ready at a great price! Great location. Close to Uof A so perfect to own or as an investment. Great neighborhood!, Entire house has been freshly painted.
-
2014-12-02$105,000
Show marketing remark (186 chars)
A Darling house that is move-in ready at a great price! Great location. Close to Uof A so perfect to own or as an investment. Great neighborhood!, Entire house has been freshly painted.
-
2003-11-24soldstatus $85,000
-
1997-08-05soldstatus $65,000
-
1996-08-06soldstatus $63,000
-
1996-05-28soldstatus $26,000
ⓘ Source: listings_history table (triggers on properties + properties_extension) + one-shot
backfill from property_details.listing_events for pre-trigger history.
Tax reassessment forecast AR · Resets to sale price
- Current annual tax
- $2,330 · $194/mo
- Projected year-2 tax
- $2,330 · $194/mo
- Expected delta
- $0/yr ($0/mo · 0.0%)
ⓘ Screening estimate from a state-policy table — verify with the county assessor before closing.
Climate risk First Street
- Flood 1/10 Low FEMA zone X (unshaded) · 0% chance over 30 yrs
- Wildfire 4/10 Moderate
- Heat 5/10 Major 7 d/yr ≥105°F today · 20 d/yr by 30 yrs out
- Wind 2/10 Low 2% chance of damaging wind over 30 yrs
- Air quality 1/10 Low 0 unhealthy d/yr today · 0 by 30 yrs out
Nearby sold comps map
Loading sold comps map…
Walkable amenities ~0.75 mi
Loading nearby amenities…
Taxation est. · year 1
- Rental income
- $15,973
- − Mortgage interest
- −$11,203
- − Property taxes
- −$2,330
- − Insurance
- −$1,000
- − Repairs & maintenance
- −$1,278
- − Management
- −$1,278
- − Depreciation
- −$5,818
- Taxable loss
- −$6,933
- Est. tax savings @ 24.0%
- +$1,664
- After-tax cash flow
- $-1,633/yr
For passive investors: Depreciation is non-cash, so a rental often shows a tax loss while cash-flowing — sheltering income. Rental losses are passive: they offset passive income freely, and up to $25,000/yr can offset ordinary (W-2) income if you actively participate and your MAGI is under $100k (phasing out to $0 by $150k); unused losses carry forward. On sale, claimed depreciation is recaptured at up to 25%, and gains may owe capital-gains tax (a 1031 exchange can defer both). Figures are a year-1 estimate at your 24.0% rate — not tax advice; consult a CPA.
Schools (NCES district)
- District
- Fayetteville School District
- NCES district ID
- 0506120
- Math proficiency
- 50% ▼ -11.00%
- Reading proficiency
- 49% ▼ -8.00%
- Median HH income
- $39,595
- Composite
- 41.39/100
- National rank
- #3477
- State rank
- #19 of 238 in AR
Livability — Fayetteville
- Score
- 83/100
- State rank
- #3
- US rank
- #871
Category grades
Schools grade is shown separately in the Schools card above.
Census & demographics
- Census place
- Fayetteville, AR
- County
- Washington County · 252,056 people
- City population
- 118,228
- Metro
- Fayetteville-Springdale-Rogers, AR
- Population (ZIP)
- 32,497
- Household income
- $96,014
- Rent vs Own
- Severe rent burden
- 883.0
Population outlook (Washington County) Hauer SSP2
- Today (2025)
- 271,748 people
- By 2030
- 296,414 · +9.1%
- By 2040
- 346,874 · +27.6%
- By 2050
- 398,552 · +46.7%
- By 2075
- 523,309 · +92.6%
- By 2100
- 615,280 · +126.4%
Race, ethnicity, and origin ACS 2023
- Neighborhood character
- Predominantly White (77%)
- Race & ethnicity
- White 77% Two or more races 14% Hispanic / Latino 7% Black 3% Asian 2%
- Hispanic origin (detail)
- Mexican 5%
- Common ancestry
- Slovak 3% Italian 3% Lithuanian 2%
- Foreign-born
- 5% · Canada
- Languages at home
- 94% English-only · Spanish 3% Other Indo-European 2% Other Asian/Pacific 1%
Political lean MEDSL · Washington
- 2024 margin
- Lean R (+6.7) · D 45.1% · R 51.7% · Other 3.2%
- 2008→2024 swing
- +6.4pp toward D · 2008: -13.1pp · 2024: -6.7pp
- All cycles
- 2024: R+6.7 2020: R+3.9 2016: R+10.4 2012: R+16.3 2008: R+13.1
Not yet ingested
- Civics
- —
Market trends
- HPI YoY
- ▼ -73.44%
- Current HPI
- 289.7478
- Rent YoY
- ▲ 2.17%
- Metro
- Fayetteville-Springdale-Rogers, AR
- State GDP YoY
- ▲ 3.80%
- F500 in state
- 10
Industry mix (Fortune 500 HQ in AR)
| Industry | F500 HQs | Revenue |
|---|---|---|
| Retail | 1 | $681B |
|
||
| Food / Agriculture | 1 | $53B |
|
||
| Retail / Energy | 1 | $22B |
|
||
| Transportation / Logistics | 1 | $12B |
|
||
| Energy | 1 | $4B |
|
||
Price history
+669.2% since first listed15 events — show timeline
- 2026-06-05 Pending — NWARMLS
- 2026-06-02 Relisted — NWARMLS
- 2026-05-18 Pending — NWARMLS
- 2026-05-15 Listed $200,000 NWARMLS
- 2022-06-15 Sold (Public Records) $210,000 Public Records
- 2022-06-13 Sold (MLS) $210,000 NWARMLS
- 2022-05-17 Pending — NWARMLS
- 2022-05-05 Listed $185,000 NWARMLS
- 2015-05-19 Sold (Public Records) $102,500 Public Records
- 2015-05-19 Sold (MLS) $102,500 NWARMLS
- 2014-12-02 Listed $105,000 NWARMLS
- 2003-11-24 Sold (Public Records) $85,000 Public Records
- 1997-08-05 Sold (Public Records) $65,000 Public Records
- 1996-08-06 Sold (Public Records) $63,000 Public Records
- 1996-05-28 Sold (Public Records) $26,000 Public Records
Property tax history
+6.8%/yrLatest (2025): $2,330 · +0.0% YoY. Source: county tax records.
Cash-flow waterfall
monthlySold comps — $/sqft
last 12 mo · ≤1 miLoading sold comps…