 🏗️ New Construction
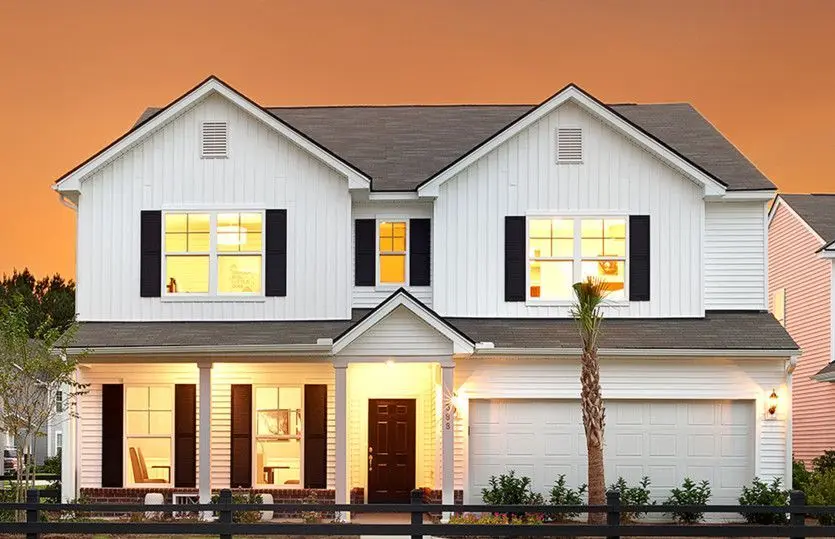
Mitchell Plan · Savannah, GA
Flood risk No data
- FEMA flood zone
- —
- Chance of flooding over 30 yrs
- —
- Est. flood insurance / yr
- —
Fire risk No data
- Est. fire insurance / yr
- —
Heat risk No data
- Hot days now (above threshold)
- —
- Hot days in 30 yrs
- —
Wind risk No data
- Chance of severe wind over 30 yrs
- —
Air-quality risk No data
- Unhealthy air days now
- —
- Unhealthy air days in 30 yrs
- —
Risk factors via First Street. Map © Google.
Why this score? — see what drove the F grade
The composite is a weighted blend of 9 inputs, each scored 0–100. Each bar is that input's sub-score; the figure is the points it added to the 100-point composite (weight × sub-score).
- ARV discount +7.5/15.0
- Schools +4.5/10.0
- Livability +4.3/5.0
- Cash flow +4.1/30.0
- Rent growth +3.0/5.0
- Condition / age +2.5/5.0
- 1% rule +0.2/10.0
- DSCR +0.0/10.0
- Appreciation +0.0/10.0
$465,990
🖨 Deal sheet (PDF) 📄 Offer letter ✓ Due diligence
Listing remarks MLS
Step into the Mitchell floor plan in Richmond Hill, GA, and experience a new home design that perfectly complements your lifestyle. Enjoy the open kitchen, café, and gathering room ideal for hosting or relaxing. The spacious upstairs loft and Owner's Suite with a walk-in closet offer added convenience. Discover how this new construction blends comfort and flexibility for modern living.
Key facts
- Gathering room
- Upstairs loft
- Walk-in closet
Tags
Neighborhood map
What this means for you Summary
Snapshot
- This is a 4-bed/2.5-bath single-family listed at $466k.
Deal economics
- At list price, monthly cash flow is $-2k ($-22k/yr) — negative.
- To cash-flow at today's rent, offer at most $388k (16.7% below list).
- To meet the 1% rule (rent ≥ 1% of price), the offer needs to be $340k (27.1% below list).
- Recommended offer: $340k (27.1% below list) — sets the bar for 1% rule.
- Cap rate 3.0% vs local median 4.0% in Savannah — below-typical yield; the buyer is paying a premium for something (appreciation thesis, condition, location) that the cap rate doesn't capture.
Location & tenants
- Location reads 86/100 on livability (#1 in GA, #397 nationally) — a professional / high-income tenant draw. Strengths: crime A+, amenities A+, commute A+; Watch: employment D.
- Bryan County (rural): math 49% / reading 53% proficiency, ranked #14 of 174 in GA (top 8%) — acceptable for families but not a draw, mixed tenant base, ~2y average lease.
- Zoned schools: Mcallister Elementary School (math 73% / reading 67%, grade A-, #61 of 1,228 statewide, top 5%, 915 students, 9% FRL); Richmond Hill Middle School (math 49% / reading 61%, grade B-, #51 of 470 statewide, top 11%, 1,894 students, 25% FRL); Richmond Hill High School (math 32% / reading 58%, grade D-, #46 of 424 statewide, top 11%, 2,454 students, 23% FRL).
- Market conditions: Rents rising (+2.2%/yr); 483 active listings in the ZIP; 4 comparable units currently listed for rent nearby; rentals at typical pace (median 23d on market — plan ~3-4 weeks tenant-placement turnaround); high-income renter base; 510 units permitted in Bryan County in 2024 (68 in 5+ unit buildings).
- This rent runs 33% of the median local income ($122k/yr) — at the standard rent-burdened threshold; future hikes will face affordability resistance.
Forward outlook
- Local home prices are declining (-3.0%/yr); year-one equity from $4k of loan paydown is wiped out by about $19k of value loss. Plan a longer hold.
- Bryan County population projected at +64% by 2050 — long-run rental-demand tailwind backs the buy-and-hold thesis.
Negotiation context
- It's been on market 265 days — a 12% lower offer ($410k) is reasonable based on typical stale-listing flexibility.
Questions for the listing agent
- What do current leases actually rent for vs. the listed asking? Can we see a recent rent roll and the last 12 months of T-12 income?
- It's been on market 265 days. Have you received any prior offers? Is the seller open to a 27% concession, seller financing, or rate buy-down credit?
- Why hasn't it sold? Are there any deal-killer items the seller is aware of (foundation, flood, title, zoning, code violations)?
- Is there a deadline driving the sale (1031 exchange, divorce, estate, relocation)? That informs how much negotiation room exists.
- Schools are F-rated, which usually means shorter tenancies and higher turnover. Who's the typical renter profile here, and what's been the actual vacancy rate?
- The area grade is low — what's the realistic commute time and amenity access for the typical tenant pool here? Any planned neighborhood developments (good or bad) we should know about?
- What's the average days-on-market for RENTAL listings here right now (not sales)? A rising rental-DOM trend means longer vacancies and softer asking-rent achievability than the comps imply.
- What's the recent tenant-quality profile in this submarket — average credit score on applications, eviction rate, late-payment / NSF rate, and stable-employment percentage? A property-management company in the area should have these aggregated.
- How much new for-sale + rental construction is in the pipeline within 1–3 miles? Heavy new supply typically softens prices + rents 12–24 months out; constrained supply supports both.
Investment metrics
- 1% rule
- 0.52% ✗
- Cap rate
- 2.96%
- Cash-on-cash
- -11.90%
- DSCR
- 0.47
- GRM
- 15.9
CMA / ARV
- ARV (median comp)
- $648,854
- List price
- $465,990
- Delta
- -28.18%
- Verdict
- UNDERPRICED
- Comps
- 20 within 1.0 mi
Show comp detail 12 sales within ~0.75 mi
| Address | Dist | Beds/Ba | Sqft | Sold | Price | $/sf | Match |
|---|---|---|---|---|---|---|---|
| 64 Trail View Ct | 0.12mi | 5/3.0 (+1) | 2,966 (+0%) | 4mo | $517,165 | $174 | 84 |
| 56 Trail View Ct | 0.12mi | 4/3.0 | 3,119 (+6%) | 2mo | $504,265 | $162 | 82 |
| 88 Sandy Bnd | 0.15mi | 5/3.0 (+1) | 3,027 (+2%) | 1mo | $625,940 | $207 | 81 |
| 125 Sandy Bnd | 0.19mi | 3/3.5 (-1) | 2,859 (-3%) | 1mo | $694,450 | $243 | 76 |
| 310 W Blackjack Oak Dr | 0.47mi | 4/3.5 | 2,893 (-2%) | 1mo | $579,000 | $200 | 70 |
| 106 Sandy Bend Dr | 0.17mi | 3/3.5 (-1) | 2,712 (-8%) | 1mo | $609,426 | $225 | 68 |
| 40 Bradford Pear Dr | 0.48mi | 4/3.0 | 2,730 (-8%) | 3mo | $538,000 | $197 | 60 |
| 220 Castnet Cv | 0.30mi | 5/3.5 (+1) | 3,244 (+10%) | 3mo | $700,565 | $216 | 58 |
| 240 Blackjack Oak Dr W | 0.40mi | 3/4.0 (-1) | 2,772 (-6%) | 2mo | $561,500 | $203 | 58 |
| 418 Enclave Dr | 0.71mi | 4/3.5 | 3,053 (+3%) | 1mo | $875,000 | $287 | 57 |
| 405 Ridgewood Park Dr N | 0.50mi | 5/4.0 (+1) | 3,287 (+11%) | 1mo | $750,000 | $228 | 46 |
| 542 Linkside Lake Dr | 0.69mi | 5/3.5 (+1) | 3,184 (+8%) | 2mo | $885,000 | $278 | 44 |
Match score weights: distance 35% · size 25% · config 20% · recency 20%. Top-matched comps best support the ARV.
Projected returns pro-forma
-3.0% appreciation · 2.17% rent growth · sell at horizon
- IRR
- -39.1%
- Equity multiple
- -0.23×
- Total profit
- $-222,662
- Equity at exit
- $96,746
- IRR
- -66.5%
- Equity multiple
- -0.94×
- Total profit
- $-352,801
- Equity at exit
- $56,101
Cash invested: $181,679 (down + closing). Projections, not guarantees.
Landlord ↔ Tenant lean methodology
- Overall (STATE)
- 90 Strongly Landlord-Friendly
- State Georgia
- 90 Strongly Landlord-Friendly · R+3
- County
- — inherits STATE
- City
- — inherits STATE
ZIP-level market 31324
- Home prices YoY
- -30.8%
- Rents YoY
- 2.2%
- Active inventory
- 483
- Price-to-rent
- 11.4×
Monthly cashflow live
- Estimated rent
- $3,395 medium interval (Pro) →
- Mortgage (P&I)
- −$3,403
- Tax est. 1.5%
- −$811 /mo · $9,733/yr
- Insurance
- −$270
- HOA
- −$0
- Vacancy / Maint / Mgmt
- −$713
- Net cashflow
- $-1,802
Break-even live
Sensitivity live
| Price | -10% $-1,353 | -5% $-1,578 | +0% $-1,802 | +5% $-2,026 | +10% $-2,250 |
|---|---|---|---|---|---|
| Rent | -10% $-2,070 | -5% $-1,936 | +0% $-1,802 | +5% $-1,668 | +10% $-1,534 |
| Rate | -1.0pp $-1,475 | -0.5pp $-1,637 | base $-1,802 | +0.5pp $-1,970 | +1.0pp $-2,141 |
UW: 25.0% down · 7.5% · 30yr · 1.5% tax · 5.0% vac · 8.0% maint · 8.0% mgmt
Financing live
Cash to close
- Down payment
- $162,213
- Closing costs
- $19,466
- Reserves months
- —
- Total cash needed
- —
Loan-product check · same deal, 3 products live
Conventional
25% down · 7.5% · 30yr
- Down + closing
- —
- Monthly P&I
- —
- Monthly cashflow
- —
- DSCR
- —
- Eligible?
- —
Personal DTI + credit; lowest rate.
DSCR
20% down · 8.5% · 30yr
- Down + closing
- —
- Monthly P&I
- —
- Monthly cashflow
- —
- DSCR
- —
- Eligible?
- —
No personal income docs; deal must DSCR.
Hard money
10% down · 12.0% · 12mo
- Down + closing
- —
- Monthly P&I
- —
- Monthly cashflow
- —
- DSCR
- —
- Eligible?
- —
Short-term bridge; refi at stabilization.
Rent comps 4 comps
| Address | Beds | Baths | Sqft | Rent | $/sqft | DOM | Units | Dist |
|---|---|---|---|---|---|---|---|---|
| 265 Blackjack Oak Dr W Richmond Hill, GA | 4.0 | 2.5 | 2750 | $3,600 | $1.31 | 45d | 1 | 0.43mi |
| 268 Heron Creek Dr Unit NA Richmond Hill, GA | 5.0 | 4.0 | 3262 | $3,500 | $1.07 | 22d | 1 | 0.85mi |
| 268 Heron Creek Dr Richmond Hill, GA | 5.0 | 4.0 | 3262 | $3,500 | $1.07 | 15d | 1 | 0.85mi |
| 62 Monterey Loop Richmond Hill, GA | 4.0 | 3.5 | 2394 | $2,975 | $1.24 | 15d | 1 | 1.43mi |
Listing history 19 events
-
2026-06-21days on market $465,990 Active 265 DOM
-
2026-06-18days on market $465,990 Active 262 DOM
-
2026-06-17days on market $465,990 Active 261 DOM
-
2026-06-16days on market $465,990 Active 260 DOM
-
2026-06-15days on market $465,990 Active 259 DOM
-
2026-06-14days on market $465,990 Active 257 DOM
-
2026-06-13days on market $465,990 Active 256 DOM
-
2026-06-10days on market $465,990 Active 254 DOM
-
2026-06-09days on market $465,990 Active 253 DOM
-
2026-06-08days on market $465,990 Active 252 DOM
-
2026-06-07days on market $465,990 Active 251 DOM
-
2026-06-05days on market $465,990 Active 248 DOM
-
2026-06-03days on market $465,990 Active 247 DOM
-
2026-06-02days on market $465,990 Active 246 DOM
-
2026-06-01days on market $465,990 Active 245 DOM
-
2026-05-31days on market $465,990 Active 244 DOM
-
2026-05-30days on market $465,990 Active 243 DOM
-
2026-01-14price $465,990 395-char remark
Show marketing remark (395 chars)
Step into the Mitchell floor plan in Richmond Hill, GA, and experience a new home design that perfectly complements your lifestyle. Enjoy the open kitchen, café, and gathering room ideal for hosting or relaxing. The spacious upstairs loft and Owner's Suite with a walk-in closet offer added convenience. Discover how this new construction blends comfort and flexibility for modern living.
-
2025-09-29$477,990 Active 395-char remark
Show marketing remark (395 chars)
Step into the Mitchell floor plan in Richmond Hill, GA, and experience a new home design that perfectly complements your lifestyle. Enjoy the open kitchen, café, and gathering room ideal for hosting or relaxing. The spacious upstairs loft and Owner's Suite with a walk-in closet offer added convenience. Discover how this new construction blends comfort and flexibility for modern living.
ⓘ Source: listings_history table (triggers on properties + properties_extension) + one-shot
backfill from property_details.listing_events for pre-trigger history.
Nearby sold comps map
Loading sold comps map…
Walkable amenities ~0.75 mi
Loading nearby amenities…
Taxation est. · year 1
- Rental income
- $40,743
- − Mortgage interest
- −$36,346
- − Property taxes
- −$9,733
- − Insurance
- −$3,244
- − Repairs & maintenance
- −$3,259
- − Management
- −$3,259
- − Depreciation
- −$18,876
- Taxable loss
- −$33,974
- Est. tax savings @ 24.0%
- +$8,154
- After-tax cash flow
- $-13,468/yr
For passive investors: Depreciation is non-cash, so a rental often shows a tax loss while cash-flowing — sheltering income. Rental losses are passive: they offset passive income freely, and up to $25,000/yr can offset ordinary (W-2) income if you actively participate and your MAGI is under $100k (phasing out to $0 by $150k); unused losses carry forward. On sale, claimed depreciation is recaptured at up to 25%, and gains may owe capital-gains tax (a 1031 exchange can defer both). Figures are a year-1 estimate at your 24.0% rate — not tax advice; consult a CPA.
Schools (NCES district)
- District
- Bryan County
- NCES district ID
- 1300570
- Math proficiency
- 49% ▼ -2.00%
- Reading proficiency
- 53% ▼ -2.00%
- Median HH income
- $64,465
- Composite
- 44.99/100
- National rank
- #2701
- State rank
- #14 of 174 in GA
Livability — Savannah
- Score
- 86/100
- State rank
- #1
- US rank
- #397
Category grades
Schools grade is shown separately in the Schools card above.
Census & demographics
- County
- Bryan County · 37,406 people
- City population
- 216,564
- Metro
- Savannah, GA
- Population (ZIP)
- 37,406
- Household income
- $122,378
- Rent vs Own
- Severe rent burden
- 562.0
Population outlook (Bryan County) Hauer SSP2
- Today (2025)
- 45,980 people
- By 2030
- 51,583 · +12.2%
- By 2040
- 63,184 · +37.4%
- By 2050
- 75,400 · +64.0%
- By 2075
- 105,363 · +129.1%
- By 2100
- 124,959 · +171.8%
Race, ethnicity, and origin ACS 2023
- Neighborhood character
- Predominantly White (70%)
- Race & ethnicity
- White 70% Black 12% Hispanic / Latino 9% Two or more races 8% Asian 3%
- Hispanic origin (detail)
- Mexican 2% Puerto Rican 5%
- Common ancestry
- Lithuanian 3% Romanian 2% Slovak 2%
- Foreign-born
- 6% · Canada, Jamaica
- Languages at home
- 89% English-only · Spanish 7% Other Indo-European 2% German/W. Germanic 1%
Political lean MEDSL · Bryan
- 2024 margin
- Solid R (+36.3) · D 31.6% · R 67.9%
- 2008→2024 swing
- +6.3pp toward D · 2008: -42.6pp · 2024: -36.3pp
- All cycles
- 2024: R+36.3 2020: R+35.2 2016: R+43.2 2012: R+43.6 2008: R+42.6
Not yet ingested
- Civics
- —
Market trends
- HPI YoY
- ▼ -95.54%
- Current HPI
- 215.1789
- Rent YoY
- ▲ 2.17%
- Metro
- Savannah, GA
- State GDP YoY
- ▲ 2.66%
- F500 in state
- 28
Industry mix (Fortune 500 HQ in GA)
| Industry | F500 HQs | Revenue |
|---|---|---|
| Paper / Packaging | 2 | $29B |
|
||
| Retail | 1 | $160B |
|
||
| Transportation / Logistics | 1 | $91B |
|
||
| Airlines | 1 | $62B |
|
||
| Consumer Goods | 1 | $47B |
|
||
| Utilities | 1 | $25B |
|
||
Price history
-2.5% since first listed2 events — show timeline
- 2026-01-14 Price Changed $465,990 Zillow
- 2025-09-29 Listed $477,990 Zillow
Cash-flow waterfall
monthlySold comps — $/sqft
last 12 mo · ≤1 miLoading sold comps…