 Duplex
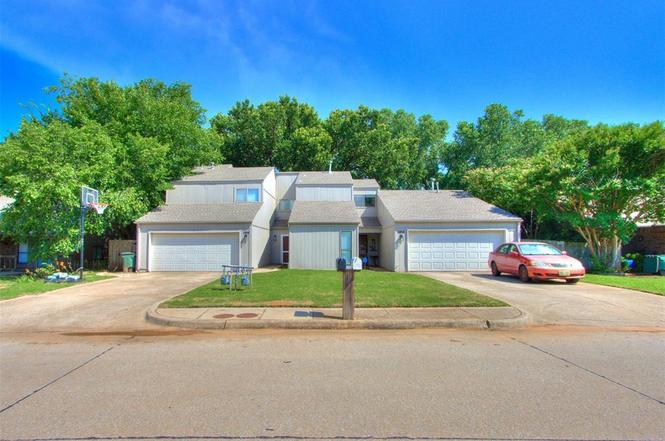
1404 Mary Lee Ln · Edmond, OK
Flood risk 1/10 · Minimal
- FEMA flood zone
- X (unshaded)
- Chance of flooding over 30 yrs
- 0.0%
- Est. flood insurance / yr
- $507 – $1,088
Fire risk 1/10 · Minimal
- Est. fire insurance / yr
- $2,463 – $4,575
Heat risk 6/10 · Moderate
- Hot days now (above 108°F)
- 7 days/yr
- Hot days in 30 yrs
- 19 days/yr
Wind risk 2/10 · Minimal
- Chance of severe wind over 30 yrs
- 4.0%
Air-quality risk 2/10 · Minimal
- Unhealthy air days now
- 2 days/yr
- Unhealthy air days in 30 yrs
- 2 days/yr
Risk factors via First Street. Map © Google.
Why this score? — see what drove the D grade
The composite is a weighted blend of 9 inputs, each scored 0–100. Each bar is that input's sub-score; the figure is the points it added to the 100-point composite (weight × sub-score).
- Cash flow +12.9/30.0
- ARV discount +7.5/15.0
- DSCR +3.9/10.0
- Livability +3.9/5.0
- Schools +3.6/10.0
- 1% rule +3.4/10.0
- Rent growth +3.1/5.0
- Condition / age +2.5/5.0
- Appreciation +0.0/10.0
$375,000
🖨 Deal sheet 📄 Offer letter ✓ Due diligence
Multi-family units
County records classify this as Multi-Family (2-4 Unit). Listing-text estimate: 2 units. confirmed
Listing remarks
Great Location! Great Location! East Edmond investment property ready for takeover! This duplex is available and ready to start your real estate investment goals or add to your existing portfolio. 1404: 2 Bed/2.5 Bath 1406: 3 Bed/ 2 Bath This property is spacious & accommodating for tenants with various needs. Great bedrooms, functionally sized kitchens, 2-car garages & great floor plans make this property more than just a great location near amenities and highway access. Walking Distance to Elementary, Middle School and High School! The fenced backyard spaces are positioned by the creek just behind the property line and the wooded space provides optimal privacy. SEller is selli
Key facts
- Wooded space
- 0.35 acre lot
- Built 1979
Tags
Property features AI
Finance
- Other: Two-unit property (duplex) — residential income
- Financial info: Active listing; Price reduced previously; Current price $375,000; Days on market: 174; Living area reported as 3,190 (assessor); Tax amount available
- HOA & community: No mandatory association dues
Exterior
- Home design: Duplex residential income property; Existing property
- Construction: Frame and other construction materials; Shingle roof; Slab foundation; Built (existing)
- Exterior features: Interior lot
Interior
- Bedrooms: 5 bedrooms
- Bathrooms: 4 full bathrooms; 1 half bathroom
- Interior features: Two fireplaces; Vacant
Neighborhood map
What this means for you Summary
Snapshot
- This is a 2 × 2.0-bed/2.5-bath units multifamily listed at $375k.
Deal economics
- At list price, monthly cash flow is $-26 ($-313/yr) — negative. Per door: $-13/mo.
- To cash-flow at today's rent, offer at most $370k (1.2% below list).
- To meet the 1% rule (rent ≥ 1% of price), the offer needs to be $314k (16.4% below list).
- Recommended offer: $314k (16.4% below list) — sets the bar for 1% rule.
- Cap rate 6.2% vs local median 3.4% in Edmond — top-decile yield for the area; either an underpriced asset or a hidden risk that comps aren't pricing in. Stress-test before assuming the spread holds.
Location & tenants
- Location reads 78/100 on livability (#6 in OK, #2,383 nationally) — a middle-class / working-renter tenant base. Strengths: employment A+, housing A+, crime A-; Watch: health & safety C-, commute F.
- Edmond (suburban): math 38% / reading 40% proficiency, ranked #11 of 270 in OK (top 4%) — families likely to look elsewhere, expect single-tenant / working-renter base with shorter leases.
- Zoned schools: Will Rogers Es (math 32% / reading 31%, grade F, #241 of 845 statewide, top 29%, 642 students, 0% FRL); Memorial Hs (math 44% / reading 56%, grade D+, #4 of 447 statewide, top 1%, 2,605 students, 0% FRL) — zoned schools average 0% FRL vs 22% district-wide (22 pts lower); this property's tenant base skews higher-income than the district average.
- Market conditions: Rents rising (+2.5%/yr); 763 active listings in the ZIP; 3 comparable units currently listed for rent nearby; rentals leasing fast (median 4d on market — plan ~1-2 weeks tenant-placement turnaround); solid renter incomes; 5,365 units permitted in Oklahoma County in 2024 (569 in 5+ unit buildings).
- This rent runs 34% of the median local income ($110k/yr) — at the standard rent-burdened threshold; future hikes will face affordability resistance.
Forward outlook
- Local home prices are declining (-3.0%/yr); year-one equity from $3k of loan paydown is wiped out by about $11k of value loss. Plan a longer hold.
- Oklahoma County population projected at +41% by 2050 — long-run rental-demand tailwind backs the buy-and-hold thesis.
Negotiation context
- It's been on market 202 days — a 12% lower offer ($330k) is reasonable based on typical stale-listing flexibility.
- 4 sale attempts since 13y ago; this cycle's ask has dropped $24k (6%) from the opening price — seller is motivated, your offer sets the floor, not the list.
- Current owner paid $230k; list at $375k implies a 63% gain — meaningful room to come down on a strong offer.
Risks & watch-outs
- Climate carrying-cost: extreme-heat days projected 7→19/yr by 2055 (HVAC capex compounding) — expect insurance premiums to compound above CPI over the hold.
Questions for the listing agent
- What do current leases actually rent for vs. the listed asking? Can we see a recent rent roll and the last 12 months of T-12 income?
- It's been on market 202 days. Have you received any prior offers? Is the seller open to a 16% concession, seller financing, or rate buy-down credit?
- Can we see the unit-by-unit rent roll, current vacancy, and any below-market leases? What's the average tenancy length?
- What capital expenditures (roof, boiler, parking lot, exteriors) have been made in the last 5 years, and what's planned in the next 2?
- Built in 1979 — when were the roof, HVAC, electrical panel, plumbing, and water heater last replaced?
- Why hasn't it sold? Are there any deal-killer items the seller is aware of (foundation, flood, title, zoning, code violations)?
- Is there a deadline driving the sale (1031 exchange, divorce, estate, relocation)? That informs how much negotiation room exists.
- Schools are A-rated — typically a magnet for longer-tenancy family renters. What's the average tenant stay here, and is there a school-zone premium baked into asking?
- The area grade is low — what's the realistic commute time and amenity access for the typical tenant pool here? Any planned neighborhood developments (good or bad) we should know about?
- What's the average days-on-market for RENTAL listings here right now (not sales)? A rising rental-DOM trend means longer vacancies and softer asking-rent achievability than the comps imply.
- What's the recent tenant-quality profile in this submarket — average credit score on applications, eviction rate, late-payment / NSF rate, and stable-employment percentage? A property-management company in the area should have these aggregated.
- How much new apartment / multifamily construction is in the pipeline within 1–3 miles? Heavy new supply (>2% of stock underway) typically softens rents 12–24 months out; light construction supports rent growth.
Investment metrics
- 1% rule
- 0.84% ✗
- Cap rate
- 6.21%
- Cash-on-cash
- -0.30%
- DSCR
- 0.99
- GRM
- 10.0
CMA / ARV
No comps found within radius.
Projected returns pro-forma
-3.0% appreciation · 2.49% rent growth · sell at horizon
- IRR
- -17.4%
- Equity multiple
- 0.39×
- Total profit
- $-64,035
- Equity at exit
- $55,914
- IRR
- -10.3%
- Equity multiple
- 0.39×
- Total profit
- $-64,429
- Equity at exit
- $32,423
Cash invested: $105,000 (down + closing). Projections, not guarantees.
Landlord ↔ Tenant lean methodology
- Overall (STATE)
- 83 Strongly Landlord-Friendly
- State Oklahoma
- 83 Strongly Landlord-Friendly · R+20
- County
- — inherits STATE
- City
- — inherits STATE
ZIP-level market 73034
- Rents YoY
- 2.5%
- Active inventory
- 763
- Price-to-rent
- 19.9×
Monthly cashflow live
- Estimated rent
- $3,135 high interval (Pro) →
- Mortgage (P&I)
- −$1,967
- Tax from tax record
- −$380 /mo · $4,559/yr
- Insurance
- −$156
- HOA
- −$0
- Vacancy / Maint / Mgmt
- −$658
- Net cashflow
- $-26
Break-even live
2-unit breakdown (identical units grouped — click to expand)
| Units | Beds | Baths | Est. rent |
|---|---|---|---|
| 2× units | 2.0 | 2.5 | $3,134 |
| #1 | 2.0 | 2.5 | $1,567 |
| #2 | 2.0 | 2.5 | $1,567 |
| Total (2 units) | $3,135 | ||
UW: 25.0% down · 7.5% · 30yr · 1.5% tax · 5.0% vac · 8.0% maint · 8.0% mgmt
Financing live
Cash to close
- Down payment
- $93,750
- Closing costs
- $11,250
- Reserves months
- —
- Total cash needed
- —
Loan-product check · same deal, 3 products live
Conventional
25% down · 7.5% · 30yr
- Down + closing
- —
- Monthly P&I
- —
- Monthly cashflow
- —
- DSCR
- —
- Eligible?
- —
Personal DTI + credit; lowest rate.
DSCR
20% down · 8.5% · 30yr
- Down + closing
- —
- Monthly P&I
- —
- Monthly cashflow
- —
- DSCR
- —
- Eligible?
- —
No personal income docs; deal must DSCR.
Hard money
10% down · 12.0% · 12mo
- Down + closing
- —
- Monthly P&I
- —
- Monthly cashflow
- —
- DSCR
- —
- Eligible?
- —
Short-term bridge; refi at stabilization.
Rent comps 3 comps
| Address | Beds | Baths | Sqft | Rent | $/sqft | DOM | Units | Dist |
|---|---|---|---|---|---|---|---|---|
| 1300 Cedar Vw Edmond, OK | 3.0 | 2.5 | 2170 | $2,115 | $0.97 | 4d | 1 | 0.60mi |
| 609 Abadan Dr Edmond, OK | 3.0 | 3.5 | 2292 | $2,500 | $1.09 | 2d | 1 | 1.36mi |
| 616 Abadan Dr Edmond, OK | 3.0 | 3.5 | 2412 | $2,400 | $1.00 | 14d | 1 | 1.36mi |
Listing history 27 events
-
2026-06-18days on market $375,000 Active 202 DOM
-
2026-06-17days on market $375,000 Active 201 DOM
-
2026-06-16days on market $375,000 Active 200 DOM
-
2026-06-15days on market $375,000 Active 199 DOM
-
2026-06-13days on market $375,000 Active 197 DOM
-
2026-06-09days on market $375,000 Active 193 DOM
-
2026-06-08days on market $375,000 Active 192 DOM
-
2026-06-07days on market $375,000 Active 191 DOM
-
2026-06-03days on market $375,000 Active 187 DOM
-
2026-06-02days on market $375,000 Active 186 DOM
-
2026-06-01days on market $375,000 Active 185 DOM
-
2026-05-31days on market $375,000 Active 184 DOM
-
2026-05-20price $375,000
-
2026-03-11price $389,900
-
2025-11-27$399,000 Active
-
2025-11-13historical
-
2025-11-10price $398,000
-
2025-11-10status Active
-
2025-10-24status Pending
-
2025-09-23price $405,000
-
2025-08-31price $419,000
-
2025-08-11price $429,000
-
2025-07-11$449,000 Active
-
2018-06-08soldstatus $230,000
-
2014-02-03historical
-
2013-11-04$215,000
-
1993-07-01soldstatus $75,000
ⓘ Source: listings_history table (triggers on properties + properties_extension) + one-shot
backfill from property_details.listing_events for pre-trigger history.
Tax reassessment forecast OK · Resets to sale price
- Current annual tax
- $4,559 · $380/mo
- Projected year-2 tax
- $4,559 · $380/mo
- Expected delta
- $0/yr ($0/mo · 0.0%)
ⓘ Screening estimate from a state-policy table — verify with the county assessor before closing.
Climate risk First Street
- Flood 1/10 Low FEMA zone X (unshaded) · 0% chance over 30 yrs
- Wildfire 1/10 Low
- Heat 6/10 Major 7 d/yr ≥108°F today · 19 d/yr by 30 yrs out
- Wind 2/10 Low 4% chance of damaging wind over 30 yrs
- Air quality 2/10 Low 2 unhealthy d/yr today · 2 by 30 yrs out
Nearby sold comps map
Loading sold comps map…
Walkable amenities ~0.75 mi
Loading nearby amenities…
Taxation est. · year 1
- Rental income
- $37,620
- − Mortgage interest
- −$21,006
- − Property taxes
- −$4,559
- − Insurance
- −$1,875
- − Repairs & maintenance
- −$3,010
- − Management
- −$3,010
- − Depreciation
- −$10,909
- Taxable loss
- −$6,748
- Est. tax savings @ 24.0%
- +$1,620
- After-tax cash flow
- $1,307/yr
For passive investors: Depreciation is non-cash, so a rental often shows a tax loss while cash-flowing — sheltering income. Rental losses are passive: they offset passive income freely, and up to $25,000/yr can offset ordinary (W-2) income if you actively participate and your MAGI is under $100k (phasing out to $0 by $150k); unused losses carry forward. On sale, claimed depreciation is recaptured at up to 25%, and gains may owe capital-gains tax (a 1031 exchange can defer both). Figures are a year-1 estimate at your 24.0% rate — not tax advice; consult a CPA.
Schools (NCES district)
- District
- Edmond
- NCES district ID
- 4010590
- Math proficiency
- 38% ▼ -12.00%
- Reading proficiency
- 40% ▼ -12.00%
- Median HH income
- $73,212
- Composite
- 35.88/100
- National rank
- #4814
- State rank
- #11 of 270 in OK
Livability — Edmond
- Score
- 78/100
- State rank
- #6
- US rank
- #2383
Category grades
Schools grade is shown separately in the Schools card above.
Census & demographics
- Census place
- Edmond, OK
- County
- Oklahoma County · 771,644 people
- City population
- 177,083
- Metro
- Oklahoma City, OK
- Population (ZIP)
- 48,831
- Household income
- $109,700
- Rent vs Own
- Severe rent burden
- 1198.0
Population outlook (Oklahoma County) Hauer SSP2
- Today (2025)
- 911,875 people
- By 2030
- 982,413 · +7.7%
- By 2040
- 1,130,468 · +24.0%
- By 2050
- 1,288,422 · +41.3%
- By 2075
- 1,711,482 · +87.7%
- By 2100
- 2,088,448 · +129.0%
Race, ethnicity, and origin ACS 2023
- Neighborhood character
- Predominantly White (76%)
- Race & ethnicity
- White 76% Two or more races 10% Hispanic / Latino 8% Asian 4% Black 3% Native American 3%
- Hispanic origin (detail)
- Mexican 4%
- Common ancestry
- Italian 4% Slovak 3% Lithuanian 3%
- Foreign-born
- 6% · Canada, China, Vietnam
- Languages at home
- 92% English-only · Spanish 4% Other Indo-European 1% Chinese 1%
Political lean MEDSL · Oklahoma
- 2024 margin
- Toss-up / Even · D 48.0% · R 49.7% · Other 2.3%
- 2008→2024 swing
- +15.1pp toward D · 2008: -16.8pp · 2024: -1.7pp
- All cycles
- 2024: R+1.7 2020: R+1.1 2016: R+10.5 2012: R+16.7 2008: R+16.8
Not yet ingested
- Civics
- —
Market trends
- HPI YoY
- ▼ -164.67%
- Current HPI
- 223.1391
- Rent YoY
- ▲ 2.49%
- Metro
- Oklahoma City, OK
- State GDP YoY
- ▲ 1.55%
- F500 in state
- 6
Industry mix (Fortune 500 HQ in OK)
| Industry | F500 HQs | Revenue |
|---|---|---|
| Energy | 3 | $48B |
|
||
Price history
+400.0% since first listed15 events — show timeline
- 2026-05-20 Price Changed $375,000 MLSOK
- 2026-03-11 Price Changed $389,900 MLSOK
- 2025-11-27 Listed $399,000 MLSOK
- 2025-11-13 Listing Removed — MLSOK
- 2025-11-10 Price Changed $398,000 MLSOK
- 2025-11-10 Relisted — MLSOK
- 2025-10-24 Pending — MLSOK
- 2025-09-23 Price Changed $405,000 MLSOK
- 2025-08-31 Price Changed $419,000 MLSOK
- 2025-08-11 Price Changed $429,000 MLSOK
- 2025-07-11 Listed $449,000 MLSOK
- 2018-06-08 Sold (Public Records) $230,000 Public Records
- 2014-02-03 Listing Removed — MLSOK
- 2013-11-04 Listed $215,000 MLSOK
- 1993-07-01 Sold (Public Records) $75,000 Public Records
Property tax history
+6.8%/yrLatest (2025): $4,559 · +5.1% YoY. Source: county tax records.
Cash-flow waterfall
monthlySold comps — $/sqft
last 12 mo · ≤1 miLoading sold comps…