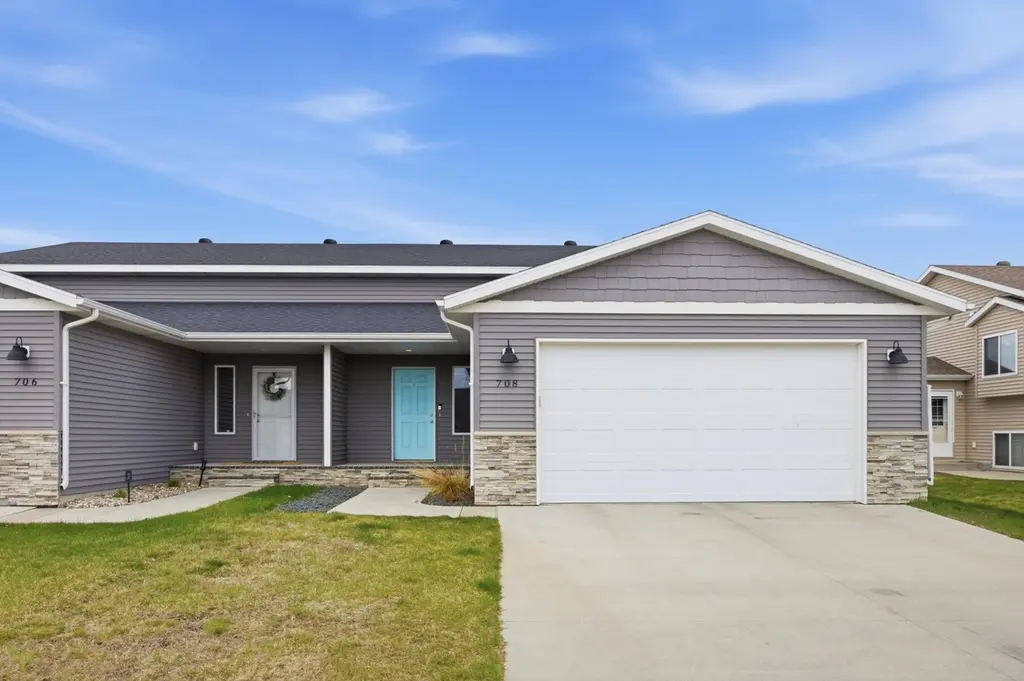
708 3rd Ave NE · Dilworth, MN
Flood risk 1/10 · Minimal
- FEMA flood zone
- X (unshaded)
- Chance of flooding over 30 yrs
- 0.0%
- Est. flood insurance / yr
- $473 – $860
Fire risk 1/10 · Minimal
- Est. fire insurance / yr
- $888 – $1,650
Heat risk 2/10 · Minimal
- Hot days now (above 98°F)
- 7 days/yr
- Hot days in 30 yrs
- 12 days/yr
Wind risk 2/10 · Minimal
- Chance of severe wind over 30 yrs
- —
Air-quality risk 3/10 · Minor
- Unhealthy air days now
- 3 days/yr
- Unhealthy air days in 30 yrs
- 3 days/yr
Risk factors via First Street. Map © Google.
Why this score? — see what drove the D grade
The composite is a weighted blend of 9 inputs, each scored 0–100. Each bar is that input's sub-score; the figure is the points it added to the 100-point composite (weight × sub-score).
- Cash flow +12.8/30.0
- ARV discount +7.5/15.0
- Condition / age +4.0/5.0
- DSCR +3.8/10.0
- 1% rule +3.7/10.0
- Schools +3.7/10.0
- Livability +3.6/5.0
- Rent growth +2.5/5.0
- Appreciation +0.0/10.0
$299,500
🖨 Deal sheet (PDF) 📄 Offer letter ✓ Due diligence
Listing remarks MLS
LOW SPECIALS $ 1896.00 left. Beautiful 3 bedroom, 3 bath and 2 stall garage. SS appliances included. Great amenities and already has a deck. Nice floor plan. Line up showing today.
Key facts
- Laminate flooring
- Stylish kitchen
- Modern mechanicals
Tags
Property features AI
Finance
- Other: Total living area approx. 1,780 sq ft; Above-grade finished area and main level approx. 880; Below-grade finished area listed separately
Exterior
- Parking: Attached 2-car garage (22 x 24)
- Utilities: City water; City sewer; Natural gas
- Home design: Residential attached property; Split-entry (bi-level) design; Entry foyer on main level
- Construction: Poured concrete foundation
- Exterior features: Vinyl exterior; Deck on upper level; 40 x 120 lot (4,800 sq ft)
Interior
- Kitchen: Range; Microwave; Dishwasher; Refrigerator
- Bedrooms: 3 bedrooms (primary on upper level; others on lower level)
- Bathrooms: 1 full bath; 1 three-quarter bath; 1 half bath; Primary bathroom on upper level
- Heating & cooling: Forced air heating; Central air conditioning
- Interior features: Finished basement; Air-to-air exchanger; Vaulted common areas implied by split-entry layout
- Laundry & utility: Laundry room on lower level; Washer; Dryer; Electric water heater; Utility room on lower level
Neighborhood map
What this means for you Summary
Snapshot
- This is a 3-bed/3.0-bath single-family listed at $300k. Condition is rated good.
Deal economics
- At list price, monthly cash flow is $-28 ($-339/yr) — negative.
- To cash-flow at today's rent, offer at most $295k (1.7% below list).
- To meet the 1% rule (rent ≥ 1% of price), the offer needs to be $260k (13.2% below list).
- Recommended offer: $260k (13.2% below list) — sets the bar for 1% rule.
- Cap rate 6.2% vs local median 3.8% in Dilworth — top-decile yield for the area; either an underpriced asset or a hidden risk that comps aren't pricing in. Stress-test before assuming the spread holds.
Location & tenants
- Location reads 72/100 on livability (#275 in MN) — a middle-class / working-renter tenant base. Strengths: housing A+, health & safety A+, employment A; Watch: crime F, amenities F, commute F.
- Moorhead Public School District (suburban): math 39% / reading 46% proficiency, ranked #202 of 301 in MN (top 67%) — families likely to look elsewhere, expect single-tenant / working-renter base with shorter leases.
- Zoned schools: Robert Asp Elementary (math 46% / reading 43%, grade F, #534 of 857 statewide, top 66%, 611 students, 59% FRL); Horizon Middle School (math 35% / reading 46%, grade F, #144 of 258 statewide, top 56%, 2,158 students, 48% FRL); Moorhead High School (math 44% / reading 59%, grade D+, #124 of 471 statewide, top 27%, 1,937 students, 40% FRL).
- Market conditions: 33 active listings in the ZIP; 1 comparable units currently listed for rent nearby; 269 units permitted in Clay County in 2024 (153 in 5+ unit buildings).
Forward outlook
- Local home prices are declining (-3.0%/yr); year-one equity from $2k of loan paydown is wiped out by about $9k of value loss. Plan a longer hold.
- Clay County population projected at +23% by 2050 — long-run rental-demand tailwind backs the buy-and-hold thesis.
Negotiation context
- It's been on market 51 days — a 3% lower offer ($291k) is reasonable based on typical stale-listing flexibility.
- 2 sale attempts since 6y ago; this cycle's ask has dropped $20k (6%) from the opening price — seller is motivated, your offer sets the floor, not the list.
- Current owner paid $240k; 25% above their basis — modest negotiation headroom, anchor on the comps not their cost.
Questions for the listing agent
- What do current leases actually rent for vs. the listed asking? Can we see a recent rent roll and the last 12 months of T-12 income?
- It's been on market 51 days. Have you received any prior offers? Is the seller open to a 13% concession, seller financing, or rate buy-down credit?
- Is there a deadline driving the sale (1031 exchange, divorce, estate, relocation)? That informs how much negotiation room exists.
- Schools are A-rated — typically a magnet for longer-tenancy family renters. What's the average tenant stay here, and is there a school-zone premium baked into asking?
- Crime grade is F in this area — have there been break-ins, vandalism, or insurance claims at this property in the last 3 years? What carrier currently insures it and at what premium?
- The area grade is low — what's the realistic commute time and amenity access for the typical tenant pool here? Any planned neighborhood developments (good or bad) we should know about?
- What's the average days-on-market for RENTAL listings here right now (not sales)? A rising rental-DOM trend means longer vacancies and softer asking-rent achievability than the comps imply.
- What's the recent tenant-quality profile in this submarket — average credit score on applications, eviction rate, late-payment / NSF rate, and stable-employment percentage? A property-management company in the area should have these aggregated.
- How much new for-sale + rental construction is in the pipeline within 1–3 miles? Heavy new supply typically softens prices + rents 12–24 months out; constrained supply supports both.
Investment metrics
- 1% rule
- 0.87% ✗
- Cap rate
- 6.18%
- Cash-on-cash
- -0.40%
- DSCR
- 0.98
- GRM
- 9.6
CMA / ARV
No comps found within radius.
Projected returns pro-forma
-3.0% appreciation · 3.0% rent growth · sell at horizon
- IRR
- -16.9%
- Equity multiple
- 0.40×
- Total profit
- $-50,283
- Equity at exit
- $44,656
- IRR
- -8.8%
- Equity multiple
- 0.45×
- Total profit
- $-45,911
- Equity at exit
- $25,895
Cash invested: $83,860 (down + closing). Projections, not guarantees.
Landlord ↔ Tenant lean methodology
- Overall (STATE)
- 46 Balanced
- State Minnesota
- 46 Balanced · D+2
- County
- — inherits STATE
- City
- — inherits STATE
ZIP-level market 56529
- Home prices YoY
- -33.9%
- Active inventory
- 33
- Price-to-rent
- 9.6×
Monthly cashflow live
- Estimated rent
- $2,600 medium interval (Pro) →
- Mortgage (P&I)
- −$1,571
- Tax from tax record
- −$387 /mo · $4,642/yr
- Insurance
- −$125
- HOA
- −$0
- Vacancy / Maint / Mgmt
- −$546
- Net cashflow
- $-28
Break-even live
Sensitivity live
| Price | -10% $141 | -5% $57 | +0% $-28 | +5% $-113 | +10% $-198 |
|---|---|---|---|---|---|
| Rent | -10% $-234 | -5% $-131 | +0% $-28 | +5% $74 | +10% $177 |
| Rate | -1.0pp $123 | -0.5pp $48 | base $-28 | +0.5pp $-106 | +1.0pp $-185 |
UW: 25.0% down · 7.5% · 30yr · 1.5% tax · 5.0% vac · 8.0% maint · 8.0% mgmt
Financing live
Cash to close
- Down payment
- $74,875
- Closing costs
- $8,985
- Reserves months
- —
- Total cash needed
- —
Loan-product check · same deal, 3 products live
Conventional
25% down · 7.5% · 30yr
- Down + closing
- —
- Monthly P&I
- —
- Monthly cashflow
- —
- DSCR
- —
- Eligible?
- —
Personal DTI + credit; lowest rate.
DSCR
20% down · 8.5% · 30yr
- Down + closing
- —
- Monthly P&I
- —
- Monthly cashflow
- —
- DSCR
- —
- Eligible?
- —
No personal income docs; deal must DSCR.
Hard money
10% down · 12.0% · 12mo
- Down + closing
- —
- Monthly P&I
- —
- Monthly cashflow
- —
- DSCR
- —
- Eligible?
- —
Short-term bridge; refi at stabilization.
Rent comps 1 comps
| Address | Beds | Baths | Sqft | Rent | $/sqft | DOM | Units | Dist |
|---|---|---|---|---|---|---|---|---|
| 1521 Keystone Cir NE Dilworth, MN | 4.0 | 2.0 | 2200 | $2,600 | $1.18 | 15d | 1 | 0.65mi |
Listing history 20 events
-
2026-06-22days on market $299,500 Active 51 DOM
-
2026-06-18days on market $299,500 Active 48 DOM
-
2026-06-17days on market $299,500 Active 47 DOM
-
2026-06-16days on market $299,500 Active 46 DOM
-
2026-06-15days on market $299,500 Active 45 DOM
-
2026-06-14days on market $299,500 Active 43 DOM
-
2026-06-13days on market $299,500 Active 42 DOM
-
2026-06-10days on market $299,500 Active 40 DOM
-
2026-06-09days on market $299,500 Active 39 DOM
-
2026-06-08days on market $299,500 Active 38 DOM
-
2026-06-07days on market $299,500 Active 37 DOM
-
2026-06-05days on market $299,500 Active 34 DOM
-
2026-06-03days on market $299,500 Active 33 DOM
-
2026-06-02days on market $299,500 Active 32 DOM
-
2026-06-01days on market $299,500 Active 31 DOM
-
2026-05-31days on market $299,500 Active 30 DOM
-
2026-05-30days on market $299,500 Active 29 DOM
-
2026-05-01$319,900 Active 913-char remark
-
2020-05-15soldstatus $239,900 185-char remark
Show marketing remark (185 chars)
LOW SPECIALS $ 1896.00 left. Beautiful 3 bedroom, 3 bath and 2 stall garage. SS appliances included. Great amenities and already has a deck. Nice floor plan. Line up showing today.
-
2020-02-18$239,900 185-char remark
Show marketing remark (185 chars)
LOW SPECIALS $ 1896.00 left. Beautiful 3 bedroom, 3 bath and 2 stall garage. SS appliances included. Great amenities and already has a deck. Nice floor plan. Line up showing today.
ⓘ Source: listings_history table (triggers on properties + properties_extension) + one-shot
backfill from property_details.listing_events for pre-trigger history.
Tax reassessment forecast MN · Partial reset (capped growth)
- Current annual tax
- $4,642 · $387/mo
- Projected year-2 tax
- $4,642 · $387/mo
- Expected delta
- $0/yr ($0/mo · 0.0%)
ⓘ Screening estimate from a state-policy table — verify with the county assessor before closing.
Climate risk First Street
- Flood 1/10 Low FEMA zone X (unshaded) · 0% chance over 30 yrs
- Wildfire 1/10 Low
- Heat 2/10 Low 7 d/yr ≥98°F today · 12 d/yr by 30 yrs out
- Wind 2/10 Low
- Air quality 3/10 Moderate 3 unhealthy d/yr today · 3 by 30 yrs out
Nearby sold comps map
Loading sold comps map…
Walkable amenities ~0.75 mi
Loading nearby amenities…
Taxation est. · year 1
- Rental income
- $31,200
- − Mortgage interest
- −$16,777
- − Property taxes
- −$4,642
- − Insurance
- −$1,498
- − Repairs & maintenance
- −$2,496
- − Management
- −$2,496
- − Depreciation
- −$8,713
- Taxable loss
- −$5,421
- Est. tax savings @ 24.0%
- +$1,301
- After-tax cash flow
- $962/yr
For passive investors: Depreciation is non-cash, so a rental often shows a tax loss while cash-flowing — sheltering income. Rental losses are passive: they offset passive income freely, and up to $25,000/yr can offset ordinary (W-2) income if you actively participate and your MAGI is under $100k (phasing out to $0 by $150k); unused losses carry forward. On sale, claimed depreciation is recaptured at up to 25%, and gains may owe capital-gains tax (a 1031 exchange can defer both). Figures are a year-1 estimate at your 24.0% rate — not tax advice; consult a CPA.
Condition & rehab AI · 12 photos
This 2019-built twin home by BMW Homes is in good condition with modern design and quality finishes. It offers a good return on investment with minor updates to enhance curb appeal and functionality.
Value-add opportunities
- Resale Paint exterior siding — Enhances curb appeal and value
- Resale Replace carpet in bedrooms — Fresh carpet improves comfort and value
- Resale Replace kitchen countertops — Modern countertops add value and functionality
- Resale Replace bathroom fixtures — Modern fixtures enhance aesthetics and functionality
Renovation cost estimate screening
Value-add ROI direction
- Resale Paint exterior siding — Enhances curb appeal and value ↑
- Resale Replace carpet in bedrooms — Fresh carpet improves comfort and value ↑
- Resale Replace kitchen countertops — Modern countertops add value and functionality ↑
- Resale Replace bathroom fixtures — Modern fixtures enhance aesthetics and functionality ↑
ⓘ Cost ranges are severity-bucket heuristics (US national rule-of-thumb). Get contractor quotes + a written scope before underwriting a rehab budget.
Schools (NCES district)
- District
- Moorhead Public School District
- NCES district ID
- 2721420
- Math proficiency
- 39% ▼ -8.00%
- Reading proficiency
- 46% ▼ -6.00%
- Median HH income
- $53,009
- Composite
- 36.83/100
- National rank
- #4560
- State rank
- #202 of 301 in MN
Livability — Dilworth
- Score
- 72/100
- State rank
- #275
- US rank
- #5975
Category grades
Schools grade is shown separately in the Schools card above.
Census & demographics
- Census place
- Dilworth, MN
- City population
- 4,664
- Population (ZIP)
- 4,664
Population outlook (Clay County) Hauer SSP2
- Today (2025)
- 67,880 people
- By 2030
- 70,881 · +4.4%
- By 2040
- 76,865 · +13.2%
- By 2050
- 83,205 · +22.6%
- By 2075
- 98,719 · +45.4%
- By 2100
- 111,657 · +64.5%
Race, ethnicity, and origin ACS 2023
- Neighborhood character
- Predominantly White (87%)
- Race & ethnicity
- White 87% Two or more races 7% Hispanic / Latino 6% Black 5%
- Hispanic origin (detail)
- Mexican 3%
- Common ancestry
- Portuguese 29% Scottish 6% Scotch-Irish 2%
- Foreign-born
- 2%
- Languages at home
- 89% English-only · Arabic 5% Spanish 3% Other Indo-European 2%
Political lean MEDSL · Clay
- 2024 margin
- Toss-up / Even · D 49.2% · R 48.8% · Other 2.0%
- 2008→2024 swing
- -15.5pp toward R · 2008: 16.0pp · 2024: 0.5pp
- All cycles
- 2024: D+0.5 2020: D+4.1 2016: R+2.0 2012: D+8.0 2008: D+16.0
Not yet ingested
- Civics
- —
Market trends
- HPI YoY
- ▼ -95.98%
- Current HPI
- 187.1235
- Rent YoY
- —
- Metro
- —
- State GDP YoY
- ▲ 2.41%
- F500 in state
- 34
Industry mix (Fortune 500 HQ in MN)
| Industry | F500 HQs | Revenue |
|---|---|---|
| Healthcare | 2 | $407B |
|
||
| Retail | 2 | $150B |
|
||
| Consumer Goods | 2 | $32B |
|
||
| Industrial Machinery | 2 | $6B |
|
||
| Agriculture | 1 | $40B |
|
||
| Healthcare / Medical Devices | 1 | $32B |
|
||
Price history
+24.8% since first listed4 events — show timeline
- 2026-05-25 Price Changed $299,500 NORTHSTARMLS as Distributed by MLS Grid
- 2026-05-01 Listed $319,900 NORTHSTARMLS as Distributed by MLS Grid
- 2020-05-15 Sold (MLS) $239,900 NORTHSTARMLS as Distributed by MLS Grid
- 2020-02-18 Listed $239,900 NORTHSTARMLS as Distributed by MLS Grid
Property tax history
+11.1%/yrLatest (2026): $4,642 · +15.8% YoY. Source: county tax records.
Cash-flow waterfall
monthlySold comps — $/sqft
last 12 mo · ≤1 miLoading sold comps…