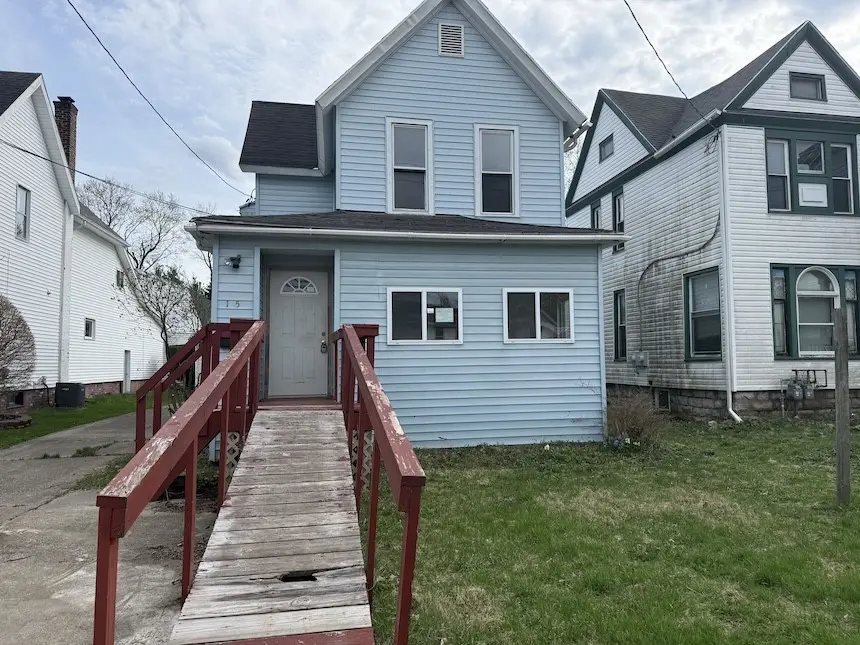
15 Maple St · Batavia, NY
Flood risk 1/10 · Minimal
- FEMA flood zone
- X
- Chance of flooding over 30 yrs
- 0.0%
- Est. flood insurance / yr
- $473 – $860
Fire risk 3/10 · Minor
- Est. fire insurance / yr
- $691 – $1,283
Heat risk 2/10 · Minimal
- Hot days now (above 96°F)
- 7 days/yr
- Hot days in 30 yrs
- 16 days/yr
Wind risk 1/10 · Minimal
- Chance of severe wind over 30 yrs
- —
Air-quality risk 2/10 · Minimal
- Unhealthy air days now
- 1 days/yr
- Unhealthy air days in 30 yrs
- 2 days/yr
Risk factors via First Street. Map © Google.
Why this score? — see what drove the B- grade
The composite is a weighted blend of 9 inputs, each scored 0–100. Each bar is that input's sub-score; the figure is the points it added to the 100-point composite (weight × sub-score).
- Cash flow +30.0/30.0
- 1% rule +10.0/10.0
- DSCR +10.0/10.0
- ARV discount +7.5/15.0
- Schools +3.7/10.0
- Livability +3.4/5.0
- Rent growth +2.5/5.0
- Condition / age +2.5/5.0
- Appreciation +0.0/10.0
$75,000
🖨 Deal sheet 📄 Offer letter ✓ Due diligence
Listing remarks
Opportunity knocks at 15 Maple Street in Batavia. Offering approximately 2,247 square feet, this 3-bedroom, 1-bath home presents a chance to build equity for the buyer willing to put in some work. The home features a traditional two-story layout with a living room, formal dining room, enclosed front porch, rear porch, and a first-floor full bathroom. All three bedrooms are located upstairs. A full basement provides additional storage space with laundry area, while public water and sewer add convenience. Outside, the property includes a detached single-car garage, shed, and a manageable 0.14-acre village lot. The vinyl siding and overall footprint offer a solid starting point for renovation,
Key facts
- Full basement
- Rear porch
- Enclosed front porch
Tags
Property features AI
Exterior
- Parking: Detached garage (1 car)
- Utilities: Public water connected; Sewer connected
- Home design: 2-story frame home; Resale property; Asphalt roof; Stone foundation; Street-facing on a city street
- Construction: Frame construction; Asphalt roof; Built (existing structure); Stone foundation
- Exterior features: Open porch; Concrete driveway; Shed(s) / additional storage
Interior
- Kitchen: Electric oven; Electric range; Refrigerator; Eat-in kitchen
- Bedrooms: Total of 7 rooms (includes bedrooms and living spaces)
- Flooring: Carpet; Resilient flooring; Varied flooring types
- Bathrooms: One full bathroom on the main level
- Heating & cooling: Gas heating; Baseboard heat
- Interior features: Entrance foyer; Eat-in kitchen; Full basement
- Laundry & utility: Washer and dryer located in the basement; Gas water heater
Neighborhood map
What this means for you Summary
Snapshot
- This is a 3-bed/1.5-bath single-family listed at $75k.
Deal economics
- At list price, monthly cash flow is $585 ($7k/yr) — positive.
- The deal already cash-flows at list — no discount required.
- Meets the 1% rule at list price ($1k rent vs $75k).
- Recommended offer: $74k (1.5% below list) — sets the bar for market timing.
- Cap rate 15.6% vs local median 5.5% in Batavia — top-decile yield for the area; either an underpriced asset or a hidden risk that comps aren't pricing in. Stress-test before assuming the spread holds.
Location & tenants
- Location reads 68/100 on livability (#536 in NY) — a middle-class / working-renter tenant base. Strengths: cost of living A+, housing A+, health & safety A; Watch: employment C-, crime D+, amenities F.
- Batavia City School District (town): math 38% / reading 50% proficiency, ranked #477 of 590 in NY (top 81%) — families likely to look elsewhere, expect single-tenant / working-renter base with shorter leases.
- Market conditions: 89 active listings in the ZIP; 1 comparable units currently listed for rent nearby; 55 units permitted in Genesee County in 2024 (0 in 5+ unit buildings).
Forward outlook
- Local home prices are declining (-3.0%/yr); year-one equity from $519 of loan paydown is wiped out by about $2k of value loss. Plan a longer hold.
- Genesee County population projected at -22% by 2050 — secular population decline; favor cash flow + early exit over multi-decade hold.
- At projected returns (-3.0% appreciation + 3.0% rent growth), your $21k cash investment doubles in ~4 years — after that, you're playing with house money.
Negotiation context
- It's been on market 21 days — a 2% lower offer ($74k) is reasonable based on typical stale-listing flexibility.
- Current owner paid $50k; list at $75k implies a 50% gain — meaningful room to come down on a strong offer.
Risks & watch-outs
- Watch-outs: built in 1890 — expect roof / HVAC / electrical / plumbing capex.
Questions for the listing agent
- Built in 1890 — when were the roof, HVAC, electrical panel, plumbing, and water heater last replaced?
- Is there a deadline driving the sale (1031 exchange, divorce, estate, relocation)? That informs how much negotiation room exists.
- Schools are B-rated — typically a magnet for longer-tenancy family renters. What's the average tenant stay here, and is there a school-zone premium baked into asking?
- Crime grade is D in this area — have there been break-ins, vandalism, or insurance claims at this property in the last 3 years? What carrier currently insures it and at what premium?
- What's the average days-on-market for RENTAL listings here right now (not sales)? A rising rental-DOM trend means longer vacancies and softer asking-rent achievability than the comps imply.
- What's the recent tenant-quality profile in this submarket — average credit score on applications, eviction rate, late-payment / NSF rate, and stable-employment percentage? A property-management company in the area should have these aggregated.
- How much new for-sale + rental construction is in the pipeline within 1–3 miles? Heavy new supply typically softens prices + rents 12–24 months out; constrained supply supports both.
Investment metrics
- 1% rule
- 1.95% ✓
- Cap rate
- 15.65%
- Cash-on-cash
- 33.42%
- DSCR
- 2.49
- GRM
- 4.3
CMA / ARV
- ARV (on-the-fly)
- $244,923
- Comps found
- 8
Show comp detail 8 sales within ~0.75 mi
| Address | Dist | Beds/Ba | Sqft | Sold | Price | $/sf | Match |
|---|---|---|---|---|---|---|---|
| 40 Walnut St | 0.38mi | 3/1.5 | 2,182 (-3%) | 7mo | $66,000 | $30 | 72 |
| 410 S Jackson St | 0.52mi | 3/2.5 | 2,152 (-4%) | 9mo | $245,000 | $114 | 57 |
| 29 Ellicott Ave | 0.66mi | 3/1.5 | 2,298 (+2%) | 11mo | $250,000 | $109 | 56 |
| 138 Jackson St | 0.09mi | 4/2.0 (+1) | 2,006 (-11%) | 22mo | $50,000 | $25 | 53 |
| 24 Thomas Ave | 0.57mi | 4/1.5 (+1) | 2,284 (+2%) | 23mo | $205,000 | $90 | 47 |
| 48 Ellicott Ave | 0.72mi | 4/2.5 (+1) | 2,156 (-4%) | 5mo | $328,000 | $152 | 46 |
| 8 Brooklyn Ave | 0.71mi | 4/2.0 (+1) | 2,205 (-2%) | 15mo | $175,000 | $79 | 44 |
| 14 Washington Ave | 0.62mi | 3/2.5 | 1,970 (-12%) | 23mo | $233,500 | $119 | 27 |
Match score weights: distance 35% · size 25% · config 20% · recency 20%. Top-matched comps best support the ARV.
Projected returns pro-forma
-3.0% appreciation · 3.0% rent growth · sell at horizon
- IRR
- 28.7%
- Equity multiple
- 2.20×
- Total profit
- $25,145
- Equity at exit
- $11,183
- IRR
- 36.1%
- Equity multiple
- 4.34×
- Total profit
- $70,071
- Equity at exit
- $6,485
Cash invested: $21,000 (down + closing). Projections, not guarantees.
Landlord ↔ Tenant lean methodology
- Overall (STATE)
- 15 Strongly Tenant-Friendly
- State New York
- 15 Strongly Tenant-Friendly · D+10
- County
- — inherits STATE
- City
- — inherits STATE
ZIP-level market 14020
- Home prices YoY
- -10.4%
- Active inventory
- 89
- Price-to-rent
- 4.3×
Monthly cashflow live
- Estimated rent
- $1,461 medium interval (Pro) →
- Mortgage (P&I)
- −$393
- Tax from tax record
- −$145 /mo · $1,736/yr
- Insurance
- −$31
- HOA
- −$0
- Vacancy / Maint / Mgmt
- −$307
- Net cashflow
- $585
Break-even live
UW: 25.0% down · 7.5% · 30yr · 1.5% tax · 5.0% vac · 8.0% maint · 8.0% mgmt
Financing live
Cash to close
- Down payment
- $18,750
- Closing costs
- $2,250
- Reserves months
- —
- Total cash needed
- —
Loan-product check · same deal, 3 products live
Conventional
25% down · 7.5% · 30yr
- Down + closing
- —
- Monthly P&I
- —
- Monthly cashflow
- —
- DSCR
- —
- Eligible?
- —
Personal DTI + credit; lowest rate.
DSCR
20% down · 8.5% · 30yr
- Down + closing
- —
- Monthly P&I
- —
- Monthly cashflow
- —
- DSCR
- —
- Eligible?
- —
No personal income docs; deal must DSCR.
Hard money
10% down · 12.0% · 12mo
- Down + closing
- —
- Monthly P&I
- —
- Monthly cashflow
- —
- DSCR
- —
- Eligible?
- —
Short-term bridge; refi at stabilization.
Rent comps 1 comps
| Address | Beds | Baths | Sqft | Rent | $/sqft | DOM | Units | Dist |
|---|---|---|---|---|---|---|---|---|
| 33 Manhattan Ave Batavia, NY | 2.0 | 1.0 | 2162 | $925 | $0.43 | 10d | 1 | 0.91mi |
Listing history 11 events
-
2026-06-09statusdays on market $75,000 Pending 21 DOM
-
2026-06-08days on market $75,000 Active 20 DOM
-
2026-06-07days on market $75,000 Active 19 DOM
-
2026-06-07days on market $75,000 Active 18 DOM
-
2026-06-04days on market $75,000 Active 15 DOM
-
2026-06-02days on market $75,000 Active 14 DOM
-
2026-06-01days on market $75,000 Active 13 DOM
-
2026-05-31days on market $75,000 Active 12 DOM
-
2026-05-31days on market $75,000 Active 11 DOM
-
2026-05-18$75,000 Active
-
2000-04-27soldstatus $50,000
ⓘ Source: listings_history table (triggers on properties + properties_extension) + one-shot
backfill from property_details.listing_events for pre-trigger history.
Tax reassessment forecast NY · Partial reset (capped growth)
- Current annual tax
- $1,736 · $145/mo
- Projected year-2 tax
- $1,736 · $145/mo
- Expected delta
- $0/yr ($0/mo · 0.0%)
ⓘ Screening estimate from a state-policy table — verify with the county assessor before closing.
Climate risk First Street
- Flood 1/10 Low FEMA zone X · 0% chance over 30 yrs
- Wildfire 3/10 Moderate
- Heat 2/10 Low 7 d/yr ≥96°F today · 16 d/yr by 30 yrs out
- Wind 1/10 Low
- Air quality 2/10 Low 1 unhealthy d/yr today · 2 by 30 yrs out
Nearby sold comps map
Loading sold comps map…
Walkable amenities ~0.75 mi
Loading nearby amenities…
Taxation est. · year 1
- Rental income
- $17,529
- − Mortgage interest
- −$4,201
- − Property taxes
- −$1,736
- − Insurance
- −$375
- − Repairs & maintenance
- −$1,402
- − Management
- −$1,402
- − Depreciation
- −$2,182
- Taxable income
- $6,231
- Est. tax owed @ 24.0%
- −$1,495
- After-tax cash flow
- $5,522/yr
For passive investors: Depreciation is non-cash, so a rental often shows a tax loss while cash-flowing — sheltering income. Rental losses are passive: they offset passive income freely, and up to $25,000/yr can offset ordinary (W-2) income if you actively participate and your MAGI is under $100k (phasing out to $0 by $150k); unused losses carry forward. On sale, claimed depreciation is recaptured at up to 25%, and gains may owe capital-gains tax (a 1031 exchange can defer both). Figures are a year-1 estimate at your 24.0% rate — not tax advice; consult a CPA.
Schools (NCES district)
- District
- Batavia City School District
- NCES district ID
- 3603990
- Math proficiency
- 38% ▼ -13.00%
- Reading proficiency
- 50% ▲ 4.00%
- Median HH income
- $43,288
- Composite
- 37.13/100
- National rank
- #4490
- State rank
- #477 of 590 in NY
Livability — Batavia
- Score
- 68/100
- State rank
- #536
- US rank
- #9660
Category grades
Schools grade is shown separately in the Schools card above.
Census & demographics
- Census place
- Batavia, NY
- County
- Genesee County · 22,002 people
- City population
- 22,002
- Metro
- Batavia, NY
- Population (ZIP)
- 22,002
- Household income
- $62,655
- Rent vs Own
- Severe rent burden
- 817.0
Population outlook (Genesee County) Hauer SSP2
- Today (2025)
- 56,113 people
- By 2030
- 54,140 · -3.5%
- By 2040
- 49,368 · -12.0%
- By 2050
- 43,911 · -21.7%
- By 2075
- 32,511 · -42.1%
- By 2100
- 21,695 · -61.3%
Race, ethnicity, and origin ACS 2023
- Neighborhood character
- Predominantly White (87%)
- Race & ethnicity
- White 87% Two or more races 6% Hispanic / Latino 4% Black 3% Asian 1%
- Common ancestry
- Romanian 11% Lithuanian 2% Slovak 2%
- Foreign-born
- 4% · Canada, China
- Languages at home
- 95% English-only · Spanish 3% Chinese 1%
Political lean MEDSL · Genesee
- 2024 margin
- Solid R (+34.0) · D 33.0% · R 67.0%
- 2008→2024 swing
- -15.6pp toward R · 2008: -18.4pp · 2024: -34.0pp
- All cycles
- 2024: R+34.0 2020: R+31.7 2016: R+37.0 2012: R+20.9 2008: R+18.4
Not yet ingested
- Civics
- —
Market trends
- HPI YoY
- ▼ -30.58%
- Current HPI
- 263.2147
- Rent YoY
- —
- Metro
- Batavia, NY
- State GDP YoY
- ▲ 2.60%
- F500 in state
- 92
Industry mix (Fortune 500 HQ in NY)
| Industry | F500 HQs | Revenue |
|---|---|---|
| Financial Services | 10 | $950B |
|
||
| Consumer Goods | 9 | $162B |
|
||
| Insurance | 4 | $225B |
|
||
| Telecommunications | 2 | $144B |
|
||
| Pharmaceuticals | 2 | $112B |
|
||
| Media / Entertainment | 2 | $69B |
|
||
Price history
+50.0% since first listed2 events — show timeline
- 2026-05-18 Listed $75,000 UNYREIS
- 2000-04-27 Sold (Public Records) $50,000 Public Records
Property tax history
+0.9%/yrLatest (2025): $1,736 · -47.8% YoY. Source: county tax records.
Cash-flow waterfall
monthlySold comps — $/sqft
last 12 mo · ≤1 miLoading sold comps…