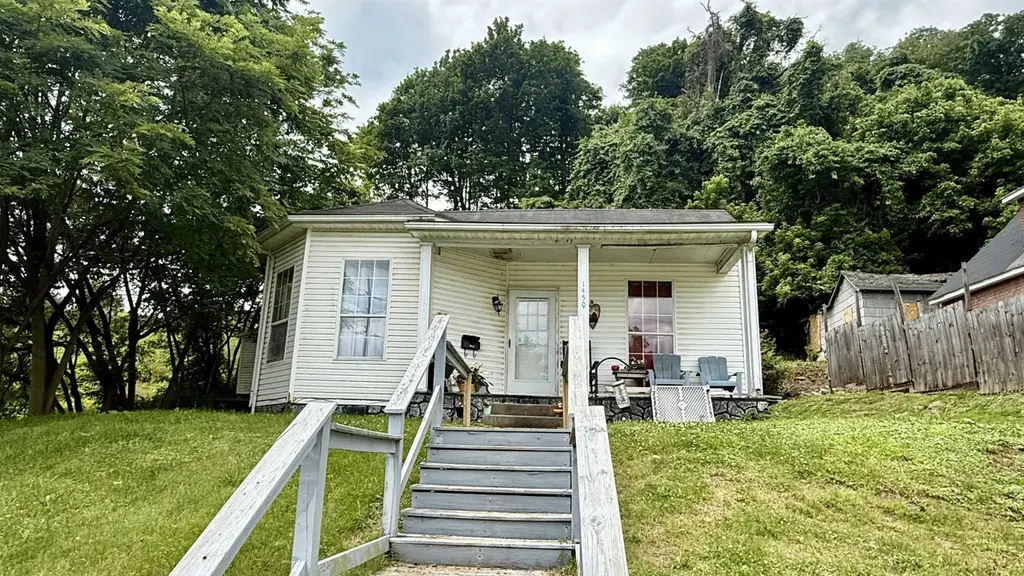
1450 Center St · Catlettsburg, KY
Flood risk 9/10 · Severe
- FEMA flood zone
- X (shaded)
- Chance of flooding over 30 yrs
- 0.99%
- Est. flood insurance / yr
- $507 – $1,088
Fire risk 3/10 · Minor
- Est. fire insurance / yr
- $839 – $1,559
Heat risk 4/10 · Minor
- Hot days now (above 102°F)
- 7 days/yr
- Hot days in 30 yrs
- 20 days/yr
Wind risk 2/10 · Minimal
- Chance of severe wind over 30 yrs
- 1.0%
Air-quality risk 2/10 · Minimal
- Unhealthy air days now
- 0 days/yr
- Unhealthy air days in 30 yrs
- 1 days/yr
Risk factors via First Street. Map © Google.
Why this score? — see what drove the C- grade
The composite is a weighted blend of 9 inputs, each scored 0–100. Each bar is that input's sub-score; the figure is the points it added to the 100-point composite (weight × sub-score).
- Cash flow +23.9/30.0
- DSCR +7.7/10.0
- Appreciation +6.5/10.0
- 1% rule +5.3/10.0
- Livability +3.4/5.0
- Rent growth +2.5/5.0
- Schools +2.5/10.0
- Condition / age +2.5/5.0
- ARV discount +0.0/15.0
$85,000
🖨 Deal sheet (PDF) 📄 Offer letter ✓ Due diligence
Listing remarks MLS
Great Investment Opportunity on US-23! Welcome to 1415 Center Street — a well-maintained 2-bedroom, 1-bath home ideally located right on US-23 with easy access to I-64, making it a prime spot for commuters or rental investors. Currently being rented at 850/m. Just minutes from downtown Catlettsburg and only 10 minutes to local hospitals in Ashland, this home offers both convenience and comfort. Featuring vinyl siding for low-maintenance living, tall ceilings that enhance the sense of space, and central (gas)heat and air for year-round comfort, this property is move-in ready. Currently used as a rental property, it is occupied under a 12-month lease, providing immediate income potential for investors. With its strategic location, solid features, and strong rental history, this property won’t last long. Schedule your showing today!
Key facts
- 3,000 sq ft lot
- Listed 10 days
Property features AI
Exterior
- Parking: No on-site parking
- Utilities: Public water; Public sewer
- Home design: Single-family residence; Residential property
- Construction: 980 above-grade finished area
- Exterior features: Composition roof
Interior
- Kitchen: Electric range; Refrigerator
- Bathrooms: 1 full bathroom
- Heating & cooling: Central air; Forced air heating
- Interior features: Electric range; Refrigerator; Central air conditioning; Forced air heating; Seven total rooms
Neighborhood map
What this means for you Summary
Snapshot
- This is a 2-bed/1.5-bath single-family listed at $85k.
Deal economics
- At list price, monthly cash flow is $99 ($1k/yr) — positive.
- The deal already cash-flows at list — no discount required.
- Meets the 1% rule at list price ($878 rent vs $85k).
- Cap rate 8.6% vs local median 5.4% in Catlettsburg — top-decile yield for the area; either an underpriced asset or a hidden risk that comps aren't pricing in. Stress-test before assuming the spread holds.
Location & tenants
- Location reads 68/100 on livability (#187 in KY) — a middle-class / working-renter tenant base. Strengths: crime A+, cost of living A+, housing B+; Watch: amenities F, commute F, employment F.
- Boyd County (suburban): math 20% / reading 37% proficiency, ranked #115 of 165 in KY (top 70%) — low school quality limits family demand, transient renter base, plan for 1-2y turnover.
- Zoned schools: Catlettsburg Elementary School (math 12% / reading 27%, grade F, #572 of 676 statewide, top 88%, 209 students, 80% FRL); Boyd County Middle School (math 18% / reading 39%, grade F, #161 of 217 statewide, top 75%, 620 students, 55% FRL); Boyd County High School (math 27% / reading 37%, grade F, #97 of 254 statewide, top 46%, 911 students, 52% FRL) — zoned schools average 62% FRL vs 45% district-wide (17 pts higher); higher-poverty schools than district average — tighter screening recommended.
- Market conditions: 48 active listings in the ZIP; 2 units permitted in Boyd County in 2024 (0 in 5+ unit buildings).
Forward outlook
- In year one you build about $3k of equity ($588 loan paydown + $3k appreciation (3.1% local appreciation)).
- Boyd County population projected at -17% by 2050 — secular population decline; favor cash flow + early exit over multi-decade hold.
- At projected returns (3.1% appreciation + 3.0% rent growth), your $24k cash investment doubles in ~5 years — after that, you're playing with house money.
- By year 10, paydown + projected appreciation supports a ~$31k cash-out refi (75% LTV) — recoverable capital for the next deal without selling this one.
Negotiation context
- Only 10 days on market — expect competitive offers; lowballing is unlikely to land.
- 3 sale attempts since 8y ago with the ask held roughly flat each time — persistent listings suggest the price (not the market) is what's stuck; bring a comps-based counter.
- Current owner paid $59k; 44% above their basis — modest negotiation headroom, anchor on the comps not their cost.
Risks & watch-outs
- Watch-outs: flood insurance adds $66/mo.
- Climate carrying-cost: severe flood risk — expect insurance premiums to compound above CPI over the hold.
Questions for the listing agent
- What's the actual annual flood-insurance premium (NFIP or private), and is the property in a SFHA with mandatory coverage?
- Is there a deadline driving the sale (1031 exchange, divorce, estate, relocation)? That informs how much negotiation room exists.
- Schools are D-rated, which usually means shorter tenancies and higher turnover. Who's the typical renter profile here, and what's been the actual vacancy rate?
- What's the average days-on-market for RENTAL listings here right now (not sales)? A rising rental-DOM trend means longer vacancies and softer asking-rent achievability than the comps imply.
- What's the recent tenant-quality profile in this submarket — average credit score on applications, eviction rate, late-payment / NSF rate, and stable-employment percentage? A property-management company in the area should have these aggregated.
- How much new for-sale + rental construction is in the pipeline within 1–3 miles? Heavy new supply typically softens prices + rents 12–24 months out; constrained supply supports both.
Investment metrics
- 1% rule
- 1.03% ✓
- Cap rate
- 8.63%
- Cash-on-cash
- 8.33%
- DSCR
- 1.37
- GRM
- 8.1
CMA / ARV
- ARV (on-the-fly)
- $60,760
- Comps found
- 5
Show comp detail 5 sales within ~0.75 mi
| Address | Dist | Beds/Ba | Sqft | Sold | Price | $/sf | Match |
|---|---|---|---|---|---|---|---|
| 1450 Center St | 0.00mi | 2/1.0 | 980 (0%) | 9mo | $59,000 | $60 | 90 |
| 318 Wadkins St | 0.45mi | 2/1.0 | 1,002 (+2%) | 2mo | $40,000 | $40 | 72 |
| 906 Honeysuckle Ln | 0.64mi | 3/1.0 (+1) | 984 (+0%) | 10mo | $87,500 | $89 | 54 |
| 1254 Mitchell St | 0.43mi | 2/1.0 | 885 (-10%) | 24mo | $55,000 | $62 | 42 |
| 25 Pvt DR 2822 | 0.53mi | 3/1.0 (+1) | 1,112 (+14%) | 13mo | $165,000 | $148 | 35 |
Match score weights: distance 35% · size 25% · config 20% · recency 20%. Top-matched comps best support the ARV.
Projected returns pro-forma
3.09% appreciation · 3.0% rent growth · sell at horizon
- IRR
- 12.4%
- Equity multiple
- 1.71×
- Total profit
- $16,939
- Equity at exit
- $38,631
- IRR
- 14.4%
- Equity multiple
- 3.14×
- Total profit
- $51,039
- Equity at exit
- $59,856
Cash invested: $23,800 (down + closing). Projections, not guarantees.
Landlord ↔ Tenant lean methodology
- Overall (STATE)
- 83 Strongly Landlord-Friendly
- State Kentucky
- 83 Strongly Landlord-Friendly · R+16
- County
- — inherits STATE
- City
- — inherits STATE
ZIP-level market 41129
- Home prices YoY
- 1.2%
- Active inventory
- 48
- Price-to-rent
- 8.1×
Monthly cashflow live
- Estimated rent
- $878 medium interval (Pro) →
- Mortgage (P&I)
- −$446
- Tax from tax record
- −$47 /mo · $562/yr
- Insurance
- −$35
- Flood insurance flood zone
- −$66 /mo · $798/yr
- HOA
- −$0
- Vacancy / Maint / Mgmt
- −$184
- Net cashflow
- $99
Break-even live
Sensitivity live
| Price | -10% $147 | -5% $123 | +0% $99 | +5% $75 | +10% $51 |
|---|---|---|---|---|---|
| Rent | -10% $30 | -5% $64 | +0% $99 | +5% $134 | +10% $168 |
| Rate | -1.0pp $142 | -0.5pp $120 | base $99 | +0.5pp $77 | +1.0pp $54 |
UW: 25.0% down · 7.5% · 30yr · 1.5% tax · 5.0% vac · 8.0% maint · 8.0% mgmt
Financing live
Cash to close
- Down payment
- $21,250
- Closing costs
- $2,550
- Reserves months
- —
- Total cash needed
- —
Loan-product check · same deal, 3 products live
Conventional
25% down · 7.5% · 30yr
- Down + closing
- —
- Monthly P&I
- —
- Monthly cashflow
- —
- DSCR
- —
- Eligible?
- —
Personal DTI + credit; lowest rate.
DSCR
20% down · 8.5% · 30yr
- Down + closing
- —
- Monthly P&I
- —
- Monthly cashflow
- —
- DSCR
- —
- Eligible?
- —
No personal income docs; deal must DSCR.
Hard money
10% down · 12.0% · 12mo
- Down + closing
- —
- Monthly P&I
- —
- Monthly cashflow
- —
- DSCR
- —
- Eligible?
- —
Short-term bridge; refi at stabilization.
Listing history 9 events
-
2026-06-22days on market $85,000 Active 10 DOM
-
2026-06-21days on market $85,000 Active 9 DOM
-
2026-06-21days on market $85,000 Active 8 DOM
-
2026-06-18days on market $85,000 Active 6 DOM
-
2026-06-17days on market $85,000 Active 5 DOM
-
2026-06-16days on market $85,000 Active 4 DOM
-
2026-06-15days on market $85,000 Active 3 DOM
-
2026-06-12remarks 693-char remark
-
2026-06-12$85,000 Active 1 DOM
ⓘ Source: listings_history table (triggers on properties + properties_extension) + one-shot
backfill from property_details.listing_events for pre-trigger history.
Tax reassessment forecast KY · Resets to sale price
- Current annual tax
- $562 · $47/mo
- Projected year-2 tax
- $731 · $61/mo
- Expected delta
- +$169/yr (+$14/mo · 30.2%)
ⓘ Screening estimate from a state-policy table — verify with the county assessor before closing.
Climate risk First Street
- Flood 9/10 Extreme FEMA zone X (shaded) · 99% chance over 30 yrs
- Wildfire 3/10 Moderate
- Heat 4/10 Moderate 7 d/yr ≥102°F today · 20 d/yr by 30 yrs out
- Wind 2/10 Low 100% chance of damaging wind over 30 yrs
- Air quality 2/10 Low 0 unhealthy d/yr today · 1 by 30 yrs out
Nearby sold comps map
Loading sold comps map…
Walkable amenities ~0.75 mi
Loading nearby amenities…
Taxation est. · year 1
- Rental income
- $10,531
- − Mortgage interest
- −$4,761
- − Property taxes
- −$562
- − Insurance
- −$1,222
- − Repairs & maintenance
- −$842
- − Management
- −$842
- − Depreciation
- −$2,473
- Taxable loss
- −$172
- Est. tax savings @ 24.0%
- +$41
- After-tax cash flow
- $1,228/yr
For passive investors: Depreciation is non-cash, so a rental often shows a tax loss while cash-flowing — sheltering income. Rental losses are passive: they offset passive income freely, and up to $25,000/yr can offset ordinary (W-2) income if you actively participate and your MAGI is under $100k (phasing out to $0 by $150k); unused losses carry forward. On sale, claimed depreciation is recaptured at up to 25%, and gains may owe capital-gains tax (a 1031 exchange can defer both). Figures are a year-1 estimate at your 24.0% rate — not tax advice; consult a CPA.
Schools (NCES district)
- District
- Boyd County
- NCES district ID
- 2100620
- Math proficiency
- 20% ▼ -18.00%
- Reading proficiency
- 37% ▼ -17.00%
- Median HH income
- $47,479
- Composite
- 24.65/100
- National rank
- #7625
- State rank
- #115 of 165 in KY
Livability — Catlettsburg
- Score
- 68/100
- State rank
- #187
- US rank
- #9459
Category grades
Schools grade is shown separately in the Schools card above.
Census & demographics
- Census place
- Catlettsburg, KY
- Population (ZIP)
- 8,417
Population outlook (Boyd County) Hauer SSP2
- Today (2025)
- 46,137 people
- By 2030
- 44,585 · -3.4%
- By 2040
- 41,442 · -10.2%
- By 2050
- 38,313 · -17.0%
- By 2075
- 31,077 · -32.6%
- By 2100
- 23,432 · -49.2%
Race, ethnicity, and origin ACS 2023
- Neighborhood character
- Predominantly White (96%)
- Race & ethnicity
- White 96% Two or more races 2% Black 2%
- Common ancestry
- Slovak 2% Serbian 1% Iranian 1%
- Foreign-born
- 0% · Canada
Political lean MEDSL · Boyd
- 2024 margin
- Solid R (+38.5) · D 30.0% · R 68.6% · Other 1.4%
- 2008→2024 swing
- -26.2pp toward R · 2008: -12.3pp · 2024: -38.5pp
- All cycles
- 2024: R+38.5 2020: R+33.2 2016: R+37.0 2012: R+16.3 2008: R+12.3
Not yet ingested
- Civics
- —
Market trends
- HPI YoY
- ▲ 3.09%
- Current HPI
- 265.4897
- Rent YoY
- —
- Metro
- —
- State GDP YoY
- ▲ 1.81%
- F500 in state
- 4
Industry mix (Fortune 500 HQ in KY)
| Industry | F500 HQs | Revenue |
|---|---|---|
| Healthcare | 1 | $118B |
|
||
| Food / Beverage | 1 | $7B |
|
||
Price history
+143.6% since first listed12 events — show timeline
- 2026-06-11 Listed $85,000 AABOR
- 2025-10-03 Sold (Public Records) $59,000 Public Records
- 2025-09-12 Sold (MLS) $59,000 AABOR
- 2025-08-27 Contingent — AABOR
- 2025-08-27 Pending — AABOR
- 2025-08-04 Contingent — AABOR
- 2025-05-21 Listed $59,000 AABOR
- 2018-12-27 Sold (Public Records) $27,000 Public Records
- 2018-12-26 Sold (MLS) $27,000 AABOR
- 2018-05-09 Listed $32,900 AABOR
- 2001-08-22 Sold (Public Records) $24,000 Public Records
- 2001-06-04 Sold (Public Records) $34,900 Public Records
Property tax history
+3.3%/yrLatest (2025): $562 · -0.8% YoY. Source: county tax records.
Cash-flow waterfall
monthlySold comps — $/sqft
last 12 mo · ≤1 miLoading sold comps…