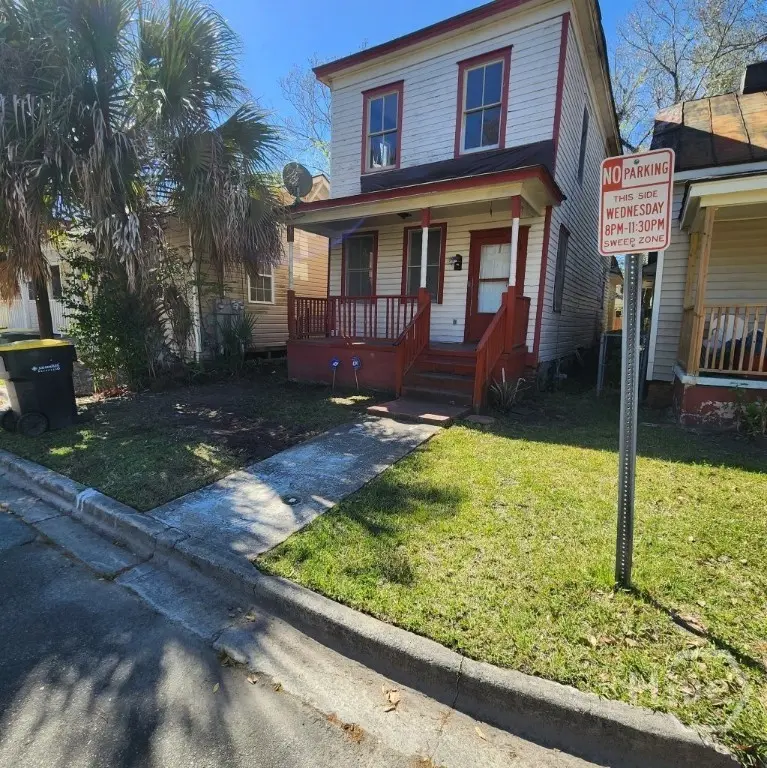
1707 Le Grand St · Savannah, GA
Flood risk 5/10 · Moderate
- FEMA flood zone
- X (unshaded)
- Chance of flooding over 30 yrs
- 0.66%
- Est. flood insurance / yr
- $507 – $1,088
Fire risk 1/10 · Minimal
- Est. fire insurance / yr
- $963 – $1,789
Heat risk 10/10 · Severe
- Hot days now (above 107°F)
- 7 days/yr
- Hot days in 30 yrs
- 18 days/yr
Wind risk 9/10 · Severe
- Chance of severe wind over 30 yrs
- 99.0%
Air-quality risk 5/10 · Moderate
- Unhealthy air days now
- 7 days/yr
- Unhealthy air days in 30 yrs
- 8 days/yr
Risk factors via First Street. Map © Google.
Why this score? — see what drove the B- grade
The composite is a weighted blend of 9 inputs, each scored 0–100. Each bar is that input's sub-score; the figure is the points it added to the 100-point composite (weight × sub-score).
- Cash flow +30.0/30.0
- 1% rule +10.0/10.0
- DSCR +10.0/10.0
- ARV discount +7.5/15.0
- Livability +4.3/5.0
- Rent growth +3.2/5.0
- Condition / age +2.5/5.0
- Schools +2.0/10.0
- Appreciation +0.0/10.0
$135,000
🖨 Deal sheet 📄 Offer letter ✓ Due diligence
Listing remarks MLS
Sought after restoration opportunity near Savannah's historic Thomas Square district. This authentic circa 1920 two-story home presents a value-add project for investors and renovators. Solid bones with original architectural character await thoughtful restoration. The deep 90-foot lot features convenient lane access, offering flexibility for parking and expansion. Located near Thomas Square with easy walkability to The Laundry Diner, Perc Coffee, and a short distance to downtown Savannah. This area's stock of restored historic homes and new construction demonstrates strong investment appreciation. Court-ordered probate sale. Ideal for experienced renovators, owner-occupants seeking their dream historic home, or developers. Property sold as-is and requires complete renovation. Does not qualify for FHA/VA financing. Perfect opportunity to create equity in one of Savannah's up and coming, growing neighborhoods.
Key facts
- New construction
- Complete renovation
- Deep 90-foot lot
Tags
Neighborhood map
What this means for you Summary
Snapshot
- This is a 4-bed/2.0-bath single-family listed at $135k.
Deal economics
- At list price, monthly cash flow is $1k ($13k/yr) — positive.
- The deal already cash-flows at list — no discount required.
- Meets the 1% rule at list price ($3k rent vs $135k).
- Recommended offer: $131k (3.0% below list) — sets the bar for market timing.
- Cap rate 16.2% vs local median 4.0% in Savannah — top-decile yield for the area; either an underpriced asset or a hidden risk that comps aren't pricing in. Stress-test before assuming the spread holds.
Location & tenants
- Location reads 86/100 on livability (#1 in GA, #397 nationally) — a professional / high-income tenant draw. Strengths: crime A+, amenities A+, commute A+; Watch: employment D, schools F.
- Savannah-Chatham County (urban): math 20% / reading 26% proficiency, ranked #134 of 174 in GA (top 77%) — low school quality limits family demand, transient renter base, plan for 1-2y turnover.
- Market conditions: Rents rising (+3.0%/yr); 333 active listings in the ZIP; 40 comparable units currently listed for rent nearby; rentals lingering (median 44d on market — plan ~5-8 weeks vacancy on turnover, expect pricing pressure); 75% of comp listings sitting > 30 days — soft ceiling on asking rent; 2,694 units permitted in Chatham County in 2024 (973 in 5+ unit buildings).
- At $2,589/mo this rent would consume 59% of the median local household income ($53k/yr) (locally 2031% of renters already pay >50% of income on rent) — very limited rent-growth headroom before tenants either downsize or default.
Forward outlook
- Local home prices are declining (-3.0%/yr); year-one equity from $933 of loan paydown is wiped out by about $4k of value loss. Plan a longer hold.
- Chatham County population projected at +33% by 2050 — long-run rental-demand tailwind backs the buy-and-hold thesis.
- At projected returns (-3.0% appreciation + 3.0% rent growth), your $38k cash investment doubles in ~4 years — after that, you're playing with house money.
Negotiation context
- It's been on market 39 days — a 3% lower offer ($131k) is reasonable based on typical stale-listing flexibility.
Risks & watch-outs
- Watch-outs: built in 1920 — expect roof / HVAC / electrical / plumbing capex.
- Climate carrying-cost: moderate flood risk; severe wind risk, 99% chance of damaging wind over 30y; extreme-heat days projected 7→18/yr by 2055 (HVAC capex compounding) — expect insurance premiums to compound above CPI over the hold.
Questions for the listing agent
- It's been on market 39 days. Have you received any prior offers? Is the seller open to a 3% concession, seller financing, or rate buy-down credit?
- Built in 1920 — when were the roof, HVAC, electrical panel, plumbing, and water heater last replaced?
- Is there a deadline driving the sale (1031 exchange, divorce, estate, relocation)? That informs how much negotiation room exists.
- Schools are F-rated, which usually means shorter tenancies and higher turnover. Who's the typical renter profile here, and what's been the actual vacancy rate?
- What's the average days-on-market for RENTAL listings here right now (not sales)? A rising rental-DOM trend means longer vacancies and softer asking-rent achievability than the comps imply.
- What's the recent tenant-quality profile in this submarket — average credit score on applications, eviction rate, late-payment / NSF rate, and stable-employment percentage? A property-management company in the area should have these aggregated.
- How much new for-sale + rental construction is in the pipeline within 1–3 miles? Heavy new supply typically softens prices + rents 12–24 months out; constrained supply supports both.
Investment metrics
- 1% rule
- 1.92% ✓
- Cap rate
- 16.18%
- Cash-on-cash
- 35.32%
- DSCR
- 2.57
- GRM
- 4.3
CMA / ARV
- ARV (median comp)
- $395,953
- List price
- $135,000
- Delta
- -65.91%
- Verdict
- UNDERPRICED
- Comps
- 20 within 1.0 mi
Show comp detail 12 sales within ~0.75 mi
| Address | Dist | Beds/Ba | Sqft | Sold | Price | $/sf | Match |
|---|---|---|---|---|---|---|---|
| 2011 Atlantic Ave | 0.19mi | 3/2.0 (-1) | 1,392 (-7%) | 4mo | $340,000 | $244 | 71 |
| 816 E 37th St | 0.32mi | 3/2.0 (-1) | 1,628 (+9%) | 1mo | $387,000 | $238 | 64 |
| 1111 E 31st St | 0.50mi | 3/2.0 (-1) | 1,580 (+6%) | 1mo | $423,000 | $268 | 62 |
| 823 E Park Ave | 0.44mi | 3/2.5 (-1) | 1,384 (-8%) | 3mo | $425,000 | $307 | 57 |
| 708 E 39th St | 0.35mi | 4/2.0 | 1,720 (+15%) | 4mo | $170,000 | $99 | 56 |
| 917 E 39th St | 0.51mi | 3/2.5 (-1) | 1,612 (+8%) | 1mo | $490,000 | $304 | 55 |
| 809 E Bolton St | 0.51mi | 3/2.0 (-1) | 1,350 (-10%) | 1mo | $440,000 | $326 | 54 |
| 1317 E 32nd St | 0.73mi | 3/2.0 (-1) | 1,438 (-4%) | 1mo | $353,000 | $245 | 54 |
| 1222 NE 36th St | 0.66mi | 3/2.0 (-1) | 1,388 (-7%) | 3mo | $340,000 | $245 | 50 |
| 115 W 34th St | 0.66mi | 3/3.0 (-1) | 1,600 (+7%) | 1mo | $497,000 | $311 | 48 |
| 1125 E 37th St | 0.58mi | 3/2.0 (-1) | 1,326 (-11%) | 4mo | $345,000 | $260 | 46 |
| 1210 E Waldburg St | 0.73mi | 3/2.0 (-1) | 1,277 (-15%) | 2mo | $285,000 | $223 | 34 |
Match score weights: distance 35% · size 25% · config 20% · recency 20%. Top-matched comps best support the ARV.
Projected returns pro-forma
-3.0% appreciation · 2.95% rent growth · sell at horizon
- IRR
- 30.9%
- Equity multiple
- 2.29×
- Total profit
- $48,893
- Equity at exit
- $20,129
- IRR
- 38.0%
- Equity multiple
- 4.53×
- Total profit
- $133,443
- Equity at exit
- $11,672
Cash invested: $37,800 (down + closing). Projections, not guarantees.
Landlord ↔ Tenant lean methodology
- Overall (STATE)
- 90 Strongly Landlord-Friendly
- State Georgia
- 90 Strongly Landlord-Friendly · R+3
- County
- — inherits STATE
- City
- — inherits STATE
ZIP-level market 31401
- Rents YoY
- 3.0%
- Active inventory
- 333
- Price-to-rent
- 4.3×
Monthly cashflow live
- Estimated rent
- $2,589 high interval (Pro) →
- Mortgage (P&I)
- −$708
- Tax est. 1.5%
- −$169 /mo · $2,025/yr
- Insurance
- −$56
- HOA
- −$0
- Vacancy / Maint / Mgmt
- −$544
- Net cashflow
- $1,113
Break-even live
UW: 25.0% down · 7.5% · 30yr · 1.5% tax · 5.0% vac · 8.0% maint · 8.0% mgmt
Financing live
Cash to close
- Down payment
- $33,750
- Closing costs
- $4,050
- Reserves months
- —
- Total cash needed
- —
Loan-product check · same deal, 3 products live
Conventional
25% down · 7.5% · 30yr
- Down + closing
- —
- Monthly P&I
- —
- Monthly cashflow
- —
- DSCR
- —
- Eligible?
- —
Personal DTI + credit; lowest rate.
DSCR
20% down · 8.5% · 30yr
- Down + closing
- —
- Monthly P&I
- —
- Monthly cashflow
- —
- DSCR
- —
- Eligible?
- —
No personal income docs; deal must DSCR.
Hard money
10% down · 12.0% · 12mo
- Down + closing
- —
- Monthly P&I
- —
- Monthly cashflow
- —
- DSCR
- —
- Eligible?
- —
Short-term bridge; refi at stabilization.
Rent comps 40 comps
| Address | Beds | Baths | Sqft | Rent | $/sqft | DOM | Units | Dist |
|---|---|---|---|---|---|---|---|---|
| 1606 Reynolds St Savannah, GA | 3.0 | 2.0 | 1222 | $1,800 | $1.47 | 44d | 1 | 0.03mi |
| 1714 Le Grand St Unit B Savannah, GA | 3.0 | 2.0 | 1300 | $2,700 | $2.08 | 44d | 1 | 0.05mi |
| 1505 Reynolds St Savannah, GA | 4.0 | 2.0 | 1314 | $2,650 | $2.02 | 44d | 1 | 0.09mi |
| 602 E 34th St Savannah, GA | 3.0 | 2.0 | 1185 | $2,095 | $1.77 | 44d | 1 | 0.10mi |
| 1921 Reynolds St Savannah, GA | 4.0 | 2.0 | 1773 | $3,150 | $1.78 | 44d | 1 | 0.15mi |
| 513 E 33rd St Savannah, GA | 4.0 | 3.0 | 1800 | $3,399 | $1.89 | 14d | 1 | 0.18mi |
| 643 E Henry St Unit B Savannah, GA | 3.0 | 1.5 | 1207 | $1,899 | $1.57 | 23d | 1 | 0.20mi |
| 424 E 32nd St Unit 426 Savannah, GA | 3.0 | 1.5 | 1350 | $2,380 | $1.76 | 44d | 1 | 0.24mi |
| 723 E Henry St Unit A Savannah, GA | 3.0 | 2.0 | 1199 | $2,150 | $1.79 | 23d | 1 | 0.24mi |
| 607 E 37th St Savannah, GA | 4.0 | 2.0 | 1771 | $2,300 | $1.30 | 44d | 1 | 0.25mi |
| 2002 Habersham St Savannah, GA | 3.0 | 2.0 | 1242 | $1,995 | $1.61 | 44d | 1 | 0.31mi |
| 317 E 31st St Unit A Savannah, GA | 3.0 | 2.0 | 1196 | $2,000 | $1.67 | 44d | 1 | 0.31mi |
| 823 E Henry St Unit B Savannah, GA | 4.0 | 1.5 | 1670 | $2,000 | $1.20 | 44d | 1 | 0.34mi |
| 1314 Lincoln St Savannah, GA | 3.0 | 2.0 | 1312 | $2,400 | $1.83 | 44d | 1 | 0.37mi |
| 916 E 35th St Savannah, GA | 4.0 | 2.0 | 1630 | $2,700 | $1.66 | 23d | 1 | 0.37mi |
| 836 E Henry St Unit C Savannah, GA | 3.0 | 1.0 | 1800 | $2,000 | $1.11 | 44d | 1 | 0.37mi |
| 914 E 34th St Unit 916 Savannah, GA | 3.0 | 1.0 | 935 | $1,995 | $2.13 | 23d | 1 | 0.38mi |
| 1509 Ott St Savannah, GA | 3.0 | 1.5 | 1263 | $1,900 | $1.50 | 44d | 1 | 0.38mi |
| 826 E Duffy St Savannah, GA | 5.0 | 3.0 | 1445 | $2,295 | $1.59 | 23d | 1 | 0.39mi |
| 826 E Duffy St Unit A Savannah, GA | 3.0 | 2.0 | 1445 | $1,850 | $1.28 | 44d | 1 | 0.39mi |
| 305 E Duffy St Unit A Savannah, GA | 3.0 | 2.0 | 1248 | $3,000 | $2.40 | 44d | 1 | 0.41mi |
| 810 E Park Ave Unit B Savannah, GA | 3.0 | 2.0 | 1100 | $2,700 | $2.45 | 44d | 1 | 0.43mi |
| 413 E Waldburg St Unit B Savannah, GA | 3.0 | 2.0 | 1664 | $3,200 | $1.92 | 44d | 1 | 0.43mi |
| 900 E Park Ave Savannah, GA | 3.0 | 2.0 | 1450 | $1,975 | $1.36 | 44d | 1 | 0.47mi |
| 904 E 39th St Savannah, GA | 3.0 | 1.0 | 1200 | $2,300 | $1.92 | 44d | 1 | 0.48mi |
| 1118 NE 36th St Savannah, GA | 3.0 | 2.0 | 1200 | $2,000 | $1.67 | 44d | 1 | 0.54mi |
| 201 E 39th St Unit B Savannah, GA | 3.0 | 1.5 | 1550 | $2,100 | $1.35 | 44d | 1 | 0.54mi |
| 1112 E Anderson St Savannah, GA | 4.0 | 2.0 | 1488 | $2,300 | $1.55 | 44d | 1 | 0.55mi |
| 1122 E 37th St Savannah, GA | 3.0 | 2.0 | 1292 | $1,895 | $1.47 | 44d | 1 | 0.57mi |
| 1105 E 38th St Savannah, GA | 3.0 | 2.0 | 1500 | $2,400 | $1.60 | 44d | 1 | 0.58mi |
| 1107 E 38th St Savannah, GA | 3.0 | 2.0 | 1500 | $2,400 | $1.60 | 44d | 1 | 0.59mi |
| 123 E 40th St Savannah, GA | 3.0 | 1.0 | 1389 | $1,900 | $1.37 | 44d | 1 | 0.60mi |
| 3 W 36th St Apt 2 Savannah, GA | 4.0 | 1.0 | 1750 | $4,200 | $2.40 | 44d | 1 | 0.60mi |
| 1202 E 37th St Unit A Savannah, GA | 4.0 | 2.0 | 1480 | $2,295 | $1.55 | 14d | 1 | 0.62mi |
| 1723 Whitaker St Savannah, GA | 3.0 | 1.5 | 1845 | $1,800 | $0.98 | 44d | 1 | 0.63mi |
| 102 W 36th St Savannah, GA | 3.0 | 2.0 | 1500 | $4,500 | $3.00 | 23d | 1 | 0.64mi |
| 1313 Whitaker St Unit C Savannah, GA | 3.0 | 2.0 | 1000 | $2,150 | $2.15 | 44d | 1 | 0.65mi |
| 1206 Seiler Ave Savannah, GA | 3.0 | 1.0 | 1183 | $2,050 | $1.73 | 44d | 1 | 0.65mi |
| 515 E Huntingdon St Unit 1244807P Savannah, GA | 3.0 | 1.5 | 1496 | $3,688 | $2.47 | 14d | 1 | 0.65mi |
| 1112 E Bolton St Savannah, GA | 3.0 | 1.0 | 1112 | $1,975 | $1.78 | 23d | 1 | 0.67mi |
Listing history 2 events
-
2026-05-04status Pending 922-char remark
Show marketing remark (922 chars)
Sought after restoration opportunity near Savannah's historic Thomas Square district. This authentic circa 1920 two-story home presents a value-add project for investors and renovators. Solid bones with original architectural character await thoughtful restoration. The deep 90-foot lot features convenient lane access, offering flexibility for parking and expansion. Located near Thomas Square with easy walkability to The Laundry Diner, Perc Coffee, and a short distance to downtown Savannah. This area's stock of restored historic homes and new construction demonstrates strong investment appreciation. Court-ordered probate sale. Ideal for experienced renovators, owner-occupants seeking their dream historic home, or developers. Property sold as-is and requires complete renovation. Does not qualify for FHA/VA financing. Perfect opportunity to create equity in one of Savannah's up and coming, growing neighborhoods.
-
2026-03-25$135,000 Active 922-char remark
Show marketing remark (922 chars)
Sought after restoration opportunity near Savannah's historic Thomas Square district. This authentic circa 1920 two-story home presents a value-add project for investors and renovators. Solid bones with original architectural character await thoughtful restoration. The deep 90-foot lot features convenient lane access, offering flexibility for parking and expansion. Located near Thomas Square with easy walkability to The Laundry Diner, Perc Coffee, and a short distance to downtown Savannah. This area's stock of restored historic homes and new construction demonstrates strong investment appreciation. Court-ordered probate sale. Ideal for experienced renovators, owner-occupants seeking their dream historic home, or developers. Property sold as-is and requires complete renovation. Does not qualify for FHA/VA financing. Perfect opportunity to create equity in one of Savannah's up and coming, growing neighborhoods.
ⓘ Source: listings_history table (triggers on properties + properties_extension) + one-shot
backfill from property_details.listing_events for pre-trigger history.
Climate risk First Street
- Flood 5/10 Major FEMA zone X (unshaded) · 66% chance over 30 yrs
- Wildfire 1/10 Low
- Heat 10/10 Extreme 7 d/yr ≥107°F today · 18 d/yr by 30 yrs out
- Wind 9/10 Extreme 99% chance of damaging wind over 30 yrs
- Air quality 5/10 Major 7 unhealthy d/yr today · 8 by 30 yrs out
Nearby sold comps map
Loading sold comps map…
Walkable amenities ~0.75 mi
Loading nearby amenities…
Taxation est. · year 1
- Rental income
- $31,071
- − Mortgage interest
- −$7,562
- − Property taxes
- −$2,025
- − Insurance
- −$675
- − Repairs & maintenance
- −$2,486
- − Management
- −$2,486
- − Depreciation
- −$3,927
- Taxable income
- $11,910
- Est. tax owed @ 24.0%
- −$2,858
- After-tax cash flow
- $10,492/yr
For passive investors: Depreciation is non-cash, so a rental often shows a tax loss while cash-flowing — sheltering income. Rental losses are passive: they offset passive income freely, and up to $25,000/yr can offset ordinary (W-2) income if you actively participate and your MAGI is under $100k (phasing out to $0 by $150k); unused losses carry forward. On sale, claimed depreciation is recaptured at up to 25%, and gains may owe capital-gains tax (a 1031 exchange can defer both). Figures are a year-1 estimate at your 24.0% rate — not tax advice; consult a CPA.
Schools (NCES district)
- District
- Savannah-Chatham County
- NCES district ID
- 1301020
- Math proficiency
- 20% ▼ -11.00%
- Reading proficiency
- 26% ▼ -5.00%
- Median HH income
- $47,443
- Composite
- 20.14/100
- National rank
- #8639
- State rank
- #134 of 174 in GA
Livability — Savannah
- Score
- 86/100
- State rank
- #1
- US rank
- #397
Category grades
Schools grade is shown separately in the Schools card above.
Census & demographics
- Census place
- Savannah, GA
- County
- Chatham County · 271,602 people
- City population
- 216,564
- Metro
- Savannah, GA
- Population (ZIP)
- 20,445
- Household income
- $52,509
- Rent vs Own
- Severe rent burden
- 2031.0
Population outlook (Chatham County) Hauer SSP2
- Today (2025)
- 332,584 people
- By 2030
- 355,508 · +6.9%
- By 2040
- 400,030 · +20.3%
- By 2050
- 443,019 · +33.2%
- By 2075
- 534,579 · +60.7%
- By 2100
- 583,863 · +75.6%
Race, ethnicity, and origin ACS 2023
- Neighborhood character
- Diverse neighborhood (Simpson 0.59)
- Race & ethnicity
- White 53% Black 35% Hispanic / Latino 7% Two or more races 5% Asian 3%
- Hispanic origin (detail)
- Mexican 2% Puerto Rican 2%
- Common ancestry
- Slovak 2% Lithuanian 2% Romanian 2%
- Foreign-born
- 8% · Canada, China
- Languages at home
- 90% English-only · Spanish 4% Chinese 2% Other Indo-European 1%
Political lean MEDSL · Chatham
- 2024 margin
- D (+18.0) · D 58.6% · R 40.6%
- 2008→2024 swing
- +3.6pp toward D · 2008: 14.4pp · 2024: 18.0pp
- All cycles
- 2024: D+18.0 2020: D+18.8 2016: D+14.5 2012: D+12.0 2008: D+14.4
Not yet ingested
- Civics
- —
Market trends
- HPI YoY
- ▼ -358.74%
- Current HPI
- 553.5645
- Rent YoY
- ▲ 2.95%
- Metro
- Savannah, GA
- State GDP YoY
- ▲ 2.66%
- F500 in state
- 28
Industry mix (Fortune 500 HQ in GA)
| Industry | F500 HQs | Revenue |
|---|---|---|
| Paper / Packaging | 2 | $29B |
|
||
| Retail | 1 | $160B |
|
||
| Transportation / Logistics | 1 | $91B |
|
||
| Airlines | 1 | $62B |
|
||
| Consumer Goods | 1 | $47B |
|
||
| Utilities | 1 | $25B |
|
||
Price history
2 events — show timeline
- 2026-05-04 Pending — Hive MLS
- 2026-03-25 Listed $135,000 Hive MLS
Property tax history
-3.0%/yrLatest (2025): $219 · -25.5% YoY. Source: county tax records.
Cash-flow waterfall
monthlySold comps — $/sqft
last 12 mo · ≤1 miLoading sold comps…