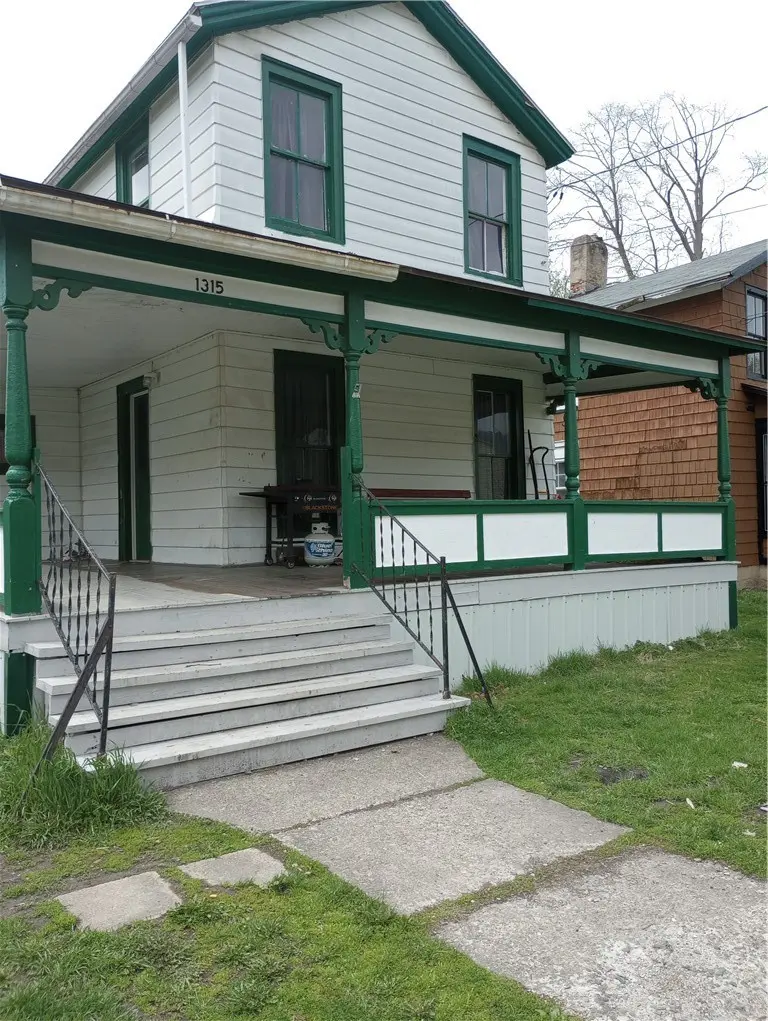
1315 Hall St · Elmira, NY
Flood risk 7/10 · Major
- FEMA flood zone
- X (shaded)
- Chance of flooding over 30 yrs
- 0.76%
- Est. flood insurance / yr
- $473 – $860
Fire risk 3/10 · Minor
- Est. fire insurance / yr
- $691 – $1,283
Heat risk 3/10 · Minor
- Hot days now (above 96°F)
- 7 days/yr
- Hot days in 30 yrs
- 15 days/yr
Wind risk 2/10 · Minimal
- Chance of severe wind over 30 yrs
- 1.0%
Air-quality risk 1/10 · Minimal
- Unhealthy air days now
- 0 days/yr
- Unhealthy air days in 30 yrs
- 0 days/yr
Risk factors via First Street. Map © Google.
Why this score? — see what drove the B grade
The composite is a weighted blend of 9 inputs, each scored 0–100. Each bar is that input's sub-score; the figure is the points it added to the 100-point composite (weight × sub-score).
- Cash flow +30.0/30.0
- 1% rule +10.0/10.0
- DSCR +10.0/10.0
- Appreciation +10.0/10.0
- Livability +3.1/5.0
- Rent growth +2.5/5.0
- Condition / age +2.5/5.0
- Schools +2.4/10.0
- ARV discount +1.4/15.0
$85,000
🖨 Deal sheet 📄 Offer letter ✓ Due diligence
Listing remarks MLS
This 4-bedroom home offers a welcoming front porch and a driveway for off-street parking. The main level features 2 bedrooms, a half bath, dining room, living room, and kitchen, while the second floor offers 2 additional bedrooms and a full bath. Updated flooring enhances the living room and dining room. Conveniently located near shopping, restaurants, parks, schools, biking, and hiking trails. Tenant occupied, please allow 48 hours’ notice for appointment. Tenant may be present. No appliances will convey with the sale, as all are tenant-owned.
Key facts
- Kitchen
- Living room
- Dining room
Tags
Neighborhood map
What this means for you Summary
Snapshot
- This is a 3-bed/1.0-bath single-family listed at $85k.
Deal economics
- At list price, monthly cash flow is $376 ($5k/yr) — positive.
- The deal already cash-flows at list — no discount required.
- Meets the 1% rule at list price ($1k rent vs $85k).
- Recommended offer: $82k (3.0% below list) — sets the bar for market timing.
- Cap rate 12.4% vs local median 10.1% in Elmira — meaningfully above typical; check what's discounted (condition, days-on-market, listing class) to confirm the premium yield is real.
Location & tenants
- Location reads 62/100 on livability (#832 in NY) — a middle-class / working-renter tenant base. Strengths: cost of living A+, housing A+, health & safety A+; Watch: schools F, crime F, amenities F.
- Elmira City School District (urban): math 23% / reading 35% proficiency, ranked #580 of 590 in NY (top 98%) — low school quality limits family demand, transient renter base, plan for 1-2y turnover.
- Market conditions: 78 active listings in the ZIP; 4 comparable units currently listed for rent nearby; rentals lingering (median 44d on market — plan ~5-8 weeks vacancy on turnover, expect pricing pressure); 100% of comp listings sitting > 30 days — soft ceiling on asking rent; 91 units permitted in Chemung County in 2024 (63 in 5+ unit buildings).
Forward outlook
- In year one you build about $9k of equity ($588 loan paydown + $8k appreciation (10.0% local appreciation)).
- Chemung County population projected at -17% by 2050 — secular population decline; favor cash flow + early exit over multi-decade hold.
- At projected returns (10.0% appreciation + 3.0% rent growth), your $24k cash investment doubles in ~2 years — after that, you're playing with house money.
- By year 4, paydown + projected appreciation supports a ~$32k cash-out refi (75% LTV) — recoverable capital for the next deal without selling this one.
Negotiation context
- It's been on market 54 days — a 3% lower offer ($82k) is reasonable based on typical stale-listing flexibility.
- 3 sale attempts since 3y ago with the ask held roughly flat each time — persistent listings suggest the price (not the market) is what's stuck; bring a comps-based counter.
Risks & watch-outs
- Watch-outs: flood insurance adds $56/mo; built in 1920 — expect roof / HVAC / electrical / plumbing capex.
- Climate carrying-cost: major flood risk — expect insurance premiums to compound above CPI over the hold.
Questions for the listing agent
- It's been on market 54 days. Have you received any prior offers? Is the seller open to a 3% concession, seller financing, or rate buy-down credit?
- Built in 1920 — when were the roof, HVAC, electrical panel, plumbing, and water heater last replaced?
- What's the actual annual flood-insurance premium (NFIP or private), and is the property in a SFHA with mandatory coverage?
- Is there a deadline driving the sale (1031 exchange, divorce, estate, relocation)? That informs how much negotiation room exists.
- Schools are F-rated, which usually means shorter tenancies and higher turnover. Who's the typical renter profile here, and what's been the actual vacancy rate?
- Crime grade is F in this area — have there been break-ins, vandalism, or insurance claims at this property in the last 3 years? What carrier currently insures it and at what premium?
- What's the average days-on-market for RENTAL listings here right now (not sales)? A rising rental-DOM trend means longer vacancies and softer asking-rent achievability than the comps imply.
- What's the recent tenant-quality profile in this submarket — average credit score on applications, eviction rate, late-payment / NSF rate, and stable-employment percentage? A property-management company in the area should have these aggregated.
- How much new for-sale + rental construction is in the pipeline within 1–3 miles? Heavy new supply typically softens prices + rents 12–24 months out; constrained supply supports both.
Investment metrics
- 1% rule
- 1.59% ✓
- Cap rate
- 12.39%
- Cash-on-cash
- 21.76%
- DSCR
- 1.97
- GRM
- 5.3
CMA / ARV
- ARV (median comp)
- $74,792
- List price
- $85,000
- Delta
- 13.65%
- Verdict
- OVERPRICED
- Comps
- 20 within 1.0 mi
Show comp detail 12 sales within ~0.75 mi
| Address | Dist | Beds/Ba | Sqft | Sold | Price | $/sf | Match |
|---|---|---|---|---|---|---|---|
| 1218 Lackawanna Ave | 0.16mi | 3/1.0 | 1,763 (-2%) | 15mo | $57,000 | $32 | 77 |
| 1230 Lake St | 0.16mi | 4/1.5 (+1) | 1,768 (-1%) | 13mo | $124,900 | $71 | 72 |
| 1227 Lake St | 0.12mi | 3/1.5 | 1,664 (-7%) | 11mo | $49,000 | $29 | 71 |
| 918 Magee St | 0.69mi | 4/1.0 (+1) | 1,812 (+1%) | 1mo | $112,000 | $62 | 60 |
| 1213 Magee St | 0.44mi | 3/2.0 | 1,908 (+6%) | 6mo | $189,361 | $99 | 60 |
| 1201 Magee St | 0.44mi | 3/2.0 | 1,686 (-6%) | 8mo | $176,000 | $104 | 59 |
| 1315 Grand Central Ave | 0.07mi | 4/1.5 (+1) | 1,560 (-13%) | 15mo | $54,000 | $35 | 56 |
| 756 Carpenter St | 0.54mi | 4/2.0 (+1) | 1,896 (+6%) | 2mo | $105,000 | $55 | 55 |
| 965 Wisner | 0.64mi | 3/1.0 | 1,890 (+5%) | 16mo | $11,000 | $6 | 48 |
| 218 Grant St | 0.51mi | 2/1.0 (-1) | 1,580 (-12%) | 5mo | $89,000 | $56 | 47 |
| 957 Oak St | 0.51mi | 4/1.5 (+1) | 1,626 (-9%) | 13mo | $54,590 | $34 | 43 |
| 950 N Main St | 0.71mi | 4/1.5 (+1) | 1,644 (-8%) | 7mo | $37,000 | $23 | 40 |
Match score weights: distance 35% · size 25% · config 20% · recency 20%. Top-matched comps best support the ARV.
Projected returns pro-forma
10.0% appreciation · 3.0% rent growth · sell at horizon
- IRR
- 38.4%
- Equity multiple
- 3.95×
- Total profit
- $70,329
- Equity at exit
- $76,575
- IRR
- 33.1%
- Equity multiple
- 8.92×
- Total profit
- $188,436
- Equity at exit
- $165,136
Cash invested: $23,800 (down + closing). Projections, not guarantees.
Landlord ↔ Tenant lean methodology
- Overall (STATE)
- 15 Strongly Tenant-Friendly
- State New York
- 15 Strongly Tenant-Friendly · D+10
- County
- — inherits STATE
- City
- — inherits STATE
ZIP-level market 14901
- Home prices YoY
- 15.9%
- Active inventory
- 78
- Price-to-rent
- 5.3×
Monthly cashflow live
- Estimated rent
- $1,348 medium interval (Pro) →
- Mortgage (P&I)
- −$446
- Tax from tax record
- −$152 /mo · $1,829/yr
- Insurance
- −$35
- Flood insurance flood zone
- −$56 /mo · $666/yr
- HOA
- −$0
- Vacancy / Maint / Mgmt
- −$283
- Net cashflow
- $376
Break-even live
UW: 25.0% down · 7.5% · 30yr · 1.5% tax · 5.0% vac · 8.0% maint · 8.0% mgmt
Financing live
Cash to close
- Down payment
- $21,250
- Closing costs
- $2,550
- Reserves months
- —
- Total cash needed
- —
Loan-product check · same deal, 3 products live
Conventional
25% down · 7.5% · 30yr
- Down + closing
- —
- Monthly P&I
- —
- Monthly cashflow
- —
- DSCR
- —
- Eligible?
- —
Personal DTI + credit; lowest rate.
DSCR
20% down · 8.5% · 30yr
- Down + closing
- —
- Monthly P&I
- —
- Monthly cashflow
- —
- DSCR
- —
- Eligible?
- —
No personal income docs; deal must DSCR.
Hard money
10% down · 12.0% · 12mo
- Down + closing
- —
- Monthly P&I
- —
- Monthly cashflow
- —
- DSCR
- —
- Eligible?
- —
Short-term bridge; refi at stabilization.
Rent comps 4 comps
| Address | Beds | Baths | Sqft | Rent | $/sqft | DOM | Units | Dist |
|---|---|---|---|---|---|---|---|---|
| 355 W Clinton St Unit 1 Elmira, NY | 3.0 | 1.5 | 1650 | $1,400 | $0.85 | 43d | 1 | 1.24mi |
| 106 W 2nd St Unit A Elmira, NY | 3.0 | 1.0 | 1395 | $1,400 | $1.00 | 43d | 1 | 1.24mi |
| 357 W Clinton St Unit 1 Elmira, NY | 2.0 | 1.5 | 1650 | $1,500 | $0.91 | 43d | 1 | 1.24mi |
| 454 W 2nd St Unit 1 Elmira, NY | 2.0 | 1.0 | 1400 | $1,000 | $0.71 | 43d | 1 | 1.49mi |
Listing history 14 events
-
2026-06-09days on market $85,000 Active 54 DOM
-
2026-06-08days on market $85,000 Active 53 DOM
-
2026-06-07days on market $85,000 Active 52 DOM
-
2026-06-05days on market $85,000 Active 49 DOM
-
2026-06-03days on market $85,000 Active 48 DOM
-
2026-06-02days on market $85,000 Active 47 DOM
-
2026-06-01days on market $85,000 Active 46 DOM
-
2026-05-31days on market $85,000 Active 45 DOM
-
2026-05-30days on market $85,000 Active 44 DOM
-
2026-04-16$85,000 Active 556-char remark
Show marketing remark (556 chars)
This 4-bedroom home offers a welcoming front porch and a driveway for off-street parking. The main level features 2 bedrooms, a half bath, dining room, living room, and kitchen, while the second floor offers 2 additional bedrooms and a full bath. Updated flooring enhances the living room and dining room. Conveniently located near shopping, restaurants, parks, schools, biking, and hiking trails. Tenant occupied, please allow 48 hours’ notice for appointment. Tenant may be present. No appliances will convey with the sale, as all are tenant-owned.
-
2024-02-22historical $1,000
-
2024-01-26$1,000
-
2023-06-19historical
-
2023-02-21$46,900
ⓘ Source: listings_history table (triggers on properties + properties_extension) + one-shot
backfill from property_details.listing_events for pre-trigger history.
Tax reassessment forecast NY · Partial reset (capped growth)
- Current annual tax
- $1,829 · $152/mo
- Projected year-2 tax
- $1,829 · $152/mo
- Expected delta
- $0/yr ($0/mo · 0.0%)
ⓘ Screening estimate from a state-policy table — verify with the county assessor before closing.
Climate risk First Street
- Flood 7/10 Severe FEMA zone X (shaded) · 76% chance over 30 yrs
- Wildfire 3/10 Moderate
- Heat 3/10 Moderate 7 d/yr ≥96°F today · 15 d/yr by 30 yrs out
- Wind 2/10 Low 100% chance of damaging wind over 30 yrs
- Air quality 1/10 Low 0 unhealthy d/yr today · 0 by 30 yrs out
Nearby sold comps map
Loading sold comps map…
Walkable amenities ~0.75 mi
Loading nearby amenities…
Taxation est. · year 1
- Rental income
- $16,180
- − Mortgage interest
- −$4,761
- − Property taxes
- −$1,829
- − Insurance
- −$1,092
- − Repairs & maintenance
- −$1,294
- − Management
- −$1,294
- − Depreciation
- −$2,473
- Taxable income
- $3,437
- Est. tax owed @ 24.0%
- −$825
- After-tax cash flow
- $3,688/yr
For passive investors: Depreciation is non-cash, so a rental often shows a tax loss while cash-flowing — sheltering income. Rental losses are passive: they offset passive income freely, and up to $25,000/yr can offset ordinary (W-2) income if you actively participate and your MAGI is under $100k (phasing out to $0 by $150k); unused losses carry forward. On sale, claimed depreciation is recaptured at up to 25%, and gains may owe capital-gains tax (a 1031 exchange can defer both). Figures are a year-1 estimate at your 24.0% rate — not tax advice; consult a CPA.
Schools (NCES district)
- District
- Elmira City School District
- NCES district ID
- 3610560
- Math proficiency
- 23% ▼ -7.00%
- Reading proficiency
- 35% ▲ 7.00%
- Median HH income
- $40,180
- Composite
- 24.39/100
- National rank
- #7688
- State rank
- #580 of 590 in NY
Livability — Elmira
- Score
- 62/100
- State rank
- #832
- US rank
- #16139
Category grades
Schools grade is shown separately in the Schools card above.
Census & demographics
- Census place
- Elmira, NY
- City population
- 14,276
- Population (ZIP)
- 14,430
Population outlook (Chemung County) Hauer SSP2
- Today (2025)
- 82,931 people
- By 2030
- 80,356 · -3.1%
- By 2040
- 74,745 · -9.9%
- By 2050
- 69,012 · -16.8%
- By 2075
- 55,689 · -32.8%
- By 2100
- 41,428 · -50.0%
Race, ethnicity, and origin ACS 2023
- Neighborhood character
- Predominantly White (70%)
- Race & ethnicity
- White 70% Black 15% Two or more races 7% Hispanic / Latino 7% Asian 1%
- Hispanic origin (detail)
- Mexican 1% Puerto Rican 3%
- Common ancestry
- Romanian 4% Slovak 3% Iranian 2%
- Foreign-born
- 4% · Canada, China
- Languages at home
- 93% English-only · Spanish 3% Russian/Polish/Slavic 1% Chinese 1%
Political lean MEDSL · Chemung
- 2024 margin
- R (+16.8) · D 41.6% · R 58.4%
- 2008→2024 swing
- -15.6pp toward R · 2008: -1.2pp · 2024: -16.8pp
- All cycles
- 2024: R+16.8 2020: R+13.4 2016: R+20.0 2012: R+2.9 2008: R+1.2
Not yet ingested
- Civics
- —
Market trends
- HPI YoY
- ▲ 32.34%
- Current HPI
- 236.2674
- Rent YoY
- —
- Metro
- —
- State GDP YoY
- ▲ 2.60%
- F500 in state
- 92
Industry mix (Fortune 500 HQ in NY)
| Industry | F500 HQs | Revenue |
|---|---|---|
| Financial Services | 10 | $950B |
|
||
| Consumer Goods | 9 | $162B |
|
||
| Insurance | 4 | $225B |
|
||
| Telecommunications | 2 | $144B |
|
||
| Pharmaceuticals | 2 | $112B |
|
||
| Media / Entertainment | 2 | $69B |
|
||
Price history
+81.2% since first listed5 events — show timeline
- 2026-04-16 Listed $85,000 UNYREIS
- 2024-02-22 Rental Removed $1,000 ECMLS
- 2024-01-26 Listed for Rent $1,000 ECMLS
- 2023-06-19 Listing Removed — UNYREIS
- 2023-02-21 Listed $46,900 UNYREIS
Property tax history
+4.9%/yrLatest (2025): $1,829 · -24.5% YoY. Source: county tax records.
Cash-flow waterfall
monthlySold comps — $/sqft
last 12 mo · ≤1 miLoading sold comps…