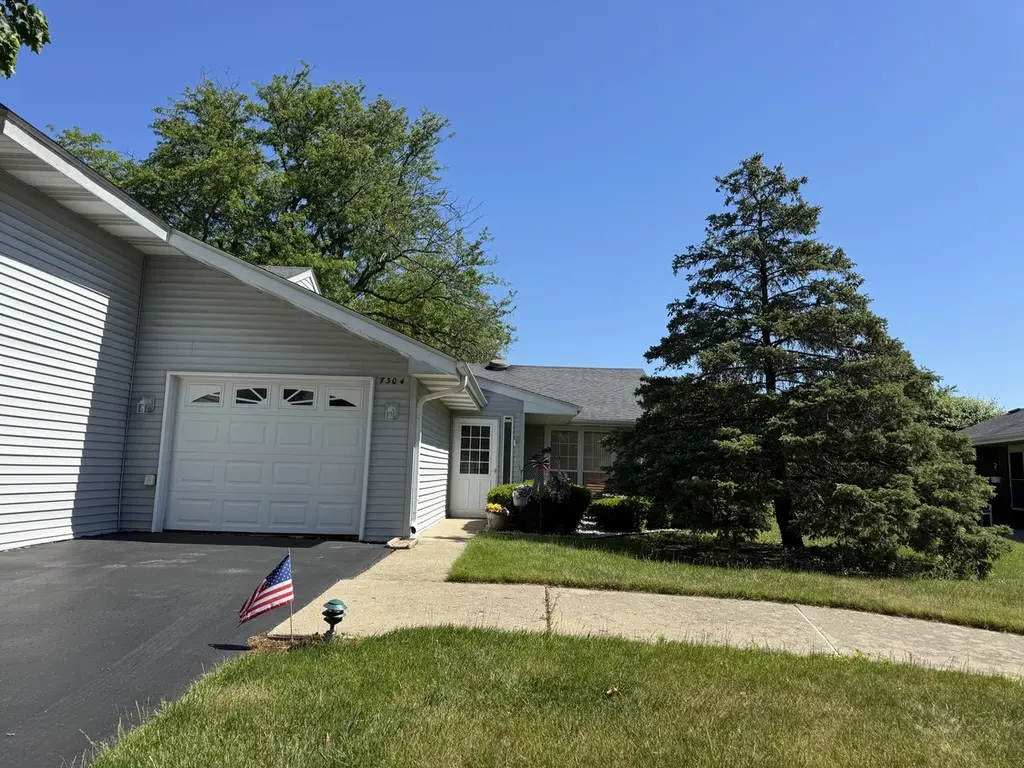
7304 Lynda Ct · Fox Lake, IL
Flood risk 1/10 · Minimal
- FEMA flood zone
- X (unshaded)
- Chance of flooding over 30 yrs
- 0.0%
- Est. flood insurance / yr
- $507 – $1,088
Fire risk 3/10 · Minor
- Est. fire insurance / yr
- $804 – $1,492
Heat risk 2/10 · Minimal
- Hot days now (above 101°F)
- 7 days/yr
- Hot days in 30 yrs
- 14 days/yr
Wind risk 2/10 · Minimal
- Chance of severe wind over 30 yrs
- —
Air-quality risk 2/10 · Minimal
- Unhealthy air days now
- 1 days/yr
- Unhealthy air days in 30 yrs
- 1 days/yr
Risk factors via First Street. Map © Google.
Why this score? — see what drove the D- grade
The composite is a weighted blend of 9 inputs, each scored 0–100. Each bar is that input's sub-score; the figure is the points it added to the 100-point composite (weight × sub-score).
- Cash flow +15.4/30.0
- 1% rule +5.9/10.0
- DSCR +4.7/10.0
- Livability +3.7/5.0
- Rent growth +2.5/5.0
- Condition / age +2.5/5.0
- Schools +2.3/10.0
- ARV discount +0.0/15.0
- Appreciation +0.0/10.0
$224,900
🖨 Deal sheet 📄 Offer letter ✓ Due diligence
Listing remarks
Welcome Home! This charming and move-in ready San Tropez model enjoys one of the most desirable locations in the community, directly across from the picturesque pond and gazebo. Freshly painted and featuring hard-surface flooring throughout, this home offers comfortable, low-maintenance living. The bright eat-in kitchen includes a spacious storage closet with a newer all-in-one washer and dryer. Relax on the inviting front sun porch or enjoy the convenience of the attached one-car garage. Life in Leisure Village offers an exceptional lifestyle with amenities including a 3-hole golf course, swimming pool, fitness center, craft room, woodworking shop, bocce ball courts, scenic ponds, and a fu
Key facts
- Craft room
- Fitness center
- 3-hole golf course
Tags
Property features AI
Finance
- Other: Not currently leased; Special service area: No
- HOA & community: Monthly association fee of $303; Association covers insurance, clubhouse, pool, exterior maintenance, lawn care, and snow removal; Community amenities include exercise room, golf course, health club, park, party room, and pool; Manager off-site; Pets allowed (cats and dogs), maximum pet weight unrestricted
Exterior
- Parking: Attached garage with garage door opener; Asphalt parking; One garage/one total parking space
- Utilities: Public water; Public sewer
- Home design: Attached single (1/2 duplex) condo; Model: San Tropez; Entry at level 1; Adult community; Disability access available
- Construction: Vinyl siding; Building age approximately 41–50 years; Part of a two-unit building
- Exterior features: Porch; Waterfront (common)
Interior
- Kitchen: Kitchen with eating area/table space 12 x 10; Range; Dishwasher; Refrigerator
- Bedrooms: Master bedroom (main level); Second bedroom (main level) 12 x 10
- Flooring: Laminate flooring in living room and dining area; Vinyl flooring in kitchen; Linoleum flooring in master bedroom
- Bathrooms: One full bathroom
- Heating & cooling: Electric heating; Central air conditioning
- Interior features: Five total rooms; Enclosed porch (main level); Dining area combined with living room; Family room; Living room
- Laundry & utility: Main-level laundry 6 x 4
Neighborhood map
What this means for you Summary
Snapshot
- This is a 1-bed/1.0-bath townhouse listed at $225k.
Deal economics
- At list price, monthly cash flow is $86 ($1k/yr) — positive.
- The deal already cash-flows at list — no discount required.
- Meets the 1% rule at list price ($2k rent vs $225k).
- Recommended offer: $222k (1.5% below list) — sets the bar for market timing.
Location & tenants
- Location reads 74/100 on livability (#247 in IL, #4,462 nationally) — a middle-class / working-renter tenant base. Strengths: cost of living A+, housing A+, commute A; Watch: amenities D+, schools F, health & safety F.
- Grant Chsd 124 (suburban): math 23% / reading 27% proficiency, ranked #296 of 620 in IL (top 48%) — low school quality limits family demand, transient renter base, plan for 1-2y turnover.
- Market conditions: 78 active listings in the ZIP; 4 comparable units currently listed for rent nearby; rentals leasing fast (median 1d on market — plan ~1-2 weeks tenant-placement turnaround); 948 units permitted in Lake County in 2024 (424 in 5+ unit buildings).
Forward outlook
- Local home prices are declining (-3.0%/yr); year-one equity from $2k of loan paydown is wiped out by about $7k of value loss. Plan a longer hold.
- Lake County population projected to shrink 8% by 2050 — rents likely to lag national; underwrite the cash flow, not the appreciation.
Negotiation context
- It's been on market 16 days — a 2% lower offer ($222k) is reasonable based on typical stale-listing flexibility.
- Current owner paid $112k; list at $225k implies a 101% gain — meaningful room to come down on a strong offer.
Questions for the listing agent
- Built in 1978 — when were the roof, HVAC, electrical panel, plumbing, and water heater last replaced?
- What does the HOA fee cover, when was the last increase, and are there any pending special assessments or reserve-fund shortfalls?
- Is there a deadline driving the sale (1031 exchange, divorce, estate, relocation)? That informs how much negotiation room exists.
- Schools are F-rated, which usually means shorter tenancies and higher turnover. Who's the typical renter profile here, and what's been the actual vacancy rate?
- The area grade is low — what's the realistic commute time and amenity access for the typical tenant pool here? Any planned neighborhood developments (good or bad) we should know about?
- What's the average days-on-market for RENTAL listings here right now (not sales)? A rising rental-DOM trend means longer vacancies and softer asking-rent achievability than the comps imply.
- What's the recent tenant-quality profile in this submarket — average credit score on applications, eviction rate, late-payment / NSF rate, and stable-employment percentage? A property-management company in the area should have these aggregated.
- How much new for-sale + rental construction is in the pipeline within 1–3 miles? Heavy new supply typically softens prices + rents 12–24 months out; constrained supply supports both.
Investment metrics
- 1% rule
- 1.09% ✓
- Cap rate
- 6.75%
- Cash-on-cash
- 1.64%
- DSCR
- 1.07
- GRM
- 7.6
CMA / ARV
- ARV (on-the-fly)
- $192,855
- Comps found
- 10
Show comp detail 10 sales within ~0.75 mi
| Address | Dist | Beds/Ba | Sqft | Sold | Price | $/sf | Match |
|---|---|---|---|---|---|---|---|
| 7108 Granada Ln #280 | 0.00mi | 2/1.0 (+1) | 989 (0%) | 6mo | $204,000 | $206 | 90 |
| 7314 Chevy Chase Ct | 0.15mi | 2/1.0 (+1) | 975 (-1%) | 5mo | $170,000 | $174 | 81 |
| 7105 Saint Tropez Ct #297 | 0.26mi | 2/1.0 (+1) | 989 (0%) | 2mo | $170,000 | $172 | 81 |
| 7411 Leisure Village Ave #7411 | 0.31mi | 2/1.0 (+1) | 975 (-1%) | 3mo | $185,000 | $190 | 76 |
| 7301 Dunwood Ct #114 | 0.15mi | 2/1.0 (+1) | 1,066 (+8%) | 12mo | $205,000 | $192 | 65 |
| 7405 Chevy Chase Ct | 0.34mi | 2/1.0 (+1) | 1,076 (+9%) | 1mo | $230,000 | $214 | 64 |
| 7310 Chevy Chase Ct #54 | 0.14mi | 2/1.0 (+1) | 1,066 (+8%) | 14mo | $208,000 | $195 | 64 |
| 7315 Custer Ct | 0.15mi | 2/1.0 (+1) | 1,066 (+8%) | 22mo | $205,000 | $192 | 57 |
| 7432 Cresthill Ln | 0.32mi | 2/1.0 (+1) | 1,066 (+8%) | 21mo | $215,000 | $202 | 50 |
| 7418 Clarendon Ct | 0.40mi | 2/1.0 (+1) | 1,066 (+8%) | 22mo | $210,000 | $197 | 45 |
Match score weights: distance 35% · size 25% · config 20% · recency 20%. Top-matched comps best support the ARV.
Projected returns pro-forma
-3.0% appreciation · 3.0% rent growth · sell at horizon
- IRR
- -13.6%
- Equity multiple
- 0.51×
- Total profit
- $-30,725
- Equity at exit
- $33,533
- IRR
- -4.5%
- Equity multiple
- 0.70×
- Total profit
- $-18,771
- Equity at exit
- $19,445
Cash invested: $62,972 (down + closing). Projections, not guarantees.
Landlord ↔ Tenant lean methodology
- Overall (STATE)
- 43 Moderately Tenant-Leaning
- State Illinois
- 43 Moderately Tenant-Leaning · D+7
- County
- — inherits STATE
- City
- — inherits STATE
ZIP-level market 60020
- Home prices YoY
- -30.7%
- Active inventory
- 78
- Price-to-rent
- 7.6×
Monthly cashflow live
- Estimated rent
- $2,460 medium interval (Pro) →
- Mortgage (P&I)
- −$1,179
- Tax est. 1.5%
- −$281 /mo · $3,374/yr
- Insurance
- −$94
- HOA
- −$303
- Vacancy / Maint / Mgmt
- −$517
- Net cashflow
- $86
Break-even live
UW: 25.0% down · 7.5% · 30yr · 1.5% tax · 5.0% vac · 8.0% maint · 8.0% mgmt
Financing live
Cash to close
- Down payment
- $56,225
- Closing costs
- $6,747
- Reserves months
- —
- Total cash needed
- —
Loan-product check · same deal, 3 products live
Conventional
25% down · 7.5% · 30yr
- Down + closing
- —
- Monthly P&I
- —
- Monthly cashflow
- —
- DSCR
- —
- Eligible?
- —
Personal DTI + credit; lowest rate.
DSCR
20% down · 8.5% · 30yr
- Down + closing
- —
- Monthly P&I
- —
- Monthly cashflow
- —
- DSCR
- —
- Eligible?
- —
No personal income docs; deal must DSCR.
Hard money
10% down · 12.0% · 12mo
- Down + closing
- —
- Monthly P&I
- —
- Monthly cashflow
- —
- DSCR
- —
- Eligible?
- —
Short-term bridge; refi at stabilization.
Rent comps 4 comps
| Address | Beds | Baths | Sqft | Rent | $/sqft | DOM | Units | Dist |
|---|---|---|---|---|---|---|---|---|
| 32 Montego Colony #1 Fox Lake, IL | 2.0 | 1.0 | 690 | $1,400 | $2.03 | 43d | 1 | 0.46mi |
| 38464 N 8th St Spring Grove, IL | 1.0 | 1.0 | 625 | $2,000 | $3.20 | 1d | 1 | 0.66mi |
| 39259 N Jackson Dr Unit 1374781P Spring Grove, IL | 2.0 | 1.0 | 990 | $4,725 | $4.77 | 1d | 1 | 0.73mi |
| 38381 N 6th Ave Spring Grove, IL | 2.0 | 1.0 | 600 | $1,095 | $1.82 | 1d | 1 | 0.79mi |
HOA detail
- Monthly dues
- $303 · $3,636/yr
- Likely covers
- poolgym
Listing history 11 events
-
2026-06-18days on market $224,900 Active 16 DOM
-
2026-06-17days on market $224,900 Active 15 DOM
-
2026-06-16days on market $224,900 Active 14 DOM
-
2026-06-15days on market $224,900 Active 13 DOM
-
2026-06-13days on market $224,900 Active 11 DOM
-
2026-06-09days on market $224,900 Active 7 DOM
-
2026-06-08days on market $224,900 Active 6 DOM
-
2026-06-07days on market $224,900 Active 5 DOM
-
2026-06-04days on market $224,900 Active 2 DOM
-
2026-06-03remarks 699-char remark
-
2026-06-03$224,900 Active 1 DOM
ⓘ Source: listings_history table (triggers on properties + properties_extension) + one-shot
backfill from property_details.listing_events for pre-trigger history.
Climate risk First Street
- Flood 1/10 Low FEMA zone X (unshaded) · 0% chance over 30 yrs
- Wildfire 3/10 Moderate
- Heat 2/10 Low 7 d/yr ≥101°F today · 14 d/yr by 30 yrs out
- Wind 2/10 Low
- Air quality 2/10 Low 1 unhealthy d/yr today · 1 by 30 yrs out
Nearby sold comps map
Loading sold comps map…
Walkable amenities ~0.75 mi
Loading nearby amenities…
Taxation est. · year 1
- Rental income
- $29,522
- − Mortgage interest
- −$12,598
- − Property taxes
- −$3,374
- − Insurance
- −$1,124
- − Repairs & maintenance
- −$2,362
- − Management
- −$2,362
- − HOA
- −$3,636
- − Depreciation
- −$6,543
- Taxable loss
- −$2,476
- Est. tax savings @ 24.0%
- +$594
- After-tax cash flow
- $1,630/yr
For passive investors: Depreciation is non-cash, so a rental often shows a tax loss while cash-flowing — sheltering income. Rental losses are passive: they offset passive income freely, and up to $25,000/yr can offset ordinary (W-2) income if you actively participate and your MAGI is under $100k (phasing out to $0 by $150k); unused losses carry forward. On sale, claimed depreciation is recaptured at up to 25%, and gains may owe capital-gains tax (a 1031 exchange can defer both). Figures are a year-1 estimate at your 24.0% rate — not tax advice; consult a CPA.
Schools (NCES district)
- District
- Grant Chsd 124
- NCES district ID
- 1717340
- Math proficiency
- 23% ▼ -9.00%
- Reading proficiency
- 27% ▼ -7.00%
- Median HH income
- $59,450
- Composite
- 22.95/100
- National rank
- #7989
- State rank
- #296 of 620 in IL
Livability — Fox Lake
- Score
- 74/100
- State rank
- #247
- US rank
- #4462
Category grades
Schools grade is shown separately in the Schools card above.
Census & demographics
- Census place
- Fox Lake, IL
- City population
- 10,846
- Population (ZIP)
- 10,846
Population outlook (Lake County) Hauer SSP2
- Today (2025)
- 700,217 people
- By 2030
- 693,290 · -1.0%
- By 2040
- 673,588 · -3.8%
- By 2050
- 643,556 · -8.1%
- By 2075
- 562,792 · -19.6%
- By 2100
- 457,715 · -34.6%
Race, ethnicity, and origin ACS 2023
- Neighborhood character
- Predominantly White (80%)
- Race & ethnicity
- White 80% Hispanic / Latino 12% Two or more races 10% Black 3%
- Hispanic origin (detail)
- Mexican 10% Puerto Rican 1%
- Common ancestry
- Romanian 15% Portuguese 2% Italian 2%
- Foreign-born
- 10% · Canada, South Korea
- Languages at home
- 87% English-only · Spanish 6% Russian/Polish/Slavic 3% Other Indo-European 1%
Political lean MEDSL · Lake
- 2024 margin
- Strong D (+20.8) · D 59.7% · R 38.9% · Other 1.4%
- 2008→2024 swing
- +1.1pp toward D · 2008: 19.6pp · 2024: 20.8pp
- All cycles
- 2024: D+20.8 2020: D+24.1 2016: D+20.3 2012: D+8.1 2008: D+19.6
Not yet ingested
- Civics
- —
Market trends
- HPI YoY
- ▼ -97.19%
- Current HPI
- 219.6301
- Rent YoY
- —
- Metro
- —
- State GDP YoY
- ▲ 1.59%
- F500 in state
- 60
Industry mix (Fortune 500 HQ in IL)
| Industry | F500 HQs | Revenue |
|---|---|---|
| Insurance | 4 | $201B |
|
||
| Consumer Goods | 4 | $87B |
|
||
| Industrial Machinery | 3 | $64B |
|
||
| Healthcare | 2 | $55B |
|
||
| Retail / Pharmacy | 1 | $148B |
|
||
| Agriculture / Food | 1 | $86B |
|
||
Price history
+199.9% since first listed3 events — show timeline
- 2026-06-02 Listed $224,900 MRED as Distributed by MLS Grid
- 2004-05-26 Sold (Public Records) $112,000 Public Records
- 1991-08-01 Sold (Public Records) $75,000 Public Records
Property tax history
-19.1%/yrLatest (2024): $54 · -6.8% YoY. Source: county tax records.
Cash-flow waterfall
monthlySold comps — $/sqft
last 12 mo · ≤1 miLoading sold comps…