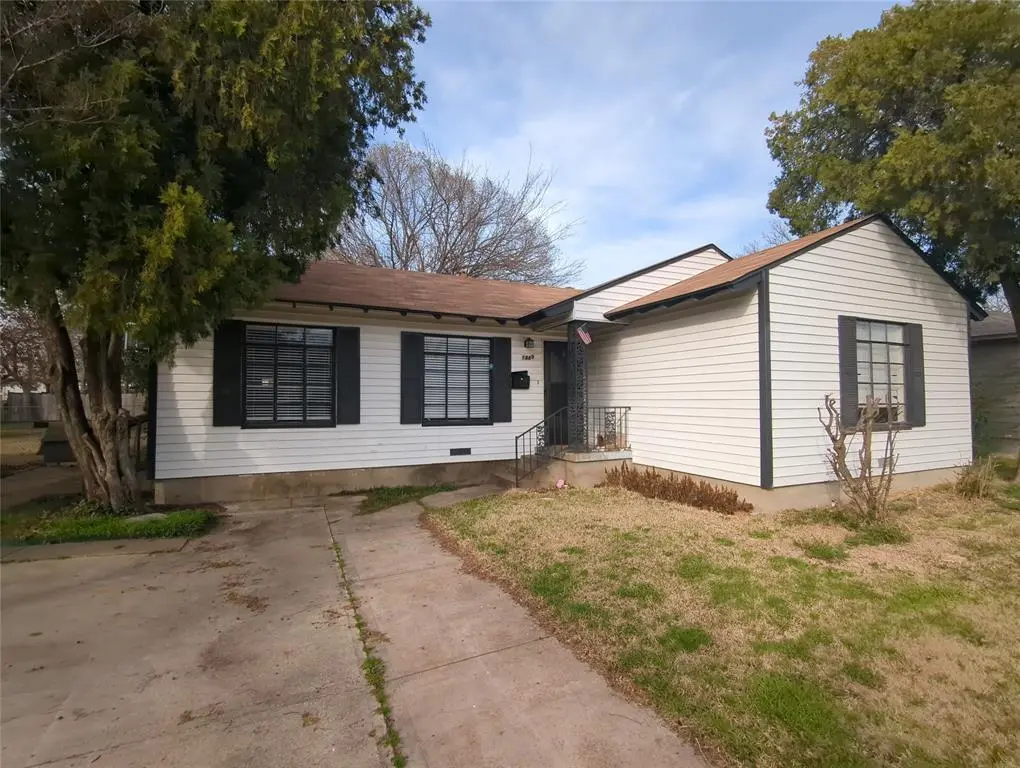
1449 Nash St · Garland, TX
Flood risk 1/10 · Minimal
- FEMA flood zone
- X (unshaded)
- Chance of flooding over 30 yrs
- 0.0%
- Est. flood insurance / yr
- $507 – $1,088
Fire risk 1/10 · Minimal
- Est. fire insurance / yr
- $1,222 – $2,270
Heat risk 7/10 · Major
- Hot days now (above 109°F)
- 7 days/yr
- Hot days in 30 yrs
- 20 days/yr
Wind risk 6/10 · Moderate
- Chance of severe wind over 30 yrs
- 27.0%
Air-quality risk 3/10 · Minor
- Unhealthy air days now
- 3 days/yr
- Unhealthy air days in 30 yrs
- 3 days/yr
Risk factors via First Street. Map © Google.
Why this score? — see what drove the D grade
The composite is a weighted blend of 9 inputs, each scored 0–100. Each bar is that input's sub-score; the figure is the points it added to the 100-point composite (weight × sub-score).
- ARV discount +15.0/15.0
- Cash flow +8.8/30.0
- 1% rule +4.3/10.0
- Livability +3.7/5.0
- Schools +2.9/10.0
- Condition / age +2.5/5.0
- DSCR +2.4/10.0
- Rent growth +1.4/5.0
- Appreciation +0.0/10.0
$199,999
🖨 Deal sheet 📄 Offer letter ✓ Due diligence
Listing remarks MLS
Brand new AC and heat system! Great investment opportunity near downtown Garland! Tenant occupied now, lease amount is $1695 and expires April 30, 2027. Nice and open living and dining off kitchen. Gas oven range, dishwasher, and microwave included. Full size washer and dryer connections. Three beds and one bath. Converted garage is the third bedroom. Fenced backyard with chain link fence and storage building. Please email agent with any questions.
Key facts
- Gas oven range
- Storage building
- Fenced backyard
Tags
Neighborhood map
What this means for you Summary
Snapshot
- This is a 3-bed/1.0-bath single-family listed at $200k.
Deal economics
- At list price, monthly cash flow is $-164 ($-2k/yr) — negative.
- To cash-flow at today's rent, offer at most $171k (14.5% below list).
- To meet the 1% rule (rent ≥ 1% of price), the offer needs to be $186k (7.1% below list).
- Recommended offer: $171k (14.5% below list) — sets the bar for cash-flow.
- Cap rate 5.3% vs local median 3.5% in Garland — top-decile yield for the area; either an underpriced asset or a hidden risk that comps aren't pricing in. Stress-test before assuming the spread holds.
Location & tenants
- Location reads 74/100 on livability (#165 in TX, #4,447 nationally) — a middle-class / working-renter tenant base. Strengths: commute A+, housing A+, cost of living A-; Watch: amenities C-, schools D+, health & safety F.
- Garland ISD (suburban): math 27% / reading 37% proficiency, ranked #553 of 826 in TX (top 67%) — families likely to look elsewhere, expect single-tenant / working-renter base with shorter leases.
- Market conditions: Rents falling (-4.5%/yr); 108 active listings in the ZIP; 33 comparable units currently listed for rent nearby; rentals at typical pace (median 15d on market — plan ~3-4 weeks tenant-placement turnaround); 12,577 units permitted in Dallas County in 2024 (6,829 in 5+ unit buildings).
- This rent runs 35% of the median local income ($64k/yr) — at the standard rent-burdened threshold; future hikes will face affordability resistance.
Forward outlook
- Local home prices are declining (-3.0%/yr); year-one equity from $1k of loan paydown is wiped out by about $6k of value loss. Plan a longer hold.
- Dallas County population projected at +35% by 2050 — long-run rental-demand tailwind backs the buy-and-hold thesis.
Negotiation context
- It's been on market 135 days — a 12% lower offer ($176k) is reasonable based on typical stale-listing flexibility.
- 10 sale attempts since 4y ago; this cycle's ask has dropped $30k (13%) from the opening price — seller is motivated, your offer sets the floor, not the list.
Risks & watch-outs
- Watch-outs: property tax is 3.0% of price; built in 1952 — expect roof / HVAC / electrical / plumbing capex.
- Climate carrying-cost: major wind risk, 27% chance of damaging wind over 30y; extreme-heat days projected 7→20/yr by 2055 (HVAC capex compounding) — expect insurance premiums to compound above CPI over the hold.
Questions for the listing agent
- What do current leases actually rent for vs. the listed asking? Can we see a recent rent roll and the last 12 months of T-12 income?
- It's been on market 135 days. Have you received any prior offers? Is the seller open to a 14% concession, seller financing, or rate buy-down credit?
- Built in 1952 — when were the roof, HVAC, electrical panel, plumbing, and water heater last replaced?
- Property tax is high relative to price — has the assessment been appealed recently, and will the sale trigger a re-assessment?
- Why hasn't it sold? Are there any deal-killer items the seller is aware of (foundation, flood, title, zoning, code violations)?
- Is there a deadline driving the sale (1031 exchange, divorce, estate, relocation)? That informs how much negotiation room exists.
- Schools are D-rated, which usually means shorter tenancies and higher turnover. Who's the typical renter profile here, and what's been the actual vacancy rate?
- The area grade is low — what's the realistic commute time and amenity access for the typical tenant pool here? Any planned neighborhood developments (good or bad) we should know about?
- What's the average days-on-market for RENTAL listings here right now (not sales)? A rising rental-DOM trend means longer vacancies and softer asking-rent achievability than the comps imply.
- What's the recent tenant-quality profile in this submarket — average credit score on applications, eviction rate, late-payment / NSF rate, and stable-employment percentage? A property-management company in the area should have these aggregated.
- How much new for-sale + rental construction is in the pipeline within 1–3 miles? Heavy new supply typically softens prices + rents 12–24 months out; constrained supply supports both.
Investment metrics
- 1% rule
- 0.93% ✗
- Cap rate
- 5.31%
- Cash-on-cash
- -3.51%
- DSCR
- 0.84
- GRM
- 9.0
CMA / ARV
- ARV (median comp)
- $242,013
- List price
- $199,999
- Delta
- -17.36%
- Verdict
- UNDERPRICED
- Comps
- 20 within 1.0 mi
Show comp detail 12 sales within ~0.75 mi
| Address | Dist | Beds/Ba | Sqft | Sold | Price | $/sf | Match |
|---|---|---|---|---|---|---|---|
| 1528 Nash St | 0.16mi | 3/2.0 | 1,300 (+2%) | 2mo | $250,000 | $192 | 84 |
| 1541 Nash St | 0.20mi | 3/1.0 | 1,342 (+5%) | 9mo | $255,000 | $190 | 75 |
| 1509 Meadowcrest Dr | 0.12mi | 3/2.0 | 1,440 (+12%) | 7mo | $279,900 | $194 | 63 |
| 1201 Crockett St | 0.46mi | 4/2.0 (+1) | 1,249 (-2%) | 3mo | $289,900 | $232 | 63 |
| 834 Woodland Dr | 0.54mi | 3/2.0 | 1,290 (+1%) | 11mo | $294,900 | $229 | 61 |
| 1605 San Antonio Ln | 0.48mi | 3/2.0 | 1,351 (+6%) | 6mo | $281,500 | $208 | 60 |
| 808 Magnolia Dr | 0.64mi | 3/1.0 | 1,170 (-9%) | 1mo | $179,000 | $153 | 55 |
| 853 Nash St | 0.49mi | 3/1.0 | 1,108 (-13%) | 3mo | $225,000 | $203 | 52 |
| 801 Holly Dr | 0.64mi | 3/2.0 | 1,182 (-8%) | 2mo | $230,000 | $195 | 52 |
| 910 Sara Dunn Dr | 0.42mi | 3/1.5 | 1,440 (+12%) | 8mo | $278,850 | $194 | 51 |
| 1209 Sylvan Dr | 0.49mi | 3/1.0 | 1,104 (-14%) | 8mo | $229,000 | $207 | 48 |
| 1309 Sylvan Dr | 0.52mi | 4/2.0 (+1) | 1,455 (+14%) | 5mo | $298,997 | $205 | 39 |
Match score weights: distance 35% · size 25% · config 20% · recency 20%. Top-matched comps best support the ARV.
Projected returns pro-forma
-3.0% appreciation · 0.0% rent growth · sell at horizon
- IRR
- -26.2%
- Equity multiple
- 0.14×
- Total profit
- $-48,112
- Equity at exit
- $29,821
- IRR
- -41.7%
- Equity multiple
- -0.35×
- Total profit
- $-75,648
- Equity at exit
- $17,292
Cash invested: $56,000 (down + closing). Projections, not guarantees.
Landlord ↔ Tenant lean methodology
- Overall (STATE)
- 87 Strongly Landlord-Friendly
- State Texas
- 87 Strongly Landlord-Friendly · R+5
- County
- — inherits STATE
- City
- — inherits STATE
ZIP-level market 75042
- Rents YoY
- -4.5%
- Active inventory
- 108
- Price-to-rent
- 9.0×
Monthly cashflow live
- Estimated rent
- $1,859 high interval (Pro) →
- Mortgage (P&I)
- −$1,049
- Tax from tax record
- −$500 /mo · $6,000/yr
- Insurance
- −$83
- HOA
- −$0
- Vacancy / Maint / Mgmt
- −$390
- Net cashflow
- $-164
Break-even live
UW: 25.0% down · 7.5% · 30yr · 1.5% tax · 5.0% vac · 8.0% maint · 8.0% mgmt
Financing live
Cash to close
- Down payment
- $50,000
- Closing costs
- $6,000
- Reserves months
- —
- Total cash needed
- —
Loan-product check · same deal, 3 products live
Conventional
25% down · 7.5% · 30yr
- Down + closing
- —
- Monthly P&I
- —
- Monthly cashflow
- —
- DSCR
- —
- Eligible?
- —
Personal DTI + credit; lowest rate.
DSCR
20% down · 8.5% · 30yr
- Down + closing
- —
- Monthly P&I
- —
- Monthly cashflow
- —
- DSCR
- —
- Eligible?
- —
No personal income docs; deal must DSCR.
Hard money
10% down · 12.0% · 12mo
- Down + closing
- —
- Monthly P&I
- —
- Monthly cashflow
- —
- DSCR
- —
- Eligible?
- —
Short-term bridge; refi at stabilization.
Rent comps 33 comps
| Address | Beds | Baths | Sqft | Rent | $/sqft | DOM | Units | Dist |
|---|---|---|---|---|---|---|---|---|
| 1531 Maple Dr Garland, TX | 4.0 | 2.0 | 1416 | $2,200 | $1.55 | 10d | 1 | 0.24mi |
| 1605 Maple Dr Garland, TX | 4.0 | 1.0 | 1393 | $1,550 | $1.11 | 24d | 1 | 0.30mi |
| 2007 Santa Anna Dr Garland, TX | 3.0 | 2.0 | 1390 | $1,850 | $1.33 | 24d | 1 | 0.47mi |
| 324 Rita Dr Garland, TX | 2.0 | 1.5 | 1037 | $1,400 | $1.35 | 43d | 1 | 0.48mi |
| 2039 W Walnut St Garland, TX | 2.0 | 2.0 | 1200 | $1,400 | $1.17 | 7d | 1 | 0.48mi |
| 2039 W Walnut St Unit C Garland, TX | 2.0 | 1.5 | 1200 | $1,400 | $1.17 | 13d | 1 | 0.48mi |
| 1812 Frances Dr Unit 1810 Garland, TX | 2.0 | 1.5 | 1224 | $1,575 | $1.29 | 7d | 1 | 0.54mi |
| 1812 Frances Dr Garland, TX | 2.0 | 1.5 | 1224 | $1,650 | $1.35 | 43d | 1 | 0.54mi |
| 1812 Frances Dr Unit 1812 Garland, TX | 2.0 | 1.5 | 1224 | $1,700 | $1.39 | 43d | 1 | 0.54mi |
| 107 McKinley St Garland, TX | 4.0 | 2.5 | 1860 | $2,600 | $1.40 | 43d | 1 | 0.57mi |
| 108 McKinley St Unit A Garland, TX | 4.0 | 2.0 | 1641 | $1,500 | $0.91 | 7d | 1 | 0.57mi |
| 108 McKinley St Garland, TX | 4.0 | 2.0 | 1641 | $1,775 | $1.08 | 43d | 1 | 0.57mi |
| 821 Travis St Garland, TX | 3.0 | 1.0 | 1158 | $1,875 | $1.62 | 43d | 1 | 0.64mi |
| 217 S Garland Ave Garland, TX | 1.0–2.0 | 1.0–2.0 | 1084 | $2,440 | $2.25 | 7d | 15 | 0.65mi |
| 1717 Warwick St Garland, TX | 3.0 | 20.0 | 1793 | $2,200 | $1.23 | 7d | 1 | 0.86mi |
| 2502 Lakewood Dr Garland, TX | 3.0 | 1.0 | 1405 | $1,800 | $1.28 | 7d | 1 | 0.88mi |
| 1227 W Avenue E Garland, TX | 3.0 | 1.0 | 1284 | $1,950 | $1.52 | 43d | 1 | 0.94mi |
| 625 Camilla Ln Garland, TX | 3.0 | 2.0 | 1273 | $2,300 | $1.81 | 4d | 1 | 0.95mi |
| 2514 Vera Way Garland, TX | 4.0 | 2.0 | 1817 | $2,900 | $1.60 | 43d | 1 | 0.96mi |
| 2529 Barnwood Ln Garland, TX | 3.0 | 2.5 | 1658 | $2,800 | $1.69 | 7d | 1 | 1.04mi |
| 1733 Leicester St Garland, TX | 3.0 | 2.0 | 1516 | $2,175 | $1.43 | 43d | 1 | 1.04mi |
| 2046 N Shiloh Rd Garland, TX | 1.0–2.0 | 1.0 | 684 | $1,495 | $2.19 | 1d | 8 | 1.05mi |
| 710 Worcester Ln Garland, TX | 3.0 | 2.0 | 1640 | $2,300 | $1.40 | 43d | 1 | 1.12mi |
| 2005 Glencrest Ln Garland, TX | 3.0 | 2.0 | 1473 | $2,400 | $1.63 | 43d | 1 | 1.13mi |
| 2013 Victoria Dr Garland, TX | 3.0 | 2.0 | 1159 | $1,900 | $1.64 | 3d | 1 | 1.23mi |
| 2013 Victoria Dr Garland, TX | 3.0 | 2.0 | 1159 | $1,900 | $1.64 | 14d | 1 | 1.23mi |
| 1425 Cedarcrest Dr Garland, TX | 2.0 | 1.0 | 1064 | $1,650 | $1.55 | 24d | 1 | 1.28mi |
| 2114 Richwood Dr Garland, TX | 3.0 | 2.0 | 1328 | $2,000 | $1.51 | 43d | 1 | 1.34mi |
| 705 Kingsbridge Dr Garland, TX | 3.0 | 2.0 | 1850 | $2,095 | $1.13 | 14d | 1 | 1.38mi |
| 2735 N Garland Ave Garland, TX | 2.0 | 2.0–2.5 | 1363 | $1,791 | $1.31 | 2d | 6 | 1.42mi |
| 3100 W Walnut St Garland, TX | 3.0 | 1.0–3.0 | 695 | $1,765 | $2.54 | 1d | 24 | 1.43mi |
| 3037 Burning Tree Ln Garland, TX | 3.0 | 2.0 | 1388 | $2,195 | $1.58 | 2d | 1 | 1.44mi |
| 202 Belt Line Rd Garland, TX | 2.0 | 2.0 | 987 | $1,570 | $1.59 | 3d | 10 | 1.48mi |
Listing history 39 events
-
2026-06-18days on market $199,999 Active 135 DOM
-
2026-06-17days on market $199,999 Active 134 DOM
-
2026-06-16days on market $199,999 Active 133 DOM
-
2026-06-15price $199,999 Active 132 DOM
-
2026-06-15days on market $229,999 Active 132 DOM
-
2026-06-13days on market $229,999 Active 130 DOM
-
2026-06-09days on market $229,999 Active 126 DOM
-
2026-06-08days on market $229,999 Active 125 DOM
-
2026-06-07days on market $229,999 Active 124 DOM
-
2026-06-04days on market $229,999 Active 121 DOM
-
2026-06-03days on market $229,999 Active 120 DOM
-
2026-06-02days on market $229,999 Active 119 DOM
-
2026-06-01days on market $229,999 Active 118 DOM
-
2026-05-31days on market $229,999 Active 117 DOM
-
2026-02-03$229,999 Active 455-char remark
Show marketing remark (455 chars)
Brand new AC and heat system! Great investment opportunity near downtown Garland! Tenant occupied now, lease amount is $1695 and expires April 30, 2027. Nice and open living and dining off kitchen. Gas oven range, dishwasher, and microwave included. Full size washer and dryer connections. Three beds and one bath. Converted garage is the third bedroom. Fenced backyard with chain link fence and storage building. Please email agent with any questions.
-
2026-01-31historical
-
2025-08-04$229,999 Active
-
2025-07-31historical
-
2025-06-16historical $1,495
-
2025-05-30status Active
-
2025-05-27historical Active Option Contract
-
2025-05-08$1,495
-
2025-04-02status Active
-
2025-03-14historical Active Option Contract
-
2025-02-10$229,999 Active
-
2024-04-22historical $1,695
-
2024-02-29price $1,695
-
2024-02-14$1,795
-
2022-12-06historical
-
2022-12-01historical
-
2022-07-01price $290,000
-
2022-07-01status Active
-
2022-06-17price $274,900
-
2022-06-14price $264,900
-
2022-06-01$249,900 Active
-
2022-05-27soldstatus
-
2022-05-26soldstatus Closed
-
2022-05-10status Pending
-
2022-05-05$189,000 Active
ⓘ Source: listings_history table (triggers on properties + properties_extension) + one-shot
backfill from property_details.listing_events for pre-trigger history.
Tax reassessment forecast TX · Resets to sale price
- Current annual tax
- $6,000 · $500/mo
- Projected year-2 tax
- $6,000 · $500/mo
- Expected delta
- $0/yr ($0/mo · 0.0%)
ⓘ Screening estimate from a state-policy table — verify with the county assessor before closing.
Climate risk First Street
- Flood 1/10 Low FEMA zone X (unshaded) · 0% chance over 30 yrs
- Wildfire 1/10 Low
- Heat 7/10 Severe 7 d/yr ≥109°F today · 20 d/yr by 30 yrs out
- Wind 6/10 Major 27% chance of damaging wind over 30 yrs
- Air quality 3/10 Moderate 3 unhealthy d/yr today · 3 by 30 yrs out
Nearby sold comps map
Loading sold comps map…
Walkable amenities ~0.75 mi
Loading nearby amenities…
Taxation est. · year 1
- Rental income
- $22,303
- − Mortgage interest
- −$11,203
- − Property taxes
- −$6,000
- − Insurance
- −$1,000
- − Repairs & maintenance
- −$1,784
- − Management
- −$1,784
- − Depreciation
- −$5,818
- Taxable loss
- −$5,287
- Est. tax savings @ 24.0%
- +$1,269
- After-tax cash flow
- $-698/yr
For passive investors: Depreciation is non-cash, so a rental often shows a tax loss while cash-flowing — sheltering income. Rental losses are passive: they offset passive income freely, and up to $25,000/yr can offset ordinary (W-2) income if you actively participate and your MAGI is under $100k (phasing out to $0 by $150k); unused losses carry forward. On sale, claimed depreciation is recaptured at up to 25%, and gains may owe capital-gains tax (a 1031 exchange can defer both). Figures are a year-1 estimate at your 24.0% rate — not tax advice; consult a CPA.
Schools (NCES district)
- District
- Garland ISD
- NCES district ID
- 4820340
- Math proficiency
- 27% ▼ -23.00%
- Reading proficiency
- 37% ▼ -10.00%
- Median HH income
- $58,392
- Composite
- 28.63/100
- National rank
- #6706
- State rank
- #553 of 826 in TX
Livability — Garland
- Score
- 74/100
- State rank
- #165
- US rank
- #4447
Category grades
Schools grade is shown separately in the Schools card above.
Census & demographics
- Census place
- Garland, TX
- County
- Dallas County · 2,612,404 people
- City population
- 246,342
- Metro
- Dallas-Fort Worth-Arlington, TX
- Population (ZIP)
- 38,112
- Household income
- $64,266
- Rent vs Own
- Severe rent burden
- 1682.0
Population outlook (Dallas County) Hauer SSP2
- Today (2025)
- 2,979,839 people
- By 2030
- 3,191,823 · +7.1%
- By 2040
- 3,619,611 · +21.5%
- By 2050
- 4,026,915 · +35.1%
- By 2075
- 4,957,073 · +66.4%
- By 2100
- 5,508,725 · +84.9%
Race, ethnicity, and origin ACS 2023
- Neighborhood character
- Diverse neighborhood (Simpson 0.63)
- Race & ethnicity
- Hispanic / Latino 55% Two or more races 30% Asian 16% White 15% Black 11%
- Hispanic origin (detail)
- Mexican 44%
- Common ancestry
- Swedish 2% Slovak 1% Serbian 1%
- Foreign-born
- 42% · Canada, Vietnam, Philippines
- Languages at home
- 31% English-only · Spanish 49% Vietnamese 9% Other Asian/Pacific 2%
Political lean MEDSL · Dallas
- 2024 margin
- Strong D (+22.2) · D 60.2% · R 38.0% · Other 1.8%
- 2008→2024 swing
- +6.9pp toward D · 2008: 15.3pp · 2024: 22.2pp
- All cycles
- 2024: D+22.2 2020: D+31.6 2016: D+26.2 2012: D+15.4 2008: D+15.3
Not yet ingested
- Civics
- —
Market trends
- HPI YoY
- ▼ -221.11%
- Current HPI
- 346.7886
- Rent YoY
- ▼ -4.52%
- Metro
- Dallas-Fort Worth-Arlington, TX
- State GDP YoY
- ▲ 3.95%
- F500 in state
- 110
Industry mix (Fortune 500 HQ in TX)
| Industry | F500 HQs | Revenue |
|---|---|---|
| Energy | 16 | $1,198B |
|
||
| Technology | 5 | $198B |
|
||
| Engineering / Construction | 4 | $72B |
|
||
| Energy Services | 3 | $60B |
|
||
| Utilities | 3 | $41B |
|
||
| Healthcare | 2 | $330B |
|
||
Price history
+21.7% since first listed25 events — show timeline
- 2026-02-03 Listed $229,999 NTREIS
- 2026-01-31 Listing Removed — NTREIS
- 2025-08-04 Listed $229,999 NTREIS
- 2025-07-31 Listing Removed — NTREIS
- 2025-06-16 Rental Removed $1,495 SHOWMOJO
- 2025-05-30 Relisted — NTREIS
- 2025-05-27 Contingent — NTREIS
- 2025-05-08 Listed for Rent $1,495 SHOWMOJO
- 2025-04-02 Relisted — NTREIS
- 2025-03-14 Contingent — NTREIS
- 2025-02-10 Listed $229,999 NTREIS
- 2024-04-22 Rental Removed $1,695 NTREIS
- 2024-02-29 Price Changed $1,695 NTREIS
- 2024-02-14 Listed for Rent $1,795 NTREIS
- 2022-12-06 Rental Removed — RENT.
- 2022-12-01 Listing Removed — NTREIS
- 2022-07-01 Price Changed $290,000 NTREIS
- 2022-07-01 Relisted — NTREIS
- 2022-06-17 Price Changed $274,900 NTREIS
- 2022-06-14 Price Changed $264,900 NTREIS
- 2022-06-01 Listed $249,900 NTREIS
- 2022-05-27 Sold (Public Records) — Public Records
- 2022-05-26 Sold (MLS) — NTREIS
- 2022-05-10 Pending — NTREIS
- 2022-05-05 Listed $189,000 NTREIS
Property tax history
+6.9%/yrLatest (2025): $6,000 · +5.3% YoY. Source: county tax records.
Cash-flow waterfall
monthlySold comps — $/sqft
last 12 mo · ≤1 miLoading sold comps…