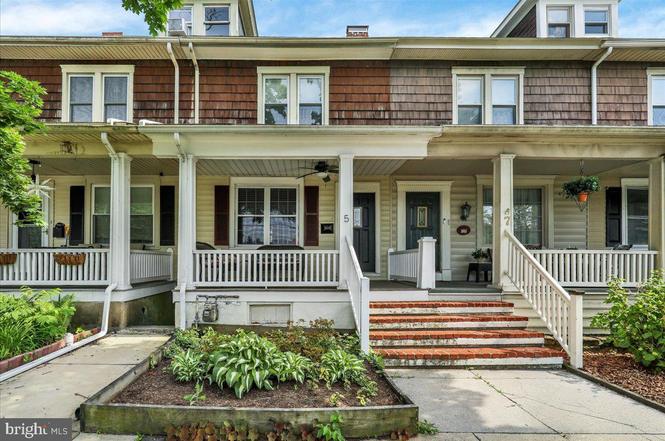
5 W 2nd Ave · Lititz, PA
Flood risk 1/10 · Minimal
- FEMA flood zone
- X (unshaded)
- Chance of flooding over 30 yrs
- 0.0%
- Est. flood insurance / yr
- $473 – $860
Fire risk 1/10 · Minimal
- Est. fire insurance / yr
- $511 – $949
Heat risk 5/10 · Moderate
- Hot days now (above 101°F)
- 7 days/yr
- Hot days in 30 yrs
- 15 days/yr
Wind risk 4/10 · Minor
- Chance of severe wind over 30 yrs
- 15.0%
Air-quality risk 4/10 · Minor
- Unhealthy air days now
- 4 days/yr
- Unhealthy air days in 30 yrs
- 6 days/yr
Risk factors via First Street. Map © Google.
Why this score? — see what drove the D+ grade
The composite is a weighted blend of 9 inputs, each scored 0–100. Each bar is that input's sub-score; the figure is the points it added to the 100-point composite (weight × sub-score).
- ARV discount +14.2/15.0
- Cash flow +13.4/30.0
- Schools +4.4/10.0
- Livability +4.3/5.0
- DSCR +4.0/10.0
- 1% rule +3.3/10.0
- Rent growth +2.5/5.0
- Condition / age +2.5/5.0
- Appreciation +0.0/10.0
$299,900
🖨 Deal sheet 📄 Offer letter ✓ Due diligence
Listing remarks MLS
Fantastic home in walking distance to downtown Lititz. Minutes to fine dining and Lititz shopping. Open floor plan with charming details throughout the property. Freshly redone from top to bottom, new carpet, replacement windows, flooring and more. First floor laundry and mudroom area and storage in the attic as well as basement. Priced to sell and easy to show!
Key facts
- Oversized kitchen
- Off-street parking
- Hardwood floors
Tags
Property features AI
Exterior
- Parking: Detached rear-entry garage (1 garage space); One off-street parking space; Two total garage/parking spaces
- Utilities: Public water; Public sewer; Electric cooling, natural gas heating and hot water
- Home design: Interior townhouse/rowhouse; Ownership: Fee simple; Above-grade finished area reported by assessor
- Construction: Frame construction with vinyl siding; Stone foundation
- Exterior features: Fully board fenced yard; Not in a federal flood zone
Interior
- Bedrooms: Three bedrooms on the upper level
- Bathrooms: One full bathroom on the upper level; One half bathroom on the main level
- Heating & cooling: Forced air heating (natural gas); Central air conditioning (electric); Natural gas hot water
- Interior features: Unfinished basement; Living area reported by assessor
Neighborhood map
What this means for you Summary
Snapshot
- This is a 3-bed/1.5-bath townhouse listed at $300k.
Deal economics
- At list price, monthly cash flow is $4 ($48/yr) — positive.
- The deal already cash-flows at list — no discount required.
- To meet the 1% rule (rent ≥ 1% of price), the offer needs to be $248k (17.3% below list).
- Recommended offer: $248k (17.3% below list) — sets the bar for 1% rule.
- Cap rate 6.3% vs local median 3.9% in Lititz — top-decile yield for the area; either an underpriced asset or a hidden risk that comps aren't pricing in. Stress-test before assuming the spread holds.
Location & tenants
- Location reads 86/100 on livability (#57 in PA, #396 nationally) — a professional / high-income tenant draw. Strengths: crime A+, cost of living A+, housing A+; Watch: commute F.
- Warwick SD (suburban): math 42% / reading 58% proficiency, ranked #158 of 539 in PA (top 29%) — acceptable for families but not a draw, mixed tenant base, ~2y average lease; only 20% free/reduced lunch — higher-income household profile.
- Market conditions: 214 active listings in the ZIP; 4 comparable units currently listed for rent nearby; rentals leasing fast (median 14d on market — plan ~1-2 weeks tenant-placement turnaround); solid renter incomes; 1,093 units permitted in Lancaster County in 2024 (201 in 5+ unit buildings).
- This rent runs 31% of the median local income ($97k/yr) — at the standard rent-burdened threshold; future hikes will face affordability resistance.
Forward outlook
- Local home prices are declining (-3.0%/yr); year-one equity from $2k of loan paydown is wiped out by about $9k of value loss. Plan a longer hold.
- Lancaster County population projected at +5% by 2050 — modest demand growth; plan on rents tracking national, not racing it.
Negotiation context
- Only 4 days on market — expect competitive offers; lowballing is unlikely to land.
- 2 sale attempts since 7y ago with the ask held roughly flat each time — persistent listings suggest the price (not the market) is what's stuck; bring a comps-based counter.
- Current owner paid $171k; list at $300k implies a 75% gain — meaningful room to come down on a strong offer.
Risks & watch-outs
- Watch-outs: built in 1935 — expect roof / HVAC / electrical / plumbing capex.
- Climate carrying-cost: extreme-heat days projected 7→15/yr by 2055 (HVAC capex compounding) — expect insurance premiums to compound above CPI over the hold.
Questions for the listing agent
- Built in 1935 — when were the roof, HVAC, electrical panel, plumbing, and water heater last replaced?
- Is there a deadline driving the sale (1031 exchange, divorce, estate, relocation)? That informs how much negotiation room exists.
- Schools are A-rated — typically a magnet for longer-tenancy family renters. What's the average tenant stay here, and is there a school-zone premium baked into asking?
- The area grade is low — what's the realistic commute time and amenity access for the typical tenant pool here? Any planned neighborhood developments (good or bad) we should know about?
- What's the average days-on-market for RENTAL listings here right now (not sales)? A rising rental-DOM trend means longer vacancies and softer asking-rent achievability than the comps imply.
- What's the recent tenant-quality profile in this submarket — average credit score on applications, eviction rate, late-payment / NSF rate, and stable-employment percentage? A property-management company in the area should have these aggregated.
- How much new for-sale + rental construction is in the pipeline within 1–3 miles? Heavy new supply typically softens prices + rents 12–24 months out; constrained supply supports both.
Investment metrics
- 1% rule
- 0.83% ✗
- Cap rate
- 6.31%
- Cash-on-cash
- 0.06%
- DSCR
- 1.00
- GRM
- 10.1
CMA / ARV
- ARV (on-the-fly)
- $352,304
- Comps found
- 12
Show comp detail 12 sales within ~0.75 mi
| Address | Dist | Beds/Ba | Sqft | Sold | Price | $/sf | Match |
|---|---|---|---|---|---|---|---|
| 504 Hensley | 0.31mi | 3/1.5 | 1,516 (-2%) | 2mo | $335,500 | $221 | 80 |
| 19 E 2nd Ave | 0.09mi | 4/1.5 (+1) | 1,692 (+9%) | 5mo | $315,000 | $186 | 72 |
| 534 W Marion St | 0.46mi | 3/2.0 | 1,518 (-2%) | 4mo | $333,000 | $219 | 70 |
| 25 Tupelo St | 0.71mi | 3/2.5 | 1,544 (-0%) | 1mo | $350,000 | $227 | 61 |
| 7 Winding Way | 0.59mi | 3/1.5 | 1,440 (-7%) | 2mo | $290,000 | $201 | 59 |
| 69 N Water St | 0.68mi | 4/1.0 (+1) | 1,568 (+1%) | 4mo | $230,000 | $147 | 56 |
| 133 S Spruce St | 0.31mi | 4/1.5 (+1) | 1,328 (-14%) | 2mo | $276,500 | $208 | 55 |
| 321 Pin Oak Dr | 0.70mi | 2/2.0 (-1) | 1,636 (+5%) | 2mo | $480,000 | $293 | 50 |
| 24 Heron Rd | 0.74mi | 3/2.5 | 1,416 (-9%) | 3mo | $341,000 | $241 | 45 |
| 762 Keller Dr | 0.57mi | 3/2.5 | 1,350 (-13%) | 5mo | $308,000 | $228 | 43 |
| 407 Crosswinds Dr | 0.73mi | 3/1.5 | 1,352 (-13%) | 5mo | $317,500 | $235 | 40 |
| 48 N Broad St #205 | 0.60mi | 2/2.0 (-1) | 1,327 (-14%) | 2mo | $760,000 | $573 | 39 |
Match score weights: distance 35% · size 25% · config 20% · recency 20%. Top-matched comps best support the ARV.
Projected returns pro-forma
-3.0% appreciation · 3.0% rent growth · sell at horizon
- IRR
- -16.2%
- Equity multiple
- 0.42×
- Total profit
- $-48,376
- Equity at exit
- $44,716
- IRR
- -7.9%
- Equity multiple
- 0.50×
- Total profit
- $-41,935
- Equity at exit
- $25,930
Cash invested: $83,972 (down + closing). Projections, not guarantees.
Landlord ↔ Tenant lean methodology
- Overall (STATE)
- 62 Landlord-Friendly
- State Pennsylvania
- 62 Landlord-Friendly · EVEN
- County
- — inherits STATE
- City
- — inherits STATE
ZIP-level market 17543
- Active inventory
- 214
- Price-to-rent
- 10.1×
Monthly cashflow live
- Estimated rent
- $2,481 medium interval (Pro) →
- Mortgage (P&I)
- −$1,573
- Tax from tax record
- −$259 /mo · $3,103/yr
- Insurance
- −$125
- HOA
- −$0
- Vacancy / Maint / Mgmt
- −$521
- Net cashflow
- $4
Break-even live
UW: 25.0% down · 7.5% · 30yr · 1.5% tax · 5.0% vac · 8.0% maint · 8.0% mgmt
Financing live
Cash to close
- Down payment
- $74,975
- Closing costs
- $8,997
- Reserves months
- —
- Total cash needed
- —
Loan-product check · same deal, 3 products live
Conventional
25% down · 7.5% · 30yr
- Down + closing
- —
- Monthly P&I
- —
- Monthly cashflow
- —
- DSCR
- —
- Eligible?
- —
Personal DTI + credit; lowest rate.
DSCR
20% down · 8.5% · 30yr
- Down + closing
- —
- Monthly P&I
- —
- Monthly cashflow
- —
- DSCR
- —
- Eligible?
- —
No personal income docs; deal must DSCR.
Hard money
10% down · 12.0% · 12mo
- Down + closing
- —
- Monthly P&I
- —
- Monthly cashflow
- —
- DSCR
- —
- Eligible?
- —
Short-term bridge; refi at stabilization.
Rent comps 4 comps
| Address | Beds | Baths | Sqft | Rent | $/sqft | DOM | Units | Dist |
|---|---|---|---|---|---|---|---|---|
| 446 Crosswinds Dr Lititz, PA | 3.0 | 2.0 | 1284 | $2,250 | $1.75 | 43d | 1 | 0.64mi |
| 446 Crosswinds Dr Lititz, PA | 3.0 | 2.0 | 1300 | $2,250 | $1.73 | 13d | 1 | 0.64mi |
| 100 W Kleine Ln Lititz, PA | 2.0 | 1.0–2.0 | 874 | $2,095 | $2.40 | 13d | 12 | 0.65mi |
| 100 Wickshire Cir Lititz, PA | 1.0–2.0 | 1.0–2.0 | 1038 | $3,688 | $3.55 | 13d | 4 | 0.95mi |
Listing history 4 events
-
2026-06-15status $299,900 Pending 4 DOM
-
2026-06-15days on market $299,900 Active 4 DOM
-
2026-06-14remarks 631-char remark
-
2026-06-14$299,900 Active 2 DOM
ⓘ Source: listings_history table (triggers on properties + properties_extension) + one-shot
backfill from property_details.listing_events for pre-trigger history.
Tax reassessment forecast PA · Partial reset (capped growth)
- Current annual tax
- $3,103 · $259/mo
- Projected year-2 tax
- $3,921 · $327/mo
- Expected delta
- +$818/yr (+$68/mo · 26.3%)
ⓘ Screening estimate from a state-policy table — verify with the county assessor before closing.
Climate risk First Street
- Flood 1/10 Low FEMA zone X (unshaded) · 0% chance over 30 yrs
- Wildfire 1/10 Low
- Heat 5/10 Major 7 d/yr ≥101°F today · 15 d/yr by 30 yrs out
- Wind 4/10 Moderate 15% chance of damaging wind over 30 yrs
- Air quality 4/10 Moderate 4 unhealthy d/yr today · 6 by 30 yrs out
Nearby sold comps map
Loading sold comps map…
Walkable amenities ~0.75 mi
Loading nearby amenities…
Taxation est. · year 1
- Rental income
- $29,776
- − Mortgage interest
- −$16,799
- − Property taxes
- −$3,103
- − Insurance
- −$1,500
- − Repairs & maintenance
- −$2,382
- − Management
- −$2,382
- − Depreciation
- −$8,724
- Taxable loss
- −$5,114
- Est. tax savings @ 24.0%
- +$1,227
- After-tax cash flow
- $1,275/yr
For passive investors: Depreciation is non-cash, so a rental often shows a tax loss while cash-flowing — sheltering income. Rental losses are passive: they offset passive income freely, and up to $25,000/yr can offset ordinary (W-2) income if you actively participate and your MAGI is under $100k (phasing out to $0 by $150k); unused losses carry forward. On sale, claimed depreciation is recaptured at up to 25%, and gains may owe capital-gains tax (a 1031 exchange can defer both). Figures are a year-1 estimate at your 24.0% rate — not tax advice; consult a CPA.
Schools (NCES district)
- District
- Warwick SD
- NCES district ID
- 4224960
- Math proficiency
- 42% ▼ -6.00%
- Reading proficiency
- 58% ▼ -11.00%
- Median HH income
- $63,696
- Composite
- 44.03/100
- National rank
- #2884
- State rank
- #158 of 539 in PA
Livability — Lititz
- Score
- 86/100
- State rank
- #57
- US rank
- #396
Category grades
Schools grade is shown separately in the Schools card above.
Census & demographics
- Census place
- Lititz, PA
- County
- Lancaster County · 390,309 people
- City population
- 45,912
- Metro
- Lancaster, PA
- Population (ZIP)
- 45,912
- Household income
- $97,435
- Rent vs Own
- Severe rent burden
- 1164.0
Population outlook (Lancaster County) Hauer SSP2
- Today (2025)
- 561,011 people
- By 2030
- 570,969 · +1.8%
- By 2040
- 585,929 · +4.4%
- By 2050
- 591,056 · +5.4%
- By 2075
- 594,747 · +6.0%
- By 2100
- 558,850 · -0.4%
Race, ethnicity, and origin ACS 2023
- Neighborhood character
- Predominantly White (86%)
- Race & ethnicity
- White 86% Hispanic / Latino 6% Two or more races 5% Asian 3% Black 2%
- Hispanic origin (detail)
- Mexican 1% Puerto Rican 3%
- Common ancestry
- Romanian 3% Lithuanian 2% Italian 2%
- Foreign-born
- 4% · Canada, India, Vietnam
- Languages at home
- 92% English-only · Spanish 3% German/W. Germanic 2% Other Indo-European 1%
Political lean MEDSL · Lancaster
- 2024 margin
- R (+15.9) · D 41.5% · R 57.5%
- 2008→2024 swing
- -4.1pp toward R · 2008: -11.8pp · 2024: -15.9pp
- All cycles
- 2024: R+15.9 2020: R+15.8 2016: R+19.7 2012: R+19.2 2008: R+11.8
Not yet ingested
- Civics
- —
Market trends
- HPI YoY
- ▼ -283.22%
- Current HPI
- 265.3653
- Rent YoY
- —
- Metro
- Lancaster, PA
- State GDP YoY
- ▲ 1.68%
- F500 in state
- 34
Industry mix (Fortune 500 HQ in PA)
| Industry | F500 HQs | Revenue |
|---|---|---|
| Healthcare | 2 | $309B |
|
||
| Insurance | 2 | $27B |
|
||
| Telecommunications / Media | 1 | $124B |
|
||
| Industrial Distribution | 1 | $22B |
|
||
| Financial Services | 1 | $20B |
|
||
| Chemicals / Materials | 1 | $18B |
|
||
Price history
+263.5% since first listed8 events — show timeline
- 2026-06-12 Listed $299,900 BRIGHT MLS
- 2026-06-10 Coming Soon $299,900 BRIGHT MLS
- 2019-05-24 Sold (Public Records) $171,000 Public Records
- 2019-05-24 Sold (MLS) $171,000 BRIGHT MLS
- 2019-04-18 Pending — BRIGHT MLS
- 2019-04-18 Price Changed $173,200 BRIGHT MLS
- 2019-04-15 Listed $169,995 BRIGHT MLS
- 1995-05-18 Sold (Public Records) $82,500 Public Records
Property tax history
+2.0%/yrLatest (2026): $3,103 · +1.8% YoY. Source: county tax records.
Cash-flow waterfall
monthlySold comps — $/sqft
last 12 mo · ≤1 miLoading sold comps…