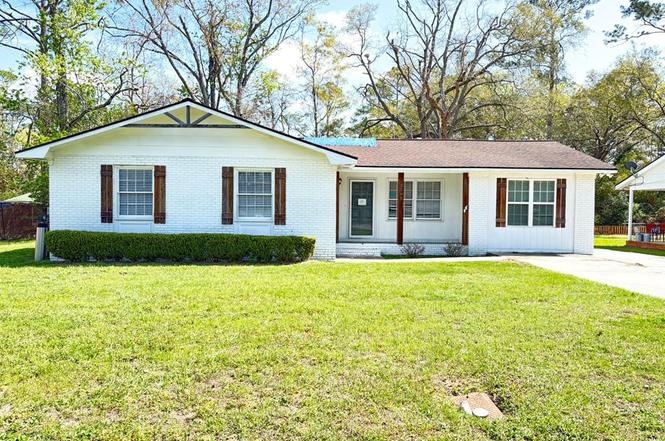
2505 Deborah Dr · Valdosta, GA
Flood risk 1/10 · Minimal
- FEMA flood zone
- X (unshaded)
- Chance of flooding over 30 yrs
- 0.0%
- Est. flood insurance / yr
- $507 – $1,088
Fire risk 3/10 · Minor
- Est. fire insurance / yr
- $963 – $1,789
Heat risk 8/10 · Major
- Hot days now (above 108°F)
- 7 days/yr
- Hot days in 30 yrs
- 19 days/yr
Wind risk 9/10 · Severe
- Chance of severe wind over 30 yrs
- 99.0%
Air-quality risk 6/10 · Moderate
- Unhealthy air days now
- 10 days/yr
- Unhealthy air days in 30 yrs
- 11 days/yr
Risk factors via First Street. Map © Google.
Why this score? — see what drove the C+ grade
The composite is a weighted blend of 9 inputs, each scored 0–100. Each bar is that input's sub-score; the figure is the points it added to the 100-point composite (weight × sub-score).
- Cash flow +25.3/30.0
- ARV discount +15.0/15.0
- DSCR +8.3/10.0
- 1% rule +5.5/10.0
- Rent growth +3.5/5.0
- Livability +3.0/5.0
- Condition / age +2.5/5.0
- Schools +1.5/10.0
- Appreciation +0.0/10.0
$153,000
🖨 Deal sheet 📄 Offer letter ✓ Due diligence
Listing remarks MLS
Opportunity awaits with this 4-bedroom, 3-bath home in a good location. The property features an open-concept living room, dining, and kitchen area, along with a spacious primary bedroom with an en-suite bath. The home has storm damage to the roof and will require repairs, offering a great chance for investors or buyers looking to renovate and build equity. With the right updates, this property could truly shine.
Key facts
- 0.25 acre lot
- Built 1972
- Listed 46 days
Neighborhood map
What this means for you Summary
Snapshot
- This is a 4-bed/2.0-bath single-family listed at $153k.
Deal economics
- At list price, monthly cash flow is $347 ($4k/yr) — positive.
- The deal already cash-flows at list — no discount required.
- Meets the 1% rule at list price ($2k rent vs $153k).
- Recommended offer: $148k (3.0% below list) — sets the bar for market timing.
- Cap rate 9.0% vs local median 4.3% in Valdosta — top-decile yield for the area; either an underpriced asset or a hidden risk that comps aren't pricing in. Stress-test before assuming the spread holds.
Location & tenants
- Location reads 60/100 on livability (#392 in GA) — a middle-class / working-renter tenant base. Strengths: cost of living A+, health & safety A+, housing A-; Watch: schools F, crime F, amenities F.
- Valdosta City (urban): math 15% / reading 22% proficiency, ranked #149 of 174 in GA (top 86%) — low school quality limits family demand, transient renter base, plan for 1-2y turnover; 74% free/reduced lunch — lower-income household profile, screen leases tightly.
- Market conditions: Rents rising fast (+4.2%/yr); 267 active listings in the ZIP; 15 comparable units currently listed for rent nearby; rentals lingering (median 44d on market — plan ~5-8 weeks vacancy on turnover, expect pricing pressure); 67% of comp listings sitting > 30 days — soft ceiling on asking rent; 896 units permitted in Lowndes County in 2024 (0 in 5+ unit buildings).
- This rent runs 34% of the median local income ($57k/yr) — at the standard rent-burdened threshold; future hikes will face affordability resistance.
Forward outlook
- Local home prices are declining (-3.0%/yr); year-one equity from $1k of loan paydown is wiped out by about $5k of value loss. Plan a longer hold.
- Lowndes County population projected at +10% by 2050 — modest demand growth; plan on rents tracking national, not racing it.
- At projected returns (-3.0% appreciation + 4.2% rent growth), your $43k cash investment doubles in ~10 years — after that, you're playing with house money.
Negotiation context
- It's been on market 46 days — a 3% lower offer ($148k) is reasonable based on typical stale-listing flexibility.
- 3 sale attempts since 4y ago; this cycle's ask has dropped $10k (6%) from the opening price — seller is motivated, your offer sets the floor, not the list.
Risks & watch-outs
- Climate carrying-cost: severe wind risk, 99% chance of damaging wind over 30y; extreme-heat days projected 7→19/yr by 2055 (HVAC capex compounding) — expect insurance premiums to compound above CPI over the hold.
Questions for the listing agent
- It's been on market 46 days. Have you received any prior offers? Is the seller open to a 3% concession, seller financing, or rate buy-down credit?
- Built in 1972 — when were the roof, HVAC, electrical panel, plumbing, and water heater last replaced?
- Is there a deadline driving the sale (1031 exchange, divorce, estate, relocation)? That informs how much negotiation room exists.
- Schools are F-rated, which usually means shorter tenancies and higher turnover. Who's the typical renter profile here, and what's been the actual vacancy rate?
- Crime grade is F in this area — have there been break-ins, vandalism, or insurance claims at this property in the last 3 years? What carrier currently insures it and at what premium?
- What's the average days-on-market for RENTAL listings here right now (not sales)? A rising rental-DOM trend means longer vacancies and softer asking-rent achievability than the comps imply.
- What's the recent tenant-quality profile in this submarket — average credit score on applications, eviction rate, late-payment / NSF rate, and stable-employment percentage? A property-management company in the area should have these aggregated.
- How much new for-sale + rental construction is in the pipeline within 1–3 miles? Heavy new supply typically softens prices + rents 12–24 months out; constrained supply supports both.
Investment metrics
- 1% rule
- 1.05% ✓
- Cap rate
- 9.01%
- Cash-on-cash
- 9.72%
- DSCR
- 1.43
- GRM
- 7.9
CMA / ARV
- ARV (on-the-fly)
- $221,145
- Comps found
- 12
Show comp detail 12 sales within ~0.75 mi
| Address | Dist | Beds/Ba | Sqft | Sold | Price | $/sf | Match |
|---|---|---|---|---|---|---|---|
| 2505 Deborah Dr | 0.00mi | 4/3.0 | 1,923 (0%) | 1mo | $147,000 | $76 | 95 |
| 9 Oconee Pl | 0.37mi | 4/2.0 | 1,756 (-9%) | 1mo | $233,000 | $133 | 67 |
| 2707 Clayton Dr | 0.37mi | 3/2.0 (-1) | 1,706 (-11%) | 1mo | $286,500 | $168 | 58 |
| 2700 Clayton Dr | 0.37mi | 3/2.5 (-1) | 2,053 (+7%) | 8mo | $225,000 | $110 | 58 |
| 5 Tallullah Cir | 0.37mi | 3/2.0 (-1) | 2,158 (+12%) | 0mo | $230,000 | $107 | 57 |
| 2511 Orlando Dr | 0.51mi | 3/2.0 (-1) | 2,060 (+7%) | 5mo | $155,000 | $75 | 55 |
| 1007 Pineview Dr | 0.30mi | 3/2.0 (-1) | 1,635 (-15%) | 1mo | $205,000 | $125 | 55 |
| 1507 Leone Ave | 0.53mi | 5/2.0 (+1) | 2,118 (+10%) | 0mo | $216,500 | $102 | 53 |
| 617 Ledgedale Cir | 0.74mi | 3/2.0 (-1) | 2,031 (+6%) | 1mo | $235,000 | $116 | 50 |
| 1204 Timber Line Dr | 0.63mi | 3/2.0 (-1) | 1,728 (-10%) | 7mo | $198,000 | $115 | 43 |
| 900 Pine Cone Cir | 0.68mi | 3/2.0 (-1) | 1,687 (-12%) | 3mo | $184,900 | $110 | 41 |
| 2032 Bancroft Rd | 0.69mi | 3/2.0 (-1) | 1,694 (-12%) | 6mo | $229,000 | $135 | 38 |
Match score weights: distance 35% · size 25% · config 20% · recency 20%. Top-matched comps best support the ARV.
Projected returns pro-forma
-3.0% appreciation · 4.19% rent growth · sell at horizon
- IRR
- -0.5%
- Equity multiple
- 0.98×
- Total profit
- $-813
- Equity at exit
- $22,813
- IRR
- 10.2%
- Equity multiple
- 1.83×
- Total profit
- $35,683
- Equity at exit
- $13,229
Cash invested: $42,840 (down + closing). Projections, not guarantees.
Landlord ↔ Tenant lean methodology
- Overall (STATE)
- 90 Strongly Landlord-Friendly
- State Georgia
- 90 Strongly Landlord-Friendly · R+3
- County
- — inherits STATE
- City
- — inherits STATE
ZIP-level market 31602
- Rents YoY
- 4.2%
- Active inventory
- 267
- Price-to-rent
- 7.9×
Monthly cashflow live
- Estimated rent
- $1,607 high interval (Pro) →
- Mortgage (P&I)
- −$802
- Tax from tax record
- −$56 /mo · $676/yr
- Insurance
- −$64
- HOA
- −$0
- Vacancy / Maint / Mgmt
- −$337
- Net cashflow
- $347
Break-even live
UW: 25.0% down · 7.5% · 30yr · 1.5% tax · 5.0% vac · 8.0% maint · 8.0% mgmt
Financing live
Cash to close
- Down payment
- $38,250
- Closing costs
- $4,590
- Reserves months
- —
- Total cash needed
- —
Loan-product check · same deal, 3 products live
Conventional
25% down · 7.5% · 30yr
- Down + closing
- —
- Monthly P&I
- —
- Monthly cashflow
- —
- DSCR
- —
- Eligible?
- —
Personal DTI + credit; lowest rate.
DSCR
20% down · 8.5% · 30yr
- Down + closing
- —
- Monthly P&I
- —
- Monthly cashflow
- —
- DSCR
- —
- Eligible?
- —
No personal income docs; deal must DSCR.
Hard money
10% down · 12.0% · 12mo
- Down + closing
- —
- Monthly P&I
- —
- Monthly cashflow
- —
- DSCR
- —
- Eligible?
- —
Short-term bridge; refi at stabilization.
Rent comps 15 comps
| Address | Beds | Baths | Sqft | Rent | $/sqft | DOM | Units | Dist |
|---|---|---|---|---|---|---|---|---|
| 2600 Deborah Dr Valdosta, GA | 3.0 | 1.0 | 1333 | $1,495 | $1.12 | 43d | 1 | 0.14mi |
| 4 Lakeland Ct Valdosta, GA | 4.0 | 2.0 | 1350 | $1,250 | $0.93 | 20d | 1 | 0.61mi |
| 1730 Forsyth Pl Unit B Valdosta, GA | 3.0 | 3.0 | 1280 | $1,395 | $1.09 | 43d | 1 | 0.63mi |
| 1778 Almond Tree Pl Valdosta, GA | 3.0 | 2.5 | 1336 | $1,300 | $0.97 | 43d | 1 | 0.67mi |
| 1109 Timber Line Dr Valdosta, GA | 3.0 | 2.0 | 1436 | $1,300 | $0.91 | 43d | 1 | 0.69mi |
| 611 Pineview Dr Valdosta, GA | 1.0–3.0 | 1.0–2.5 | 1204 | $1,600 | $1.33 | 20d | 3 | 0.70mi |
| 2814 Kirkwood Cir Valdosta, GA | 4.0 | 2.0 | 1392 | $1,500 | $1.08 | 20d | 1 | 0.73mi |
| 1616 E Park Ave Valdosta, GA | 4.0 | 3.0 | 2508 | $2,100 | $0.84 | 43d | 1 | 0.79mi |
| 908 E Park Ave Valdosta, GA | 3.0 | 2.0 | 1612 | $1,650 | $1.02 | 20d | 1 | 0.88mi |
| 420 Connell Rd Valdosta, GA | 1.0–3.0 | 1.0–2.0 | 1051 | $1,375 | $1.31 | 20d | 8 | 1.05mi |
| 1503 E Park Ave Valdosta, GA | 1.0–3.0 | 1.0–2.0 | 890 | $1,260 | $1.42 | 43d | 54 | 1.08mi |
| 4125 Sedgwyck Ln Valdosta, GA | 3.0 | 2.0 | 1234 | $1,350 | $1.09 | 43d | 1 | 1.17mi |
| 2047 Meadow Cove Dr Valdosta, GA | 4.0 | 2.0 | 1892 | $2,100 | $1.11 | 43d | 1 | 1.26mi |
| 360 Brookfield Rd Valdosta, GA | 3.0 | 2.5 | 1278 | $1,100 | $0.86 | 43d | 1 | 1.29mi |
| 2515 Churchill Dr Valdosta, GA | 4.0 | 2.0 | 2140 | $1,550 | $0.72 | 43d | 1 | 1.49mi |
Listing history 16 events
-
2026-04-24status Pending 416-char remark
Show marketing remark (416 chars)
Opportunity awaits with this 4-bedroom, 3-bath home in a good location. The property features an open-concept living room, dining, and kitchen area, along with a spacious primary bedroom with an en-suite bath. The home has storm damage to the roof and will require repairs, offering a great chance for investors or buyers looking to renovate and build equity. With the right updates, this property could truly shine.
-
2026-04-24status Pending
Show marketing remark (416 chars)
Opportunity awaits with this 4-bedroom, 3-bath home in a good location. The property features an open-concept living room, dining, and kitchen area, along with a spacious primary bedroom with an en-suite bath. The home has storm damage to the roof and will require repairs, offering a great chance for investors or buyers looking to renovate and build equity. With the right updates, this property could truly shine.
-
2026-04-13price $153,000
Show marketing remark (416 chars)
Opportunity awaits with this 4-bedroom, 3-bath home in a good location. The property features an open-concept living room, dining, and kitchen area, along with a spacious primary bedroom with an en-suite bath. The home has storm damage to the roof and will require repairs, offering a great chance for investors or buyers looking to renovate and build equity. With the right updates, this property could truly shine.
-
2026-04-13price $153,000 416-char remark
Show marketing remark (416 chars)
Opportunity awaits with this 4-bedroom, 3-bath home in a good location. The property features an open-concept living room, dining, and kitchen area, along with a spacious primary bedroom with an en-suite bath. The home has storm damage to the roof and will require repairs, offering a great chance for investors or buyers looking to renovate and build equity. With the right updates, this property could truly shine.
-
2026-03-09$162,700 Active 416-char remark
Show marketing remark (416 chars)
Opportunity awaits with this 4-bedroom, 3-bath home in a good location. The property features an open-concept living room, dining, and kitchen area, along with a spacious primary bedroom with an en-suite bath. The home has storm damage to the roof and will require repairs, offering a great chance for investors or buyers looking to renovate and build equity. With the right updates, this property could truly shine.
-
2026-03-09$162,700 Active
Show marketing remark (416 chars)
Opportunity awaits with this 4-bedroom, 3-bath home in a good location. The property features an open-concept living room, dining, and kitchen area, along with a spacious primary bedroom with an en-suite bath. The home has storm damage to the roof and will require repairs, offering a great chance for investors or buyers looking to renovate and build equity. With the right updates, this property could truly shine.
-
2022-10-04soldstatus $219,500
-
2022-09-30soldstatus $219,500 Closed
-
2022-08-26historical
-
2022-06-30$219,500
-
2021-11-17soldstatus $50,000
-
1999-11-01soldstatus $67,900
-
1989-09-22soldstatus $15,900
-
1977-02-15soldstatus $32,500
-
1972-10-30soldstatus $25,200
-
1972-02-16soldstatus $11,000
ⓘ Source: listings_history table (triggers on properties + properties_extension) + one-shot
backfill from property_details.listing_events for pre-trigger history.
Tax reassessment forecast GA · Resets to sale price
- Current annual tax
- $676 · $56/mo
- Projected year-2 tax
- $1,408 · $117/mo
- Expected delta
- +$732/yr (+$61/mo · 108.3%)
ⓘ Screening estimate from a state-policy table — verify with the county assessor before closing.
Climate risk First Street
- Flood 1/10 Low FEMA zone X (unshaded) · 0% chance over 30 yrs
- Wildfire 3/10 Moderate
- Heat 8/10 Severe 7 d/yr ≥108°F today · 19 d/yr by 30 yrs out
- Wind 9/10 Extreme 99% chance of damaging wind over 30 yrs
- Air quality 6/10 Major 10 unhealthy d/yr today · 11 by 30 yrs out
Nearby sold comps map
Loading sold comps map…
Walkable amenities ~0.75 mi
Loading nearby amenities…
Taxation est. · year 1
- Rental income
- $19,280
- − Mortgage interest
- −$8,570
- − Property taxes
- −$676
- − Insurance
- −$765
- − Repairs & maintenance
- −$1,542
- − Management
- −$1,542
- − Depreciation
- −$4,451
- Taxable income
- $1,733
- Est. tax owed @ 24.0%
- −$416
- After-tax cash flow
- $3,746/yr
For passive investors: Depreciation is non-cash, so a rental often shows a tax loss while cash-flowing — sheltering income. Rental losses are passive: they offset passive income freely, and up to $25,000/yr can offset ordinary (W-2) income if you actively participate and your MAGI is under $100k (phasing out to $0 by $150k); unused losses carry forward. On sale, claimed depreciation is recaptured at up to 25%, and gains may owe capital-gains tax (a 1031 exchange can defer both). Figures are a year-1 estimate at your 24.0% rate — not tax advice; consult a CPA.
Schools (NCES district)
- District
- Valdosta City
- NCES district ID
- 1305310
- Math proficiency
- 15% ▼ -12.00%
- Reading proficiency
- 22% ▼ -7.00%
- Median HH income
- $30,634
- Composite
- 14.79/100
- National rank
- #9388
- State rank
- #149 of 174 in GA
Livability — Valdosta
- Score
- 60/100
- State rank
- #392
- US rank
- #19544
Category grades
Schools grade is shown separately in the Schools card above.
Census & demographics
- Census place
- Valdosta, GA
- County
- Lowndes County · 107,801 people
- City population
- 91,859
- Metro
- Valdosta, GA
- Population (ZIP)
- 35,728
- Household income
- $56,939
- Rent vs Own
- Severe rent burden
- 2034.0
Population outlook (Lowndes County) Hauer SSP2
- Today (2025)
- 120,348 people
- By 2030
- 123,469 · +2.6%
- By 2040
- 128,482 · +6.8%
- By 2050
- 131,907 · +9.6%
- By 2075
- 139,080 · +15.6%
- By 2100
- 133,649 · +11.1%
Race, ethnicity, and origin ACS 2023
- Neighborhood character
- Diverse neighborhood (Simpson 0.61)
- Race & ethnicity
- White 45% Black 42% Hispanic / Latino 7% Two or more races 5% Asian 2%
- Hispanic origin (detail)
- Mexican 3% Puerto Rican 1%
- Common ancestry
- Italian 1% Slovak 1% Lithuanian 1%
- Foreign-born
- 4% · Canada
- Languages at home
- 94% English-only · Spanish 3% Other Indo-European 1% French/Haitian/Cajun 1%
Political lean MEDSL · Lowndes
- 2024 margin
- R (+18.0) · D 40.8% · R 58.8%
- 2008→2024 swing
- -8.6pp toward R · 2008: -9.4pp · 2024: -18.0pp
- All cycles
- 2024: R+18.0 2020: R+12.0 2016: R+18.2 2012: R+10.5 2008: R+9.4
Not yet ingested
- Civics
- —
Market trends
- HPI YoY
- ▼ -150.60%
- Current HPI
- 188.2012
- Rent YoY
- ▲ 4.19%
- Metro
- Valdosta, GA
- State GDP YoY
- ▲ 2.66%
- F500 in state
- 28
Industry mix (Fortune 500 HQ in GA)
| Industry | F500 HQs | Revenue |
|---|---|---|
| Paper / Packaging | 2 | $29B |
|
||
| Retail | 1 | $160B |
|
||
| Transportation / Logistics | 1 | $91B |
|
||
| Airlines | 1 | $62B |
|
||
| Consumer Goods | 1 | $47B |
|
||
| Utilities | 1 | $25B |
|
||
Price history
+1290.9% since first listed16 events — show timeline
- 2026-04-24 Pending — MBOR
- 2026-04-24 Pending — SGMLS
- 2026-04-13 Price Changed $153,000 SGMLS
- 2026-04-13 Price Changed $153,000 MBOR
- 2026-03-09 Listed $162,700 MBOR
- 2026-03-09 Listed $162,700 SGMLS
- 2022-10-04 Sold (Public Records) $219,500 Public Records
- 2022-09-30 Sold (MLS) $219,500 SGMLS
- 2022-08-26 Delisted — SGMLS
- 2022-06-30 Listed $219,500 SGMLS
- 2021-11-17 Sold (Public Records) $50,000 Public Records
- 1999-11-01 Sold (Public Records) $67,900 Public Records
- 1989-09-22 Sold (Public Records) $15,900 Public Records
- 1977-02-15 Sold (Public Records) $32,500 Public Records
- 1972-10-30 Sold (Public Records) $25,200 Public Records
- 1972-02-16 Sold (Public Records) $11,000 Public Records
Property tax history
-1.5%/yrLatest (2022): $676 · +17.7% YoY. Source: county tax records.
Cash-flow waterfall
monthlySold comps — $/sqft
last 12 mo · ≤1 miLoading sold comps…