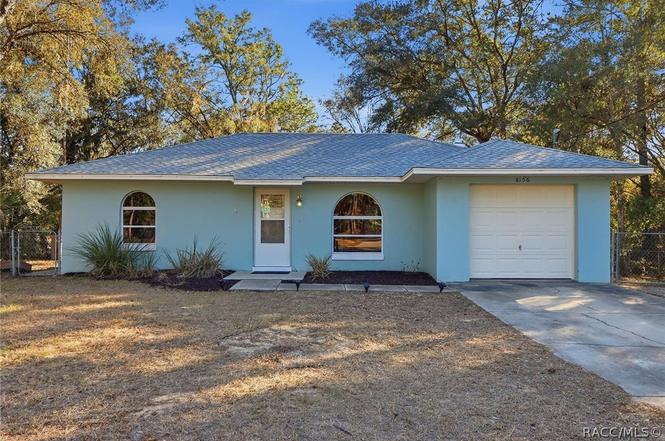
8156 W Basilico St · Crystal River, FL
Flood risk 1/10 · Minimal
- FEMA flood zone
- X (unshaded)
- Chance of flooding over 30 yrs
- 0.0%
- Est. flood insurance / yr
- $507 – $1,088
Fire risk 4/10 · Minor
- Est. fire insurance / yr
- $947 – $1,759
Heat risk 9/10 · Severe
- Hot days now (above 108°F)
- 6 days/yr
- Hot days in 30 yrs
- 20 days/yr
Wind risk 9/10 · Severe
- Chance of severe wind over 30 yrs
- 99.0%
Air-quality risk 2/10 · Minimal
- Unhealthy air days now
- 2 days/yr
- Unhealthy air days in 30 yrs
- 2 days/yr
Risk factors via First Street. Map © Google.
Why this score? — see what drove the F grade
The composite is a weighted blend of 9 inputs, each scored 0–100. Each bar is that input's sub-score; the figure is the points it added to the 100-point composite (weight × sub-score).
- Cash flow +14.5/30.0
- DSCR +4.4/10.0
- Schools +4.1/10.0
- Livability +3.3/5.0
- 1% rule +3.2/10.0
- Rent growth +2.5/5.0
- Condition / age +2.5/5.0
- ARV discount +0.0/15.0
- Appreciation +0.0/10.0
$249,900
🖨 Deal sheet (PDF) 📄 Offer letter ✓ Due diligence
Listing remarks
Welcome home! Come check out this updated 3 bedroom, 2 bathroom home sitting on a fully fenced in . 30-acre lot. Recent updates include a BRAND NEW roof, BRAND NEW AC, BRAND NEW appliances, BRAND NEW concrete driveway and sidewalk , lighting fixtures, and fresh interior paint throughout. Both bathrooms have been updated with new vanities and toilets, and the kitchen sink features new sink with new faucet. Additional upgrades include modern locksets keyed alike, new dryer vent, and brand new water filtration system with well pressure tank. Enjoy outdoor living with a freshly painted lanai, freshly painted garage, and a durable 10x12 Lifetime shed for extra storage. A recent termite inspecti
Key facts
- Brand new roof
- New appliances
- Brand new ac
Tags
Property features AI
Exterior
- Parking: Attached garage (1-car); Driveway with concrete surfaces
- Utilities: Private well water; Septic tank sewer
- Home design: Single family residence; One level
- Construction: Block foundation; Block and concrete construction; Asphalt shingle roof
- Exterior features: Wooded lot; Paved road frontage on a county road; Outdoor pool (none listed as applicable)
Interior
- Kitchen: Electric cooktop; Electric oven
- Flooring: Tile
- Bathrooms: 2 full bathrooms
- Heating & cooling: Heat pump heating; Central air conditioning
- Interior features: Tile flooring
- Laundry & utility: Washer; Dryer
Neighborhood map
What this means for you Summary
Snapshot
- This is a 3-bed/2.0-bath single-family listed at $250k.
Deal economics
- At list price, monthly cash flow is $53 ($642/yr) — positive.
- The deal already cash-flows at list — no discount required.
- To meet the 1% rule (rent ≥ 1% of price), the offer needs to be $204k (18.4% below list).
- Recommended offer: $204k (18.4% below list) — sets the bar for 1% rule.
- Cap rate 6.5% vs local median 2.5% in Crystal River — top-decile yield for the area; either an underpriced asset or a hidden risk that comps aren't pricing in. Stress-test before assuming the spread holds.
Location & tenants
- Location reads 66/100 on livability (#603 in FL) — a middle-class / working-renter tenant base. Strengths: crime A+, cost of living A+; Watch: health & safety C-, amenities F, commute F.
- Citrus (rural): math 49% / reading 50% proficiency, ranked #44 of 73 in FL (top 60%) — families likely to look elsewhere, expect single-tenant / working-renter base with shorter leases.
- Zoned schools: Crystal River Primary School (math 45% / reading 55%, grade D+, #1,070 of 2,144 statewide, top 51%, 654 students, 70% FRL); Crystal River Middle School (math 49% / reading 47%, grade C-, #286 of 571 statewide, top 50%, 900 students, 64% FRL); Crystal River High School (math 31% / reading 44%, grade F, #336 of 667 statewide, top 51%, 1,249 students, 56% FRL).
- Market conditions: 322 active listings in the ZIP; 2,443 units permitted in Citrus County in 2024 (0 in 5+ unit buildings).
- At $2,040/mo this rent would consume 48% of the median local household income ($51k/yr) (locally 264% of renters already pay >50% of income on rent) — very limited rent-growth headroom before tenants either downsize or default.
Forward outlook
- Local home prices are declining (-3.0%/yr); year-one equity from $2k of loan paydown is wiped out by about $7k of value loss. Plan a longer hold.
- Citrus County population projected to shrink 10% by 2050 — rents likely to lag national; underwrite the cash flow, not the appreciation.
Negotiation context
- It's been on market 130 days — a 12% lower offer ($220k) is reasonable based on typical stale-listing flexibility.
- Current owner paid $168k; 48% above their basis — modest negotiation headroom, anchor on the comps not their cost.
Risks & watch-outs
- Climate carrying-cost: severe wind risk, 99% chance of damaging wind over 30y; extreme-heat days projected 6→20/yr by 2055 (HVAC capex compounding) — expect insurance premiums to compound above CPI over the hold.
Questions for the listing agent
- It's been on market 130 days. Have you received any prior offers? Is the seller open to a 18% concession, seller financing, or rate buy-down credit?
- Why hasn't it sold? Are there any deal-killer items the seller is aware of (foundation, flood, title, zoning, code violations)?
- Is there a deadline driving the sale (1031 exchange, divorce, estate, relocation)? That informs how much negotiation room exists.
- Schools are D-rated, which usually means shorter tenancies and higher turnover. Who's the typical renter profile here, and what's been the actual vacancy rate?
- The area grade is low — what's the realistic commute time and amenity access for the typical tenant pool here? Any planned neighborhood developments (good or bad) we should know about?
- What's the average days-on-market for RENTAL listings here right now (not sales)? A rising rental-DOM trend means longer vacancies and softer asking-rent achievability than the comps imply.
- What's the recent tenant-quality profile in this submarket — average credit score on applications, eviction rate, late-payment / NSF rate, and stable-employment percentage? A property-management company in the area should have these aggregated.
- How much new for-sale + rental construction is in the pipeline within 1–3 miles? Heavy new supply typically softens prices + rents 12–24 months out; constrained supply supports both.
Investment metrics
- 1% rule
- 0.82% ✗
- Cap rate
- 6.55%
- Cash-on-cash
- 0.92%
- DSCR
- 1.04
- GRM
- 10.2
CMA / ARV
- ARV (on-the-fly)
- $187,968
- Comps found
- 4
Show comp detail 4 sales within ~0.75 mi
| Address | Dist | Beds/Ba | Sqft | Sold | Price | $/sf | Match |
|---|---|---|---|---|---|---|---|
| 8734 N Reina Loop | 0.20mi | 3/2.0 | 1,092 (+2%) | 1mo | $129,000 | $118 | 86 |
| 8650 N Catapane Loop | 0.27mi | 3/2.0 | 1,092 (+2%) | 2mo | $197,798 | $181 | 82 |
| 8748 N Discalfani Loop | 0.25mi | 3/2.0 | 1,092 (+2%) | 5mo | $192,500 | $176 | 80 |
| 8120 W Milano Ln | 0.12mi | 3/2.0 | 1,010 (-5%) | 18mo | $140,000 | $139 | 70 |
Match score weights: distance 35% · size 25% · config 20% · recency 20%. Top-matched comps best support the ARV.
Projected returns pro-forma
-3.0% appreciation · 3.0% rent growth · sell at horizon
- IRR
- -14.9%
- Equity multiple
- 0.47×
- Total profit
- $-37,161
- Equity at exit
- $37,261
- IRR
- -6.3%
- Equity multiple
- 0.60×
- Total profit
- $-28,268
- Equity at exit
- $21,607
Cash invested: $69,972 (down + closing). Projections, not guarantees.
Landlord ↔ Tenant lean methodology
- Overall (STATE)
- 87 Strongly Landlord-Friendly
- State Florida
- 87 Strongly Landlord-Friendly · R+3
- County
- — inherits STATE
- City
- — inherits STATE
ZIP-level market 34428
- Home prices YoY
- -15.3%
- Active inventory
- 322
- Price-to-rent
- 10.2×
Monthly cashflow live
- Estimated rent
- $2,040 medium interval (Pro) →
- Mortgage (P&I)
- −$1,311
- Tax from tax record
- −$144 /mo · $1,724/yr
- Insurance
- −$104
- HOA
- −$0
- Vacancy / Maint / Mgmt
- −$428
- Net cashflow
- $53
Break-even live
Sensitivity live
| Price | -10% $195 | -5% $124 | +0% $53 | +5% $-17 | +10% $-88 |
|---|---|---|---|---|---|
| Rent | -10% $-108 | -5% $-27 | +0% $53 | +5% $134 | +10% $215 |
| Rate | -1.0pp $179 | -0.5pp $117 | base $53 | +0.5pp $-11 | +1.0pp $-77 |
UW: 25.0% down · 7.5% · 30yr · 1.5% tax · 5.0% vac · 8.0% maint · 8.0% mgmt
Financing live
Cash to close
- Down payment
- $62,475
- Closing costs
- $7,497
- Reserves months
- —
- Total cash needed
- —
Loan-product check · same deal, 3 products live
Conventional
25% down · 7.5% · 30yr
- Down + closing
- —
- Monthly P&I
- —
- Monthly cashflow
- —
- DSCR
- —
- Eligible?
- —
Personal DTI + credit; lowest rate.
DSCR
20% down · 8.5% · 30yr
- Down + closing
- —
- Monthly P&I
- —
- Monthly cashflow
- —
- DSCR
- —
- Eligible?
- —
No personal income docs; deal must DSCR.
Hard money
10% down · 12.0% · 12mo
- Down + closing
- —
- Monthly P&I
- —
- Monthly cashflow
- —
- DSCR
- —
- Eligible?
- —
Short-term bridge; refi at stabilization.
Listing history 19 events
-
2026-06-21days on market $249,900 Active 130 DOM
-
2026-06-19days on market $249,900 Active 128 DOM
-
2026-06-18days on market $249,900 Active 127 DOM
-
2026-06-17days on market $249,900 Active 126 DOM
-
2026-06-16days on market $249,900 Active 125 DOM
-
2026-06-15price $249,900 Active 124 DOM
-
2026-06-15days on market $259,900 Active 124 DOM
-
2026-06-14days on market $259,900 Active 122 DOM
-
2026-06-13days on market $259,900 Active 121 DOM
-
2026-06-09days on market $259,900 Active 118 DOM
-
2026-06-08days on market $259,900 Active 117 DOM
-
2026-06-03days on market $259,900 Active 112 DOM
-
2026-06-02days on market $259,900 Active 111 DOM
-
2026-06-01days on market $259,900 Active 110 DOM
-
2026-05-31days on market $259,900 Active 109 DOM
-
2026-05-30days on market $259,900 Active 108 DOM
-
2026-03-18price $264,900
-
2026-02-11$274,900 Active
-
2021-04-21soldstatus $168,500
ⓘ Source: listings_history table (triggers on properties + properties_extension) + one-shot
backfill from property_details.listing_events for pre-trigger history.
Tax reassessment forecast FL · Resets to sale price
- Current annual tax
- $1,724 · $144/mo
- Projected year-2 tax
- $2,074 · $173/mo
- Expected delta
- +$350/yr (+$29/mo · 20.3%)
ⓘ Screening estimate from a state-policy table — verify with the county assessor before closing.
Climate risk First Street
- Flood 1/10 Low FEMA zone X (unshaded) · 0% chance over 30 yrs
- Wildfire 4/10 Moderate
- Heat 9/10 Extreme 6 d/yr ≥108°F today · 20 d/yr by 30 yrs out
- Wind 9/10 Extreme 99% chance of damaging wind over 30 yrs
- Air quality 2/10 Low 2 unhealthy d/yr today · 2 by 30 yrs out
Nearby sold comps map
Loading sold comps map…
Walkable amenities ~0.75 mi
Loading nearby amenities…
Taxation est. · year 1
- Rental income
- $24,483
- − Mortgage interest
- −$13,998
- − Property taxes
- −$1,724
- − Insurance
- −$1,250
- − Repairs & maintenance
- −$1,959
- − Management
- −$1,959
- − Depreciation
- −$7,270
- Taxable loss
- −$3,676
- Est. tax savings @ 24.0%
- +$882
- After-tax cash flow
- $1,524/yr
For passive investors: Depreciation is non-cash, so a rental often shows a tax loss while cash-flowing — sheltering income. Rental losses are passive: they offset passive income freely, and up to $25,000/yr can offset ordinary (W-2) income if you actively participate and your MAGI is under $100k (phasing out to $0 by $150k); unused losses carry forward. On sale, claimed depreciation is recaptured at up to 25%, and gains may owe capital-gains tax (a 1031 exchange can defer both). Figures are a year-1 estimate at your 24.0% rate — not tax advice; consult a CPA.
Schools (NCES district)
- District
- Citrus
- NCES district ID
- 1200270
- Math proficiency
- 49% ▼ -10.00%
- Reading proficiency
- 50% ▼ -6.00%
- Median HH income
- $38,618
- Composite
- 41.28/100
- National rank
- #3519
- State rank
- #44 of 73 in FL
Livability — Crystal River
- Score
- 66/100
- State rank
- #603
- US rank
- #11564
Category grades
Schools grade is shown separately in the Schools card above.
Census & demographics
- County
- Citrus County · 111,314 people
- City population
- 10,163
- Metro
- Homosassa Springs, FL
- Population (ZIP)
- 10,163
- Household income
- $50,779
- Rent vs Own
- Severe rent burden
- 264.0
Population outlook (Citrus County) Hauer SSP2
- Today (2025)
- 138,622 people
- By 2030
- 136,886 · -1.3%
- By 2040
- 132,009 · -4.8%
- By 2050
- 125,196 · -9.7%
- By 2075
- 108,570 · -21.7%
- By 2100
- 84,454 · -39.1%
Race, ethnicity, and origin ACS 2023
- Neighborhood character
- Predominantly White (88%)
- Race & ethnicity
- White 88% Two or more races 6% Hispanic / Latino 5% Asian 2%
- Common ancestry
- Lithuanian 3% Romanian 3% Slovak 2%
- Foreign-born
- 5% · Canada, Jamaica, South Korea
- Languages at home
- 96% English-only · Spanish 3%
Political lean MEDSL · Citrus
- 2024 margin
- Solid R (+45.9) · D 26.8% · R 72.6%
- 2008→2024 swing
- -29.8pp toward R · 2008: -16.1pp · 2024: -45.9pp
- All cycles
- 2024: R+45.9 2020: R+41.0 2016: R+39.7 2012: R+21.9 2008: R+16.1
Not yet ingested
- Civics
- —
Market trends
- HPI YoY
- ▼ -57.32%
- Current HPI
- 317.7637
- Rent YoY
- —
- Metro
- Homosassa Springs, FL
- State GDP YoY
- ▲ 3.28%
- F500 in state
- 36
Industry mix (Fortune 500 HQ in FL)
| Industry | F500 HQs | Revenue |
|---|---|---|
| Industrial Technology | 2 | $29B |
|
||
| Insurance | 2 | $17B |
|
||
| Retail | 1 | $60B |
|
||
| Technology Distribution | 1 | $58B |
|
||
| Homebuilding | 1 | $35B |
|
||
| Technology Manufacturing | 1 | $35B |
|
||
Price history
+57.2% since first listed3 events — show timeline
- 2026-03-18 Price Changed $264,900 RACC
- 2026-02-11 Listed $274,900 RACC
- 2021-04-21 Sold (Public Records) $168,500 Public Records
Property tax history
+12.5%/yrLatest (2025): $1,724 · +6.2% YoY. Source: county tax records.
Cash-flow waterfall
monthlySold comps — $/sqft
last 12 mo · ≤1 miLoading sold comps…